Road safety management is one of the most important responsibilities of transportation authorities. Every day, agencies monitor accidents, emergency responses, safety inspections, and traffic violations. However, when performance data is stored across scattered spreadsheets and manual reports, it becomes extremely difficult to evaluate safety outcomes and respond quickly.
That is where the Road Safety Services KPI Dashboard in Excel becomes a powerful solution.
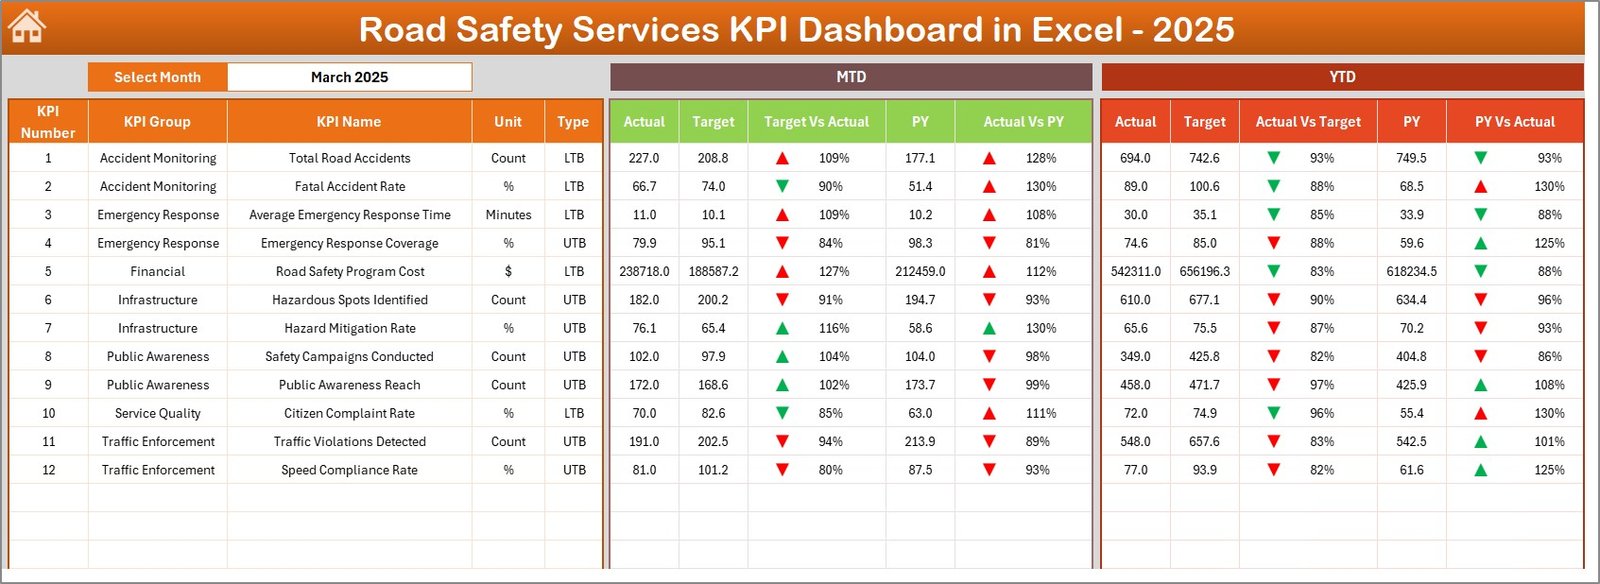
This ready-to-use Excel dashboard transforms complex road safety data into clear and visual insights. Instead of reviewing multiple reports, decision-makers can instantly monitor safety performance using interactive charts, KPI comparisons, and automated calculations.
The dashboard tracks Month-to-Date (MTD) and Year-to-Date (YTD) performance while comparing results against targets and previous year data. Because of this structured system, authorities can easily identify whether road safety performance is improving or declining.
If you want a structured and intelligent system for monitoring road safety performance, this dashboard offers exactly what you need.
🚦 Key Feature of Road Safety Services KPI Dashboard in Excel
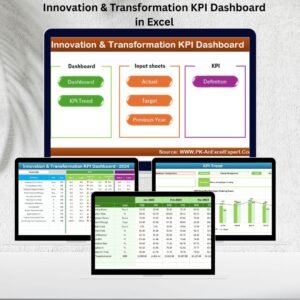
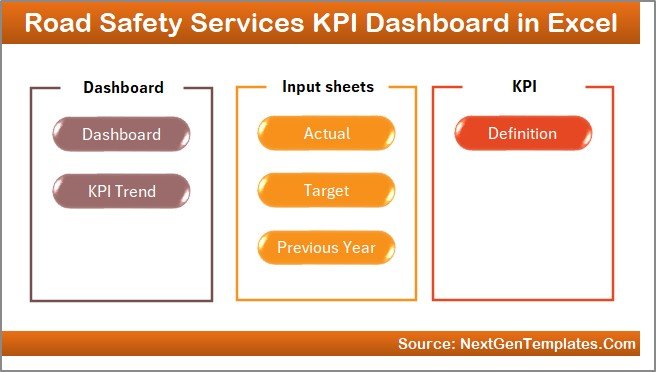
This dashboard is designed with 7 well-organized worksheets that together create a complete road safety performance monitoring system.
🏠 Home Sheet Navigation – A central index page with 6 interactive buttons that allow quick navigation across the dashboard.
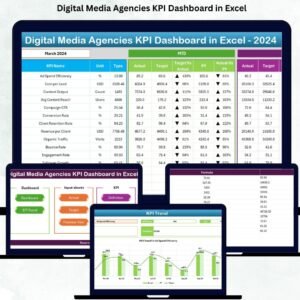
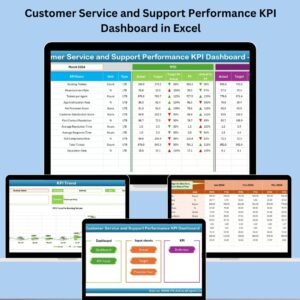
📊 Dynamic KPI Dashboard – The main dashboard where all KPIs are displayed. Users can select the reporting month from the dropdown in Cell D3, and the entire dashboard updates automatically.
📈 MTD & YTD Performance Tracking – Track both short-term and long-term safety performance simultaneously.
🎯 Target vs Actual Comparison – Evaluate whether KPIs are meeting safety targets.
🔄 Previous Year Comparison – Compare current safety performance with last year’s data.
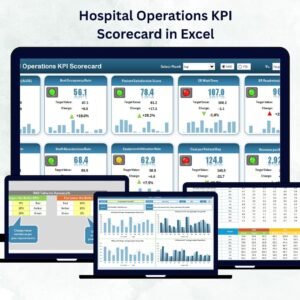
📉 Conditional Formatting Indicators – Up and down arrows visually highlight improvements or declines.
📊 Interactive KPI Trend Charts – Visual trend analysis for each KPI.
Because of these features, safety managers can quickly identify performance gaps and take corrective action.
📦 What’s Inside the Road Safety Services KPI Dashboard in Excel
The template includes 7 powerful worksheets, each designed for a specific purpose.
✅ Home Sheet
Acts as the dashboard navigation center with 6 quick-access buttons.
✅ Dashboard Sheet
Displays all KPI performance indicators including MTD Actual, Target, Previous Year values, and YTD comparisons.
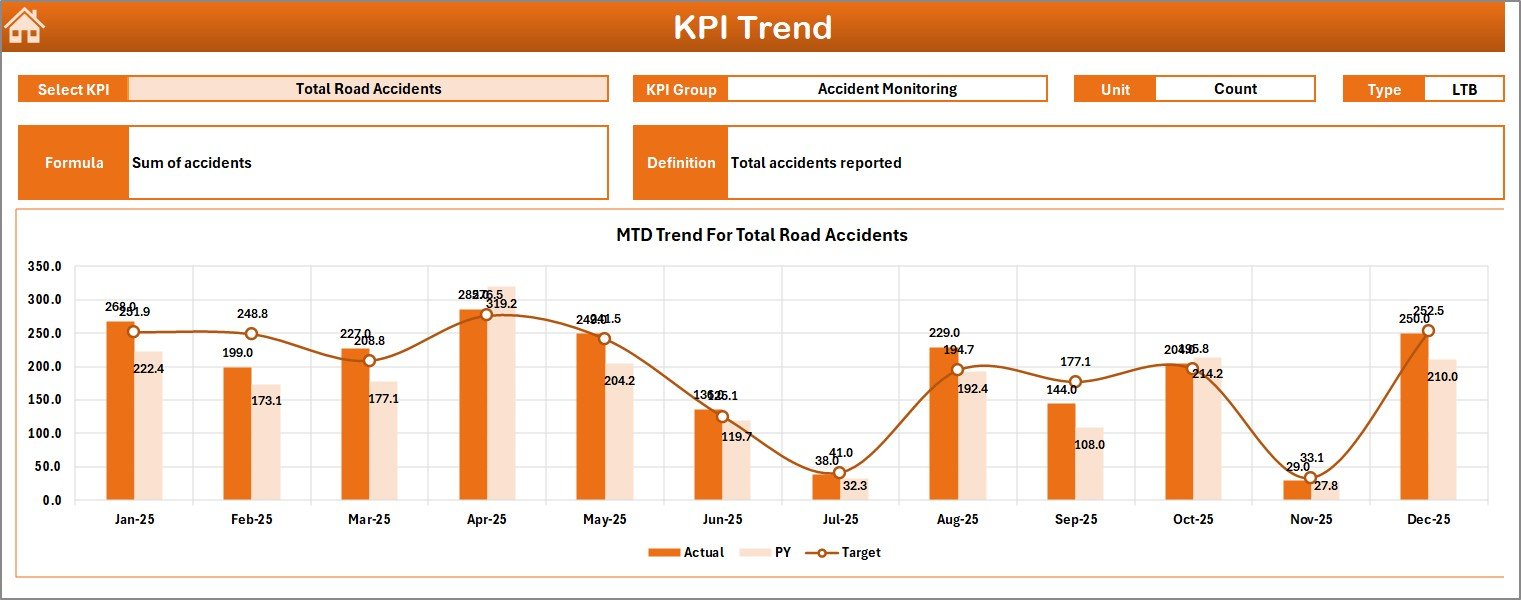
✅ KPI Trend Sheet
Allows users to select a specific KPI from a dropdown and analyze its MTD and YTD trends using visual charts.
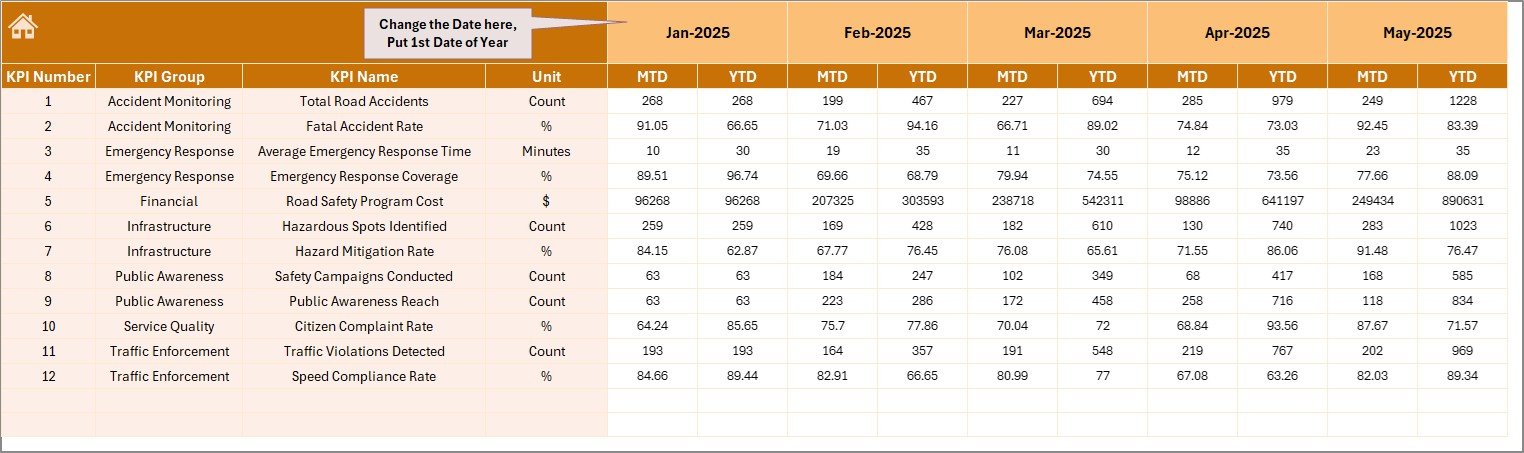
✅ Actual Numbers Input Sheet
Used for entering actual KPI performance values for each month.
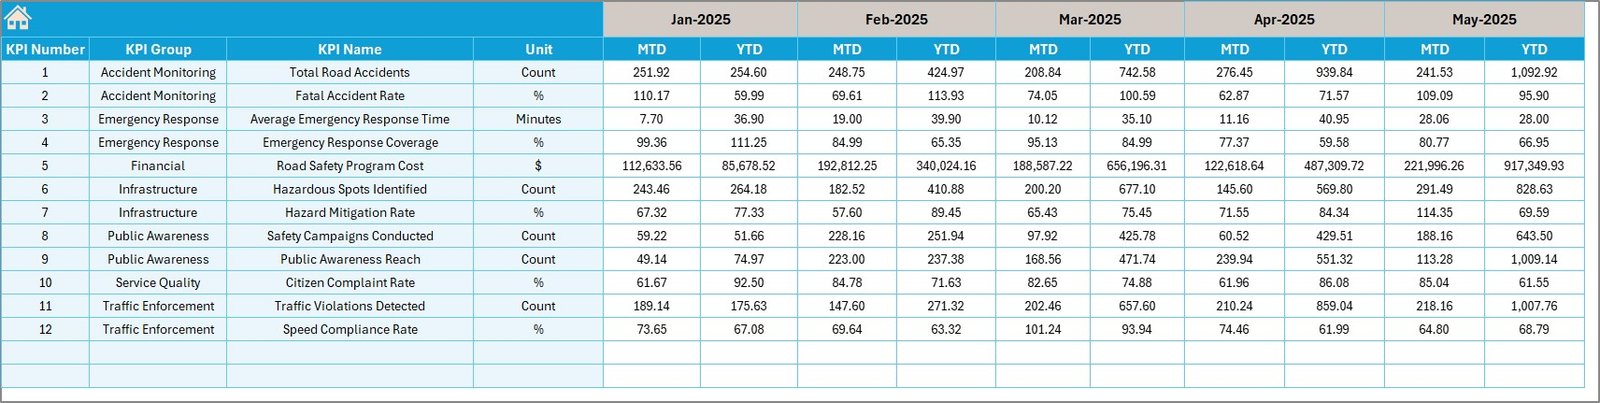
✅ Target Sheet
Stores the KPI targets for each month and year.
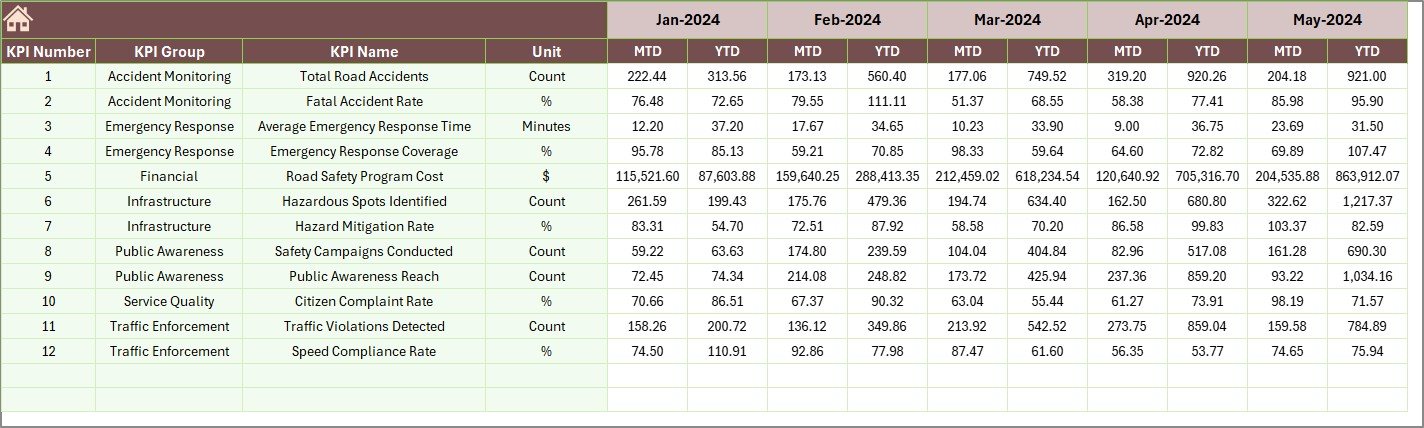
✅ Previous Year Numbers Sheet
Stores historical KPI data for benchmarking.
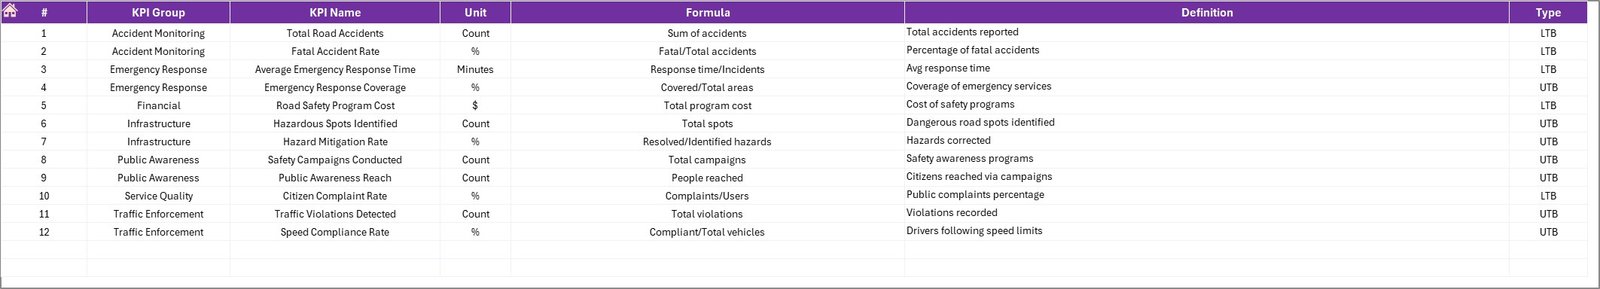
✅ KPI Definition Sheet
Documents KPI names, groups, formulas, units, and definitions for reference.
Because all worksheets work together, the dashboard provides a complete KPI monitoring framework.
⚙️ How to Use the Road Safety Services KPI Dashboard in Excel
Using the dashboard is straightforward.
1️⃣ Enter KPI names, groups, formulas, and definitions in the KPI Definition Sheet.
2️⃣ Input KPI targets in the Target Sheet.
3️⃣ Enter actual KPI values in the Actual Numbers Input Sheet.
4️⃣ Add historical data in the Previous Year Numbers Sheet.
5️⃣ Select the desired month from the dropdown in Cell D3 on the Dashboard sheet.
6️⃣ Analyze KPI performance and trends instantly.
Within seconds, the dashboard provides clear insights into road safety performance.
No advanced Excel skills are required.
👥 Who Can Benefit from This Road Safety Services KPI Dashboard in Excel
This dashboard is designed for organizations responsible for road safety monitoring.
It is especially useful for:
🚦 Road Safety Authorities
🚓 Traffic Management Departments
🏛 Government Transport Agencies
🚧 Highway Maintenance Teams
📊 Public Safety Analysts
🚗 Urban Mobility Planners
Because the dashboard simplifies complex safety data, both technical teams and senior leadership can easily understand performance insights.
💡 Why This Dashboard Improves Road Safety Management
✔ Centralized KPI monitoring
✔ Faster identification of safety risks
✔ Improved performance tracking
✔ Clear comparison with targets and previous year data
✔ Better safety policy planning
✔ Reduced reporting effort
✔ Stronger accountability across teams
✔ Easy customization for different road safety programs
Instead of relying on delayed reports, organizations gain real-time clarity into road safety performance.
This dashboard converts road safety data into actionable insights that help create safer roads.
### Click here to read the Detailed blog post
Visit our YouTube channel to learn step-by-step video tutorials
Youtube.com/@PKAnExcelExpert