Electric utility companies operate critical infrastructure every single day. Power lines, transformers, substations, and distribution networks must run smoothly. But here’s the problem — without structured KPI tracking, maintenance teams face rising downtime, unpredictable costs, and declining service quality.
What if you could monitor everything from one powerful, easy-to-use Excel dashboard?
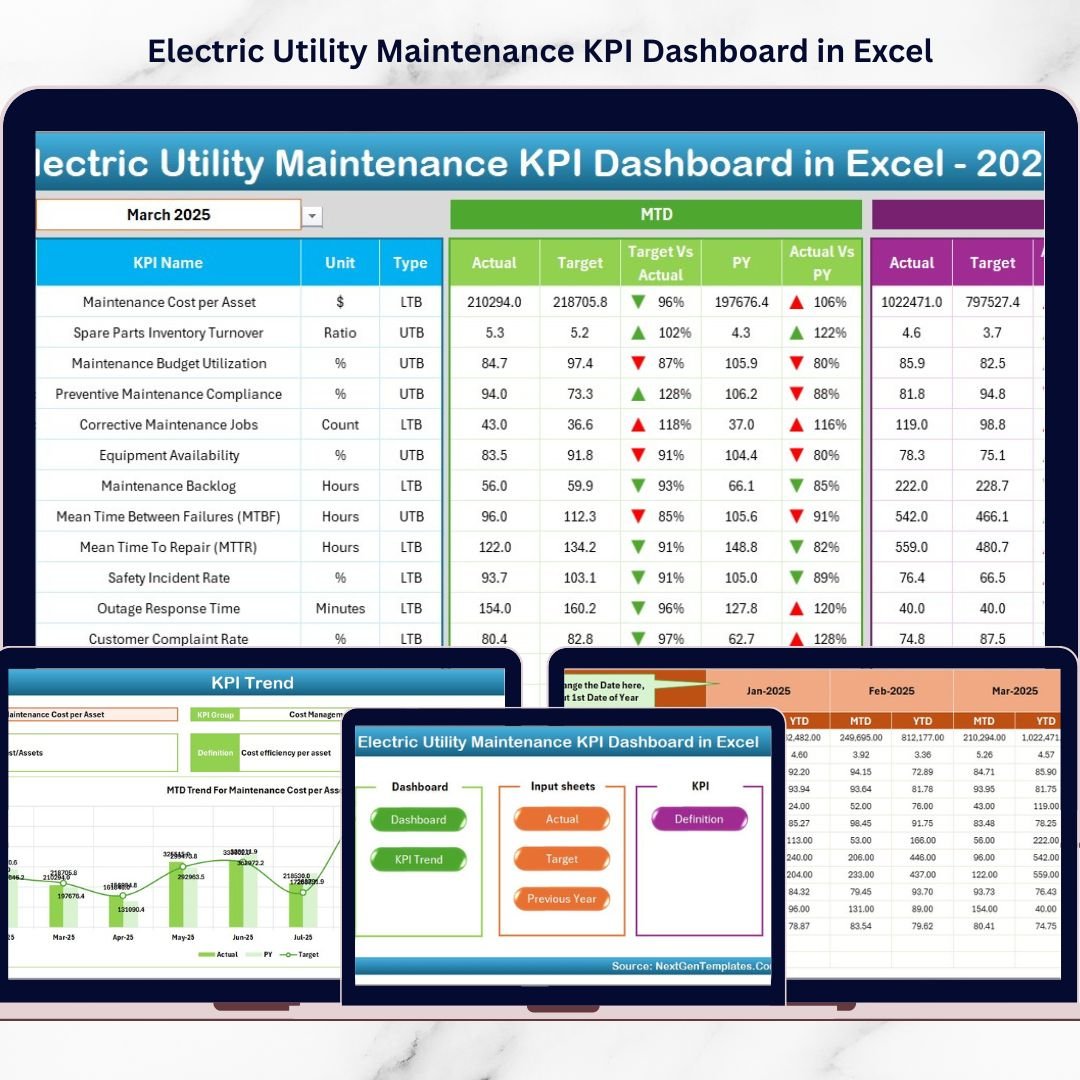
The Electric Utility Maintenance KPI Dashboard in Excel is your complete maintenance performance command center. It transforms scattered reports into a centralized, visual, and actionable system that helps you track targets, analyze trends, and make smarter decisions faster.
Stop reacting to failures. Start managing performance proactively.
🔥 Key Feature of Electric Utility Maintenance KPI Dashboard in Excel
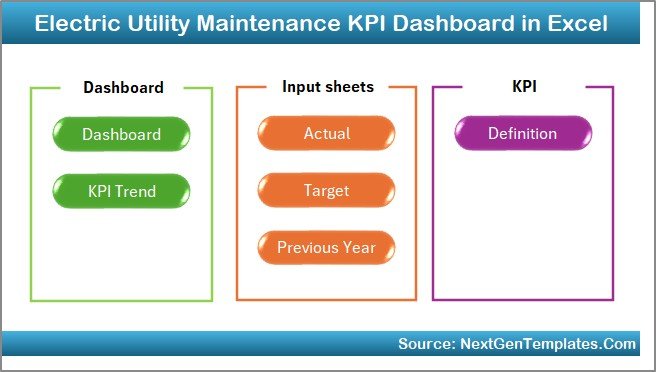
This ready-to-use Excel template includes 7 fully structured worksheets designed for total performance visibility.
✨ Interactive Home Sheet – Navigate instantly with 6 smart buttons.
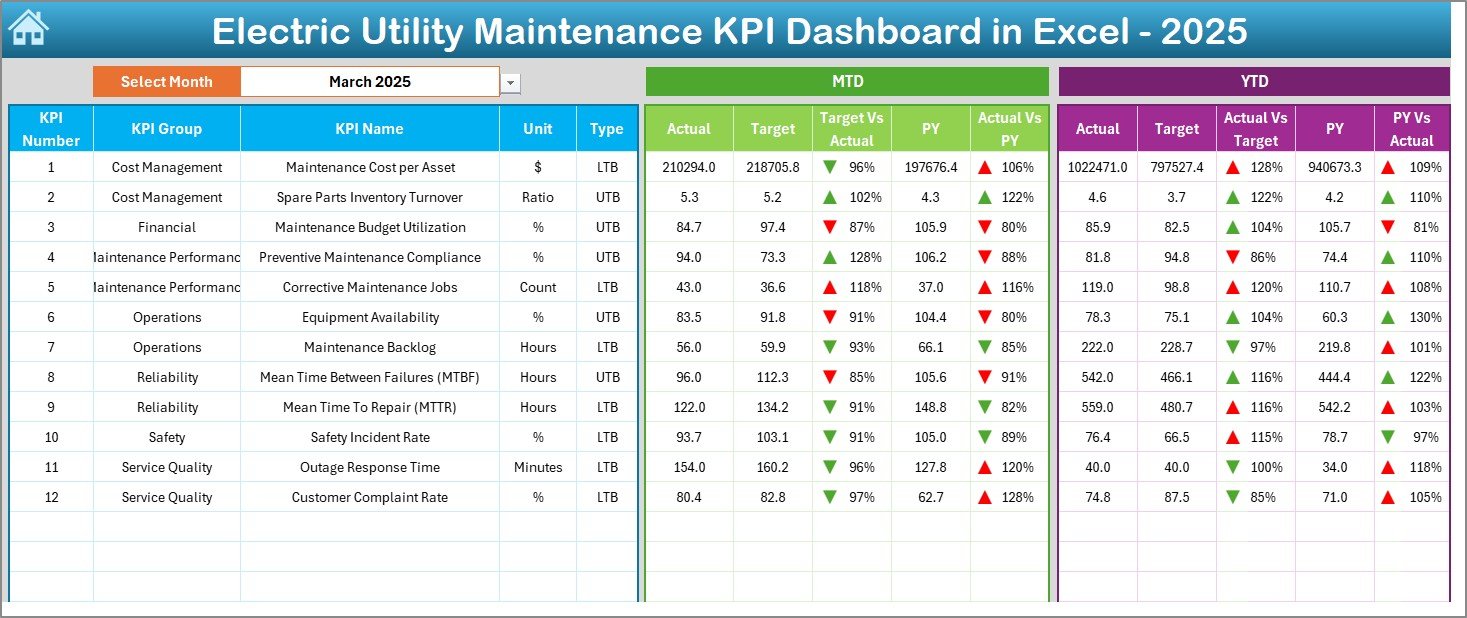
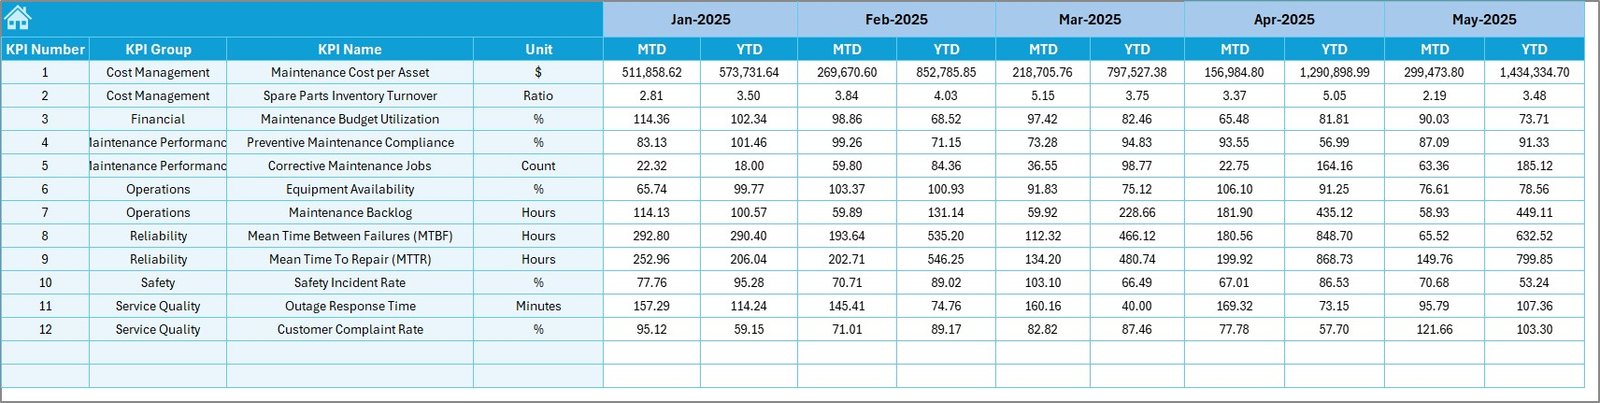
📊 Dynamic Dashboard Sheet – Select the month in Cell D3 and watch all KPIs update automatically.
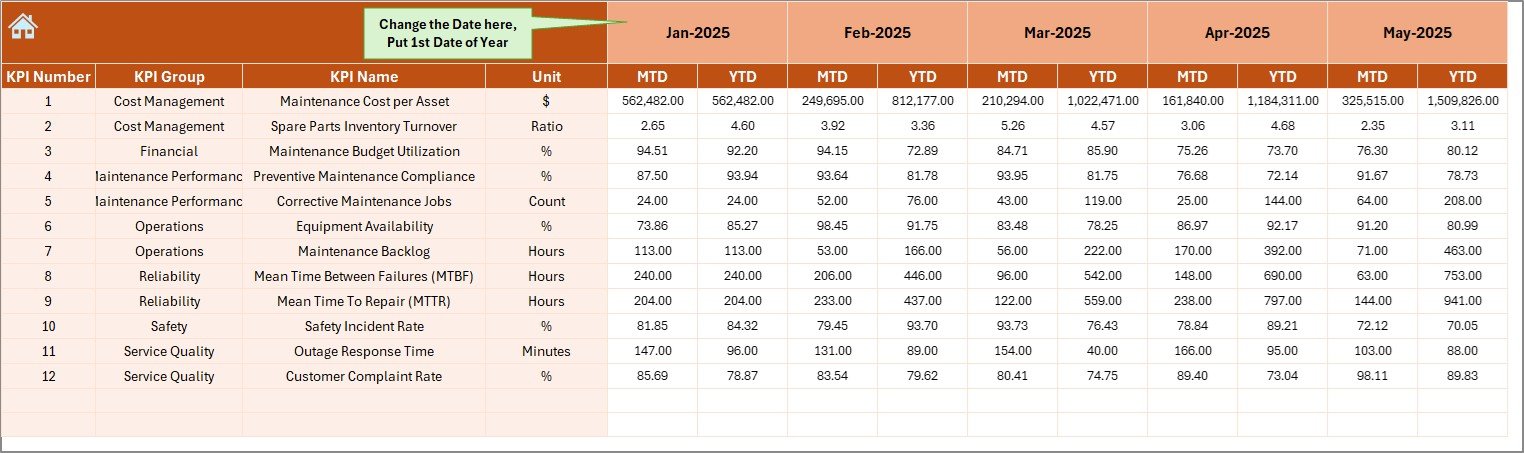
📈 MTD & YTD Tracking – Monitor short-term and long-term performance together.
🎯 Target vs Actual Comparison – Instantly identify gaps with clear performance visuals.
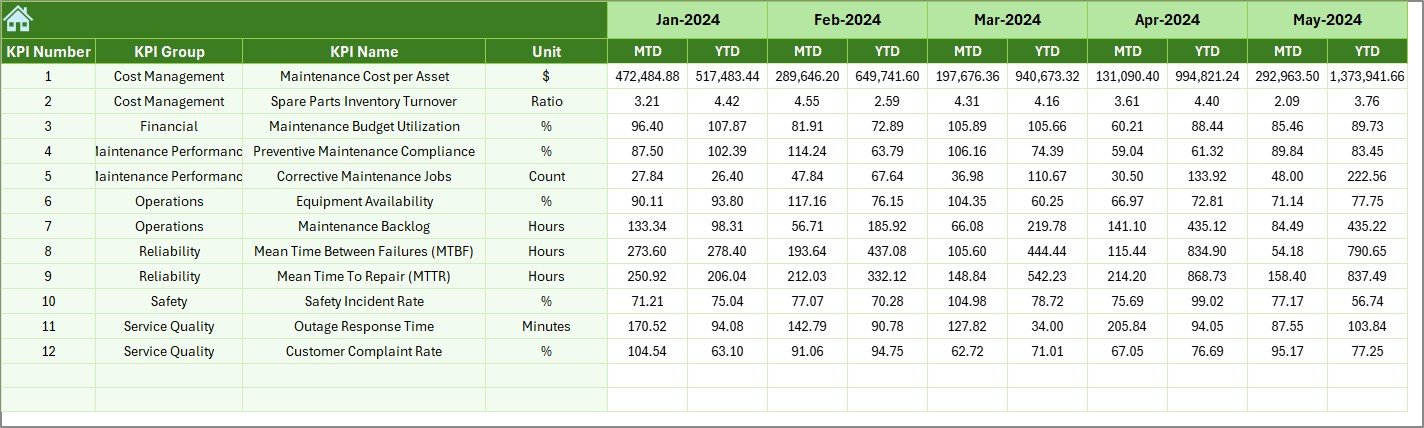
📉 Previous Year Benchmarking – Compare current numbers with historical data.
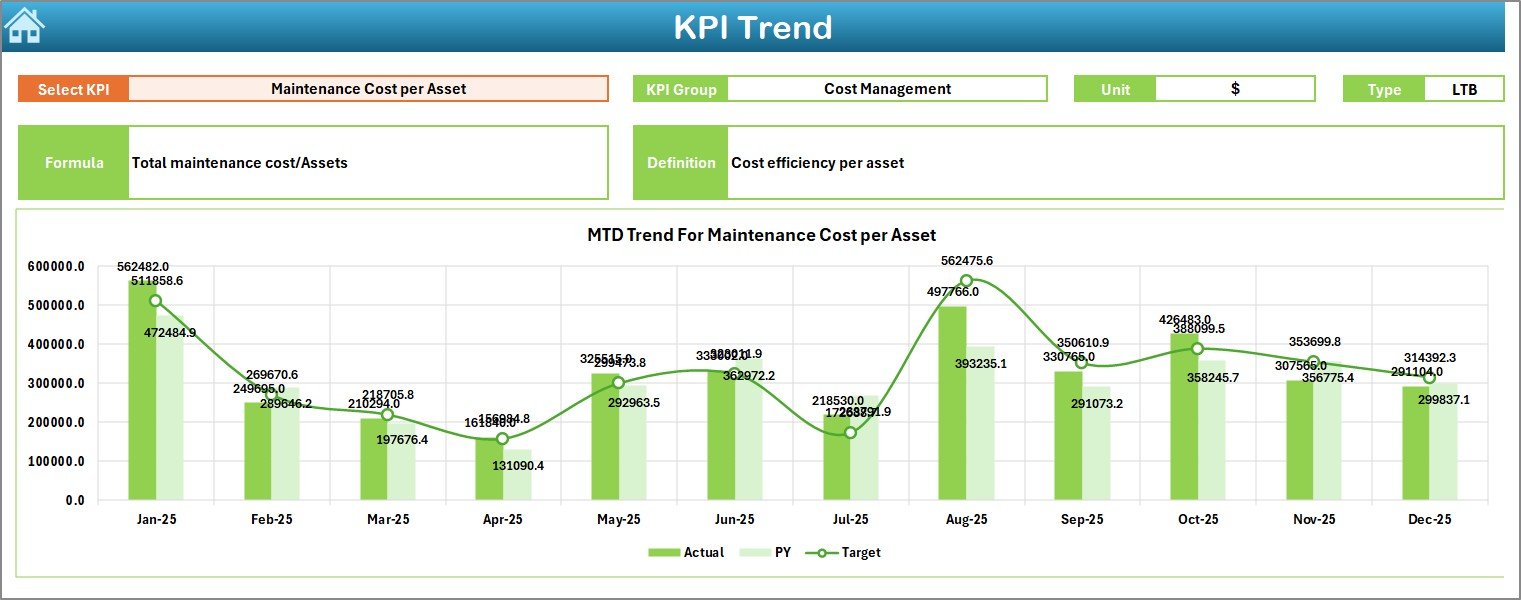
📊 KPI Trend Analysis – Visual charts for deeper performance evaluation.
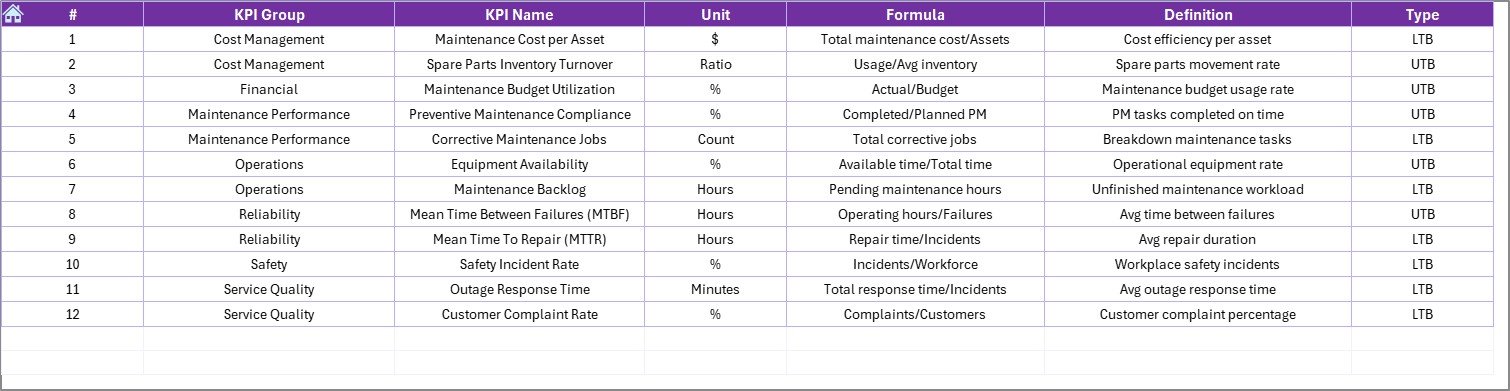
📘 KPI Definition Sheet – Clear formulas and definitions to avoid confusion.
Because of conditional formatting with up and down arrows, you instantly understand performance direction — no complicated analysis required.
📦 What’s Inside the Electric Utility Maintenance KPI Dashboard in Excel
This dashboard is more than just a report — it is a complete KPI management system.
Inside the template, you get:
✅ 7 professionally structured worksheets
✅ Organized input sheets for Actual, Target, and Previous Year data
✅ Dropdown-based KPI selection
✅ Automatic calculation of MTD and YTD values
✅ Visual performance indicators
✅ Fully customizable KPI structure
✅ Ready-to-use maintenance KPI examples
You can track reliability KPIs like SAIDI and SAIFI, maintenance KPIs like MTTR and MTBF, financial KPIs like Maintenance Cost per Asset, and safety KPIs like Incident Rate.
The best part? You can modify everything according to your utility’s needs.
⚙️ How to Use the Electric Utility Maintenance KPI Dashboard in Excel
You don’t need advanced Excel skills. Just follow these simple steps:
1️⃣ Enter KPI names, units, formulas, and definitions in the KPI Definition sheet.
2️⃣ Input monthly and yearly targets in the Target sheet.
3️⃣ Add actual performance data in the Actual Numbers sheet.
4️⃣ Enter last year’s data for comparison.
5️⃣ Select the month in Cell D3 on the Dashboard sheet.
6️⃣ Analyze trends using the KPI Trend sheet.
Within minutes, your maintenance performance becomes crystal clear.
👥 Who Can Benefit from This Electric Utility Maintenance KPI Dashboard in Excel
This dashboard is ideal for:
⚡ Maintenance Managers
⚡ Operations Managers
⚡ Utility Directors
⚡ Reliability Engineers
⚡ Asset Management Teams
⚡ Compliance Officers
If your role involves maintenance efficiency, reliability improvement, cost control, or regulatory reporting — this dashboard is built for you.
🚀 Why This Dashboard Changes the Game
✔ Centralized performance visibility
✔ Faster decision-making
✔ Reduced downtime risks
✔ Improved preventive maintenance
✔ Stronger accountability
✔ Better regulatory compliance
✔ Easy customization
✔ No expensive software required
Instead of chasing numbers across spreadsheets, you gain one structured and intelligent performance system.
If your utility struggles with scattered reports, inconsistent tracking, or unclear trends — this dashboard solves it.
### Click here to read the Detailed blog post
Visit our YouTube channel to learn step-by-step video tutorials
YouTube Channel


