
Hydropower projects are essential for clean energy—yet managing them is complex. You’re monitoring energy generation, turbine efficiency, maintenance schedules, safety performance, sustainability goals, and delivery outcomes… all while keeping targets on track. And when reporting still depends on manual spreadsheets and slow monthly updates, performance gaps stay hidden until they become costly.
That’s why we created the Hydropower Projects KPI Dashboard in Power BI 💧⚡📊
It’s a ready-to-use analytics solution that converts your raw Excel data into powerful, interactive insights. Instead of reviewing multiple sheets and reports, you get one professional Power BI dashboard where you can track hydropower KPIs clearly, compare performance instantly, and act faster with confidence.
This dashboard is built for practical performance monitoring. It automatically compares Actual vs Target, tracks MTD (Month-to-Date) and YTD (Year-to-Date) values, and benchmarks Current Year vs Previous Year—all with visual indicators that instantly show whether performance is moving in the right direction.
If your organization wants faster decision-making, stronger KPI accountability, and executive-ready reporting for hydropower operations, this dashboard is the perfect solution.
Key Feature of Hydropower Projects KPI Dashboard in Power BI
🚀 Ready-to-use Power BI KPI dashboard for hydropower operations and performance tracking
🎛️ Interactive slicers for Month and KPI Group to filter insights instantly
📌 3 KPI cards for quick performance status:
-
Total KPIs Count
-
MTD Target Meet Count
-
MTD Target Missed Count
📋 Detailed KPI table with complete MTD & YTD tracking:
-
KPI Number, KPI Group, KPI Name, Unit, Type (LTB/UTB)
-
Actual, Target, and Previous Year values
-
Target vs Actual % and CY vs PY %
-
Visual MTD/YTD icons (▲ green / ▼ red)
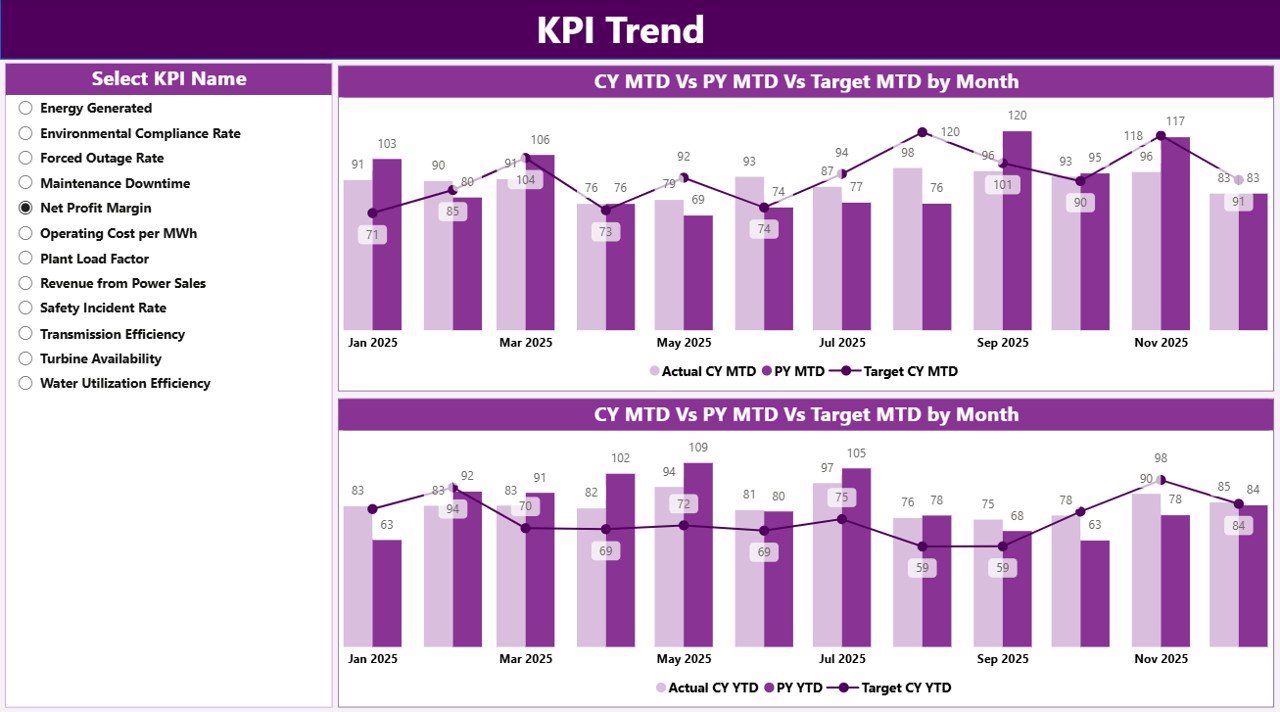
📈 KPI Trend Page with two combo charts:
-
MTD trend (CY vs PY vs Target)
-
YTD trend (CY vs PY vs Target)
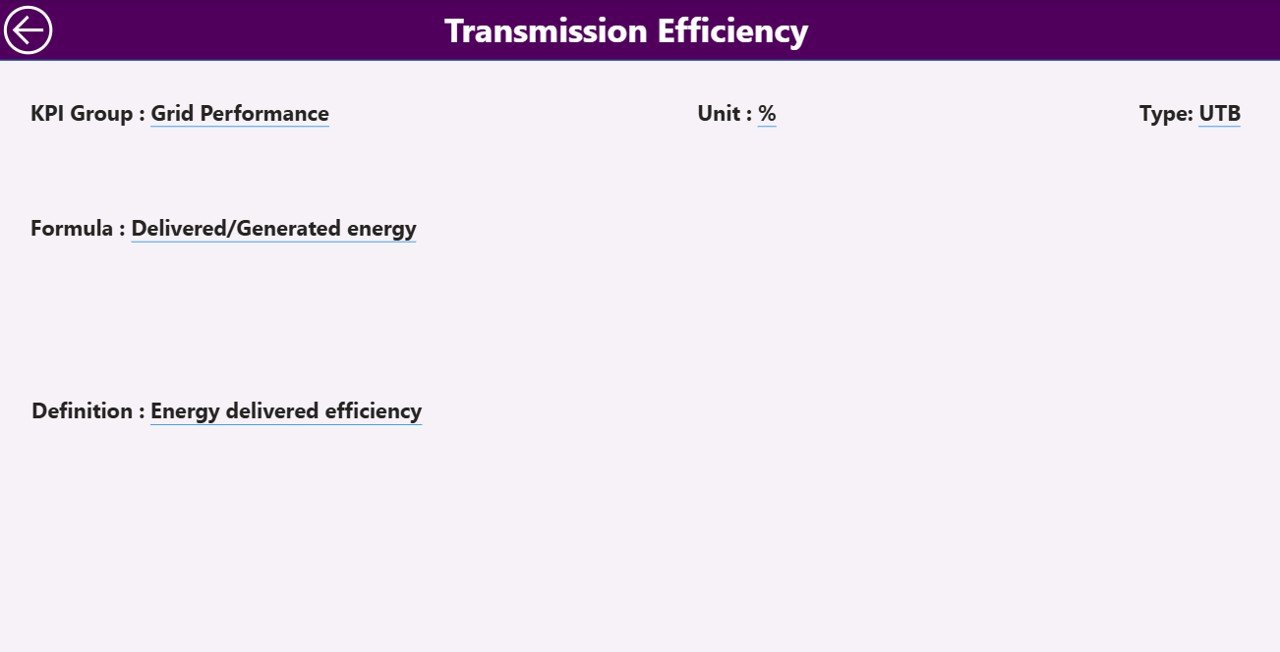
🧾 KPI Definition drill-through page for transparency:
-
KPI Formula, Definition, Unit, Type (LTB/UTB)
🔄 Excel-based data source—update Excel, refresh Power BI, and visuals update automatically
✅ Scalable architecture—add more KPIs anytime through the KPI Definition sheet
What’s Inside the Hydropower Projects KPI Dashboard in Power BI
This solution uses a clean 3-page dashboard design, built to support both quick review and deep analysis:
📌 1) Summary Page (Main Control Center)
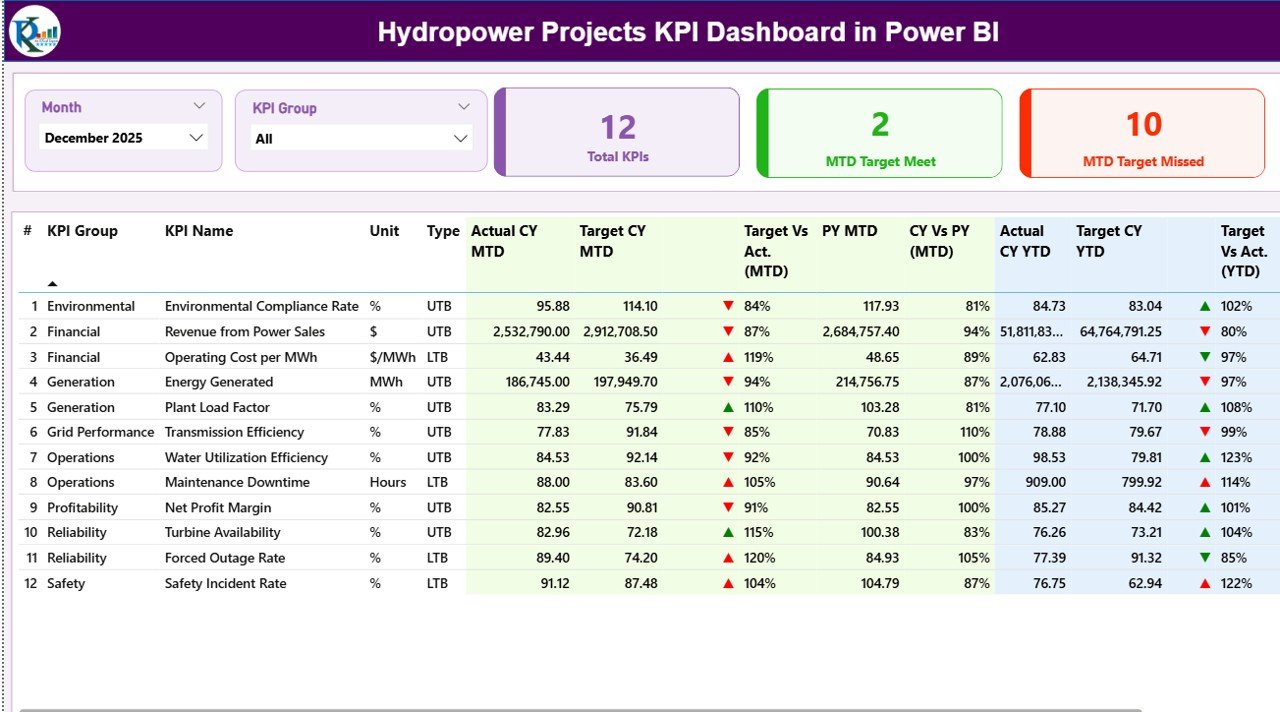
This is where leadership gets instant clarity. You can filter by Month and KPI Group, review the KPI cards, and analyze a detailed KPI table showing both MTD and YTD performance with target and previous-year comparisons.
📉 2) KPI Trend Page (Performance Over Time)
Select a KPI from the left-side slicer and analyze how performance moves month-by-month. The combo charts make it easy to spot seasonal changes, recurring issues, and target achievement patterns for both MTD and YTD.
📚 3) KPI Definition Page (Drill-Through Details)
Need to explain a KPI in a meeting? Simply drill through from the Summary table to see the KPI’s formula, definition, unit, and KPI type. This eliminates confusion and keeps reporting consistent across teams.
How to Use the Hydropower Projects KPI Dashboard in Power BI
This dashboard is designed so even non-technical users can run it smoothly:
1️⃣ Update the Excel data file (Actual, Target, and KPI Definitions)
2️⃣ Refresh Power BI to update all visuals automatically
3️⃣ Use slicers to filter month and KPI group
4️⃣ Review KPI cards and table to spot target misses and YoY changes
5️⃣ Go to KPI Trend page to analyze patterns and performance direction
6️⃣ Use drill-through to validate KPI definitions during reviews and audits
No advanced Power BI skills required—just update Excel and refresh.
Who Can Benefit from This Hydropower Projects KPI Dashboard in Power BI
This dashboard is perfect for:
💼 Hydropower Project Managers
⚙️ Operations & Plant Performance Teams
🛠️ Maintenance Engineers and Reliability Teams
📊 Renewable Energy Analysts and MIS Teams
💰 Finance & Cost Monitoring Teams
🌱 Environmental & Sustainability Teams
🧠 Executive Leadership and Strategy Teams
🤝 Energy Consultants and EPC stakeholders
If your team needs one shared “source of truth” for hydropower KPIs, this dashboard delivers it.
Click hare to read the Detailed blog post
Visit our YouTube channel to learn step-by-step video tutorials
Youtube.com/@PKAnExcelExpert


