Smart grid data is exploding—smart meters, automation systems, outage tools, renewable integration platforms… everything is generating KPIs every day. But here’s the problem: many utility teams still report performance using scattered spreadsheets, manual summaries, and slow monthly decks. That means trends get missed, performance gaps stay hidden, and decisions happen too late.
That’s why we created the Smart Grid Services KPI Dashboard in Power BI ⚡📊
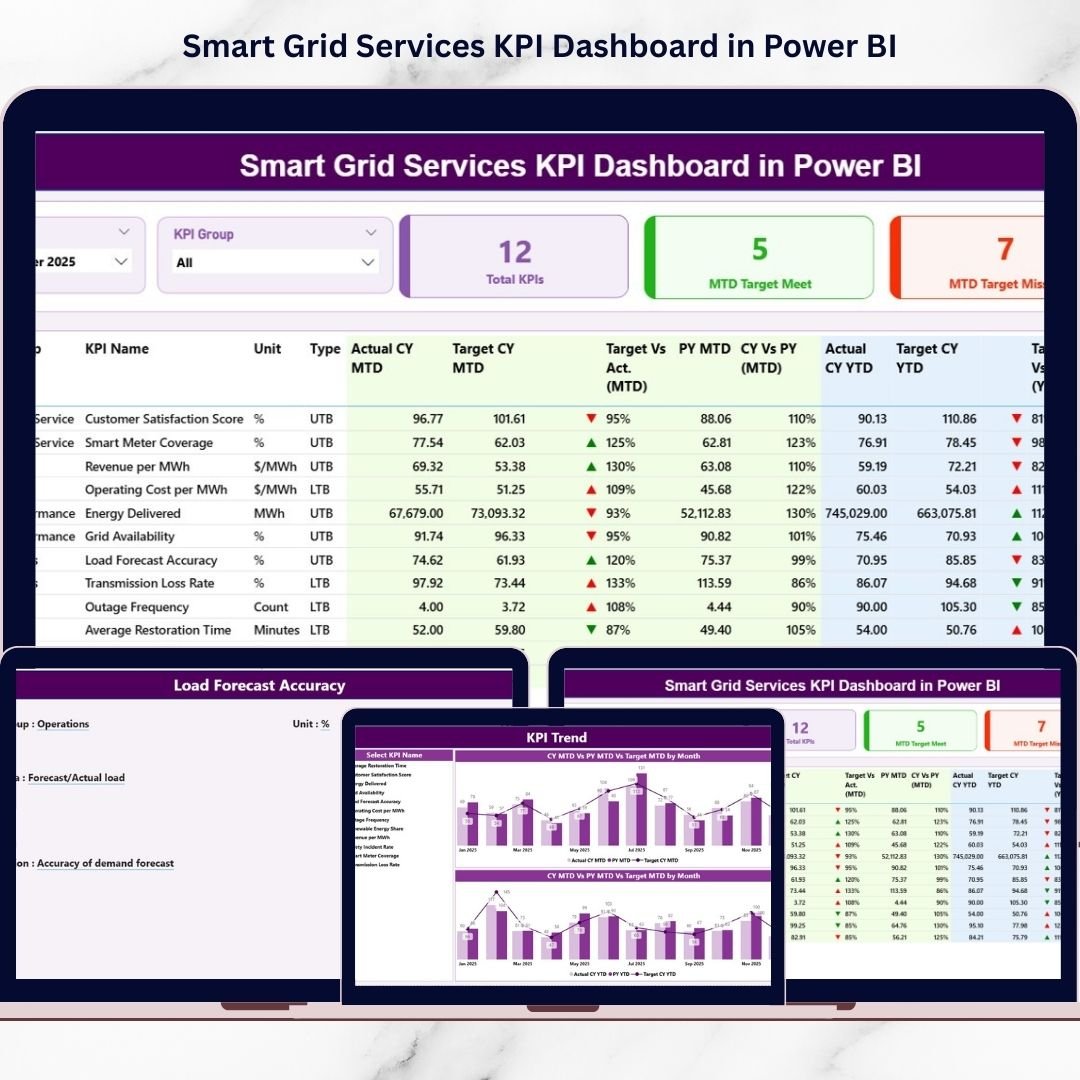
It’s a ready-to-use, interactive Power BI solution that turns your Excel-based operational data into a crystal-clear KPI command center. With smart slicers, KPI scorecards, trend charts, and drill-through definitions, your team can instantly understand Target vs Actual, compare Current Year vs Previous Year, and track both MTD (Month-to-Date) and YTD (Year-to-Date) performance—without complicated setup.
If you want executive-level insights with minimal effort, this dashboard is built for you.
Key Feature of Smart Grid Services KPI Dashboard in Power BI
🚀 Ready-to-use Power BI dashboard built for smart grid and utility KPI monitoring
🎛️ Interactive slicers for Month and KPI Group for instant filtering
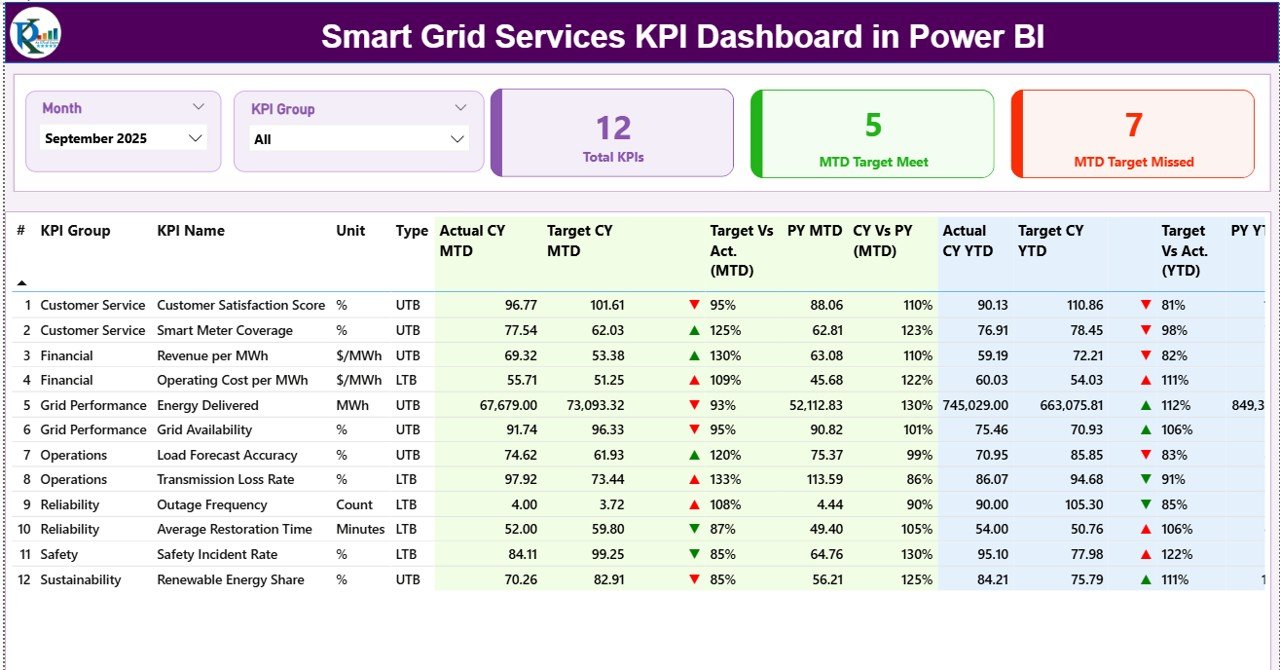
🧠 3 KPI cards to show performance at a glance:
-
Total KPI Count
-
MTD Target Meet Count
-
MTD Target Missed Count
📋 Detailed KPI performance table with full transparency:
-
KPI Group, Unit, Type (LTB/UTB)
-
MTD Actual/Target/PY + achievement %
-
YTD Actual/Target/PY + achievement %
-
Visual icons to highlight performance direction
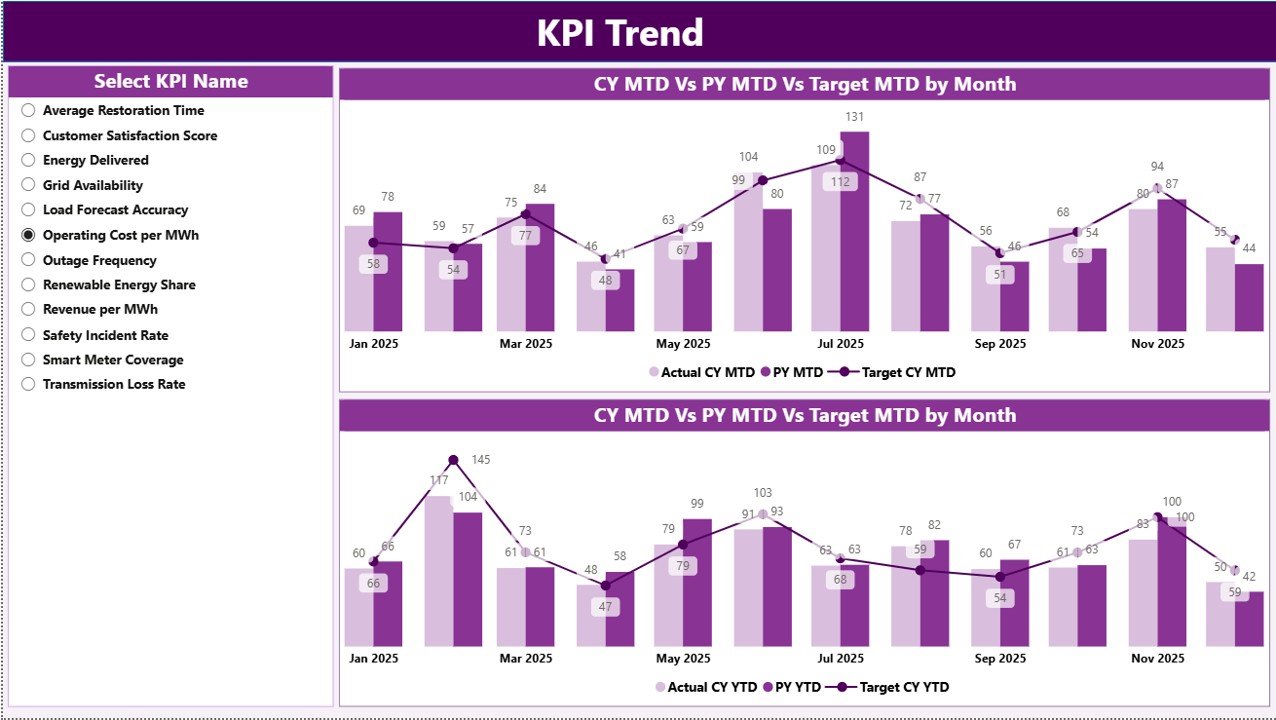
📈 KPI Trend Page with two combo charts:
-
MTD trend (CY vs PY vs Target)
-
YTD trend (CY vs PY vs Target)
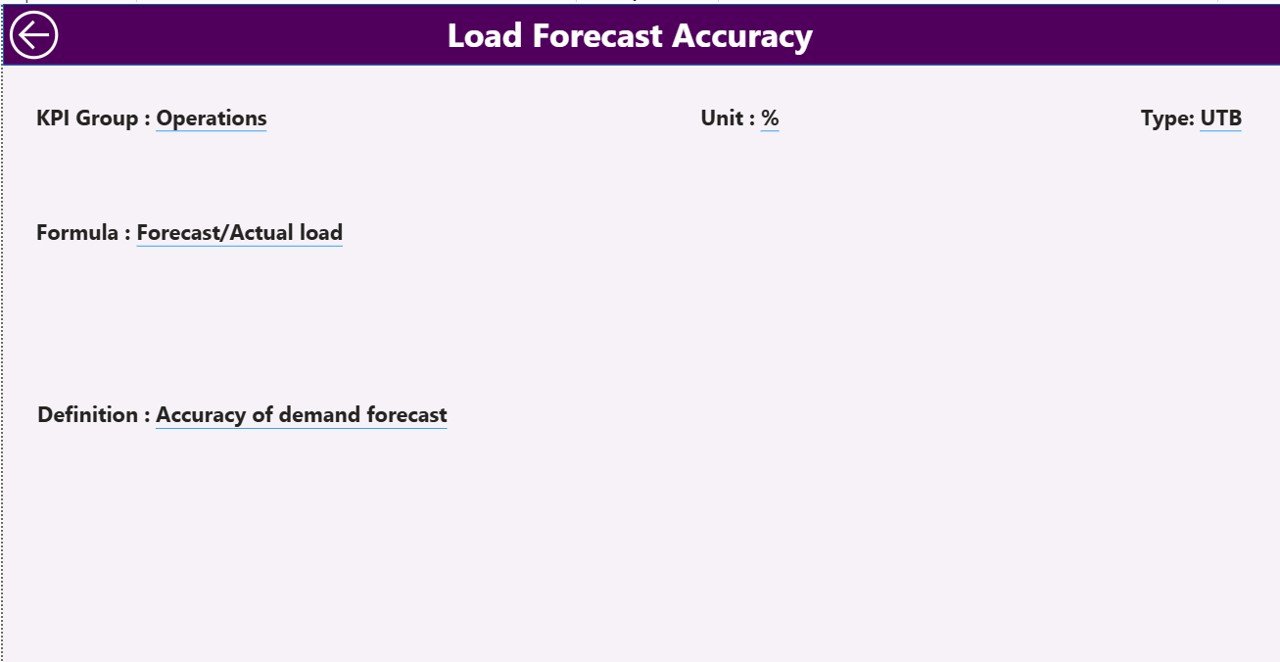
🧾 Drill-through KPI Definition Page to view KPI logic instantly:
-
Formula, definition, measurement logic, KPI type
🔄 Excel as data source (easy monthly update + Power BI refresh)
✅ Scalable design so you can add more KPIs anytime
What’s Inside the Smart Grid Services KPI Dashboard in Power BI
This Power BI solution follows a clean, professional 3-page structure:
📌 1) Summary Page (Main Dashboard)
Your central performance cockpit with slicers, KPI cards, and a detailed KPI table that shows MTD and YTD comparisons in one view.
📉 2) KPI Trend Page
A deep-dive analysis page where you select a KPI and instantly see how it’s moving month-by-month using trend visuals for both MTD and YTD.
📚 3) KPI Definition Page (Drill-Through)
A dedicated KPI transparency page. Right-click any KPI from the Summary table and open its formula, definition, KPI type, and logic—so there’s no confusion during review meetings.
📂 Excel Data Source Includes 3 Sheets
✅ Input_Actual – Month, KPI Name, MTD Actual, YTD Actual
🎯 Input_Target – Month, KPI Name, Target MTD, Target YTD
🧾 KPI Definition – KPI Number, Group, Name, Unit, Formula, Definition, Type (LTB/UTB)
How to Use the Smart Grid Services KPI Dashboard in Power BI
Using this dashboard is simple—even for non-technical users:
1️⃣ Prepare KPI Definitions
List your KPIs clearly with units, KPI group, and whether each KPI is LTB or UTB.
2️⃣ Enter Actual KPI Data (Monthly)
Update Input_Actual with MTD and YTD values for each KPI.
3️⃣ Enter KPI Targets
Update Input_Target with expected benchmarks (MTD and YTD).
4️⃣ Load/Connect Excel File in Power BI
Connect the Excel file once, then just update and refresh.
5️⃣ Refresh the Dashboard
Click Refresh in Power BI Desktop to update all visuals instantly.
6️⃣ Analyze Like a Pro
Use slicers to filter by month and group, open KPI trends, and drill through to KPI definitions whenever needed.
Who Can Benefit from This Smart Grid Services KPI Dashboard in Power BI
This dashboard is perfect for:
⚡ Utility Companies & Distribution Networks
📡 Smart Grid Operators & Grid Automation Teams
🧾 MIS / Reporting Teams & Data Analysts
🚨 Outage Management & Reliability Teams
🛠️ Maintenance, Asset, and Field Operations
📋 Compliance and Regulatory Monitoring Teams
🤝 Energy Consultants & Power Sector Project Managers
🧑💼 Leadership and performance review committees
If your organization wants faster reporting, clearer KPI accountability, and smarter decision-making, this template delivers.
Click hare to read the Detailed blog post
Visit our YouTube channel to learn step-by-step video tutorials
Youtube.com/@PKAnExcelExpert