The manufacturing industry is evolving faster than ever, and 3D printing (additive manufacturing) is at the center of this transformation. Companies can now produce complex components quickly, minimize material waste, and deliver customized products with precision. 3D Printing Manufacturing KPI Dashboard in Power BI However, despite technological advancements, many manufacturers still struggle to measure operational performance effectively.
Without structured performance monitoring, production inefficiencies remain hidden, machine utilization declines, and decision-making becomes reactive instead of strategic. That’s why modern manufacturers are shifting toward intelligent analytics solutions like the 3D Printing Manufacturing KPI Dashboard in Power BI.
The 3D Printing Manufacturing KPI Dashboard in Power BI is a ready-to-use business intelligence solution designed to convert raw manufacturing data into powerful visual insights using Key Performance Indicators (KPIs). Instead of reviewing multiple spreadsheets manually, managers can analyze performance instantly through interactive dashboards, dynamic filters, and automated calculations.
3D Printing Manufacturing KPI Dashboard in Power BI Built using Power BI and connected to Excel data sources, this dashboard provides enterprise-level analytics without complexity. As a result, organizations gain real-time performance visibility, improve operational control, and make faster data-driven decisions.
Whether you want to track machine efficiency, production timelines, quality performance, or operational targets, this dashboard centralizes everything into one professional reporting system.
🚀 Key Feature of 3D Printing Manufacturing KPI Dashboard in Power BI
📊 Interactive Summary Dashboard – Monitor all manufacturing KPIs from a centralized visual interface.
🎯 MTD & YTD Performance Monitoring – Analyze short-term and long-term performance instantly.
📈 Actual vs Target Analysis – Automatically compare production outcomes with planned goals.
🟢 Visual KPI Status Indicators – Green and red icons instantly highlight performance conditions.
🔎 Dynamic Slicers & Filters – Analyze data by Month or KPI Group with real-time filtering.
📉 Historical Performance Comparison – Compare Current Year performance with Previous Year results.
📊 Trend Analysis Charts – Visualize KPI behavior using dynamic combo charts.
🔄 Excel-Based Data Integration – Update Excel files and refresh Power BI reports instantly.
📦 What’s Inside the 3D Printing Manufacturing KPI Dashboard in Power BI
This professionally designed Power BI solution includes three analytical pages, each serving a specific purpose:
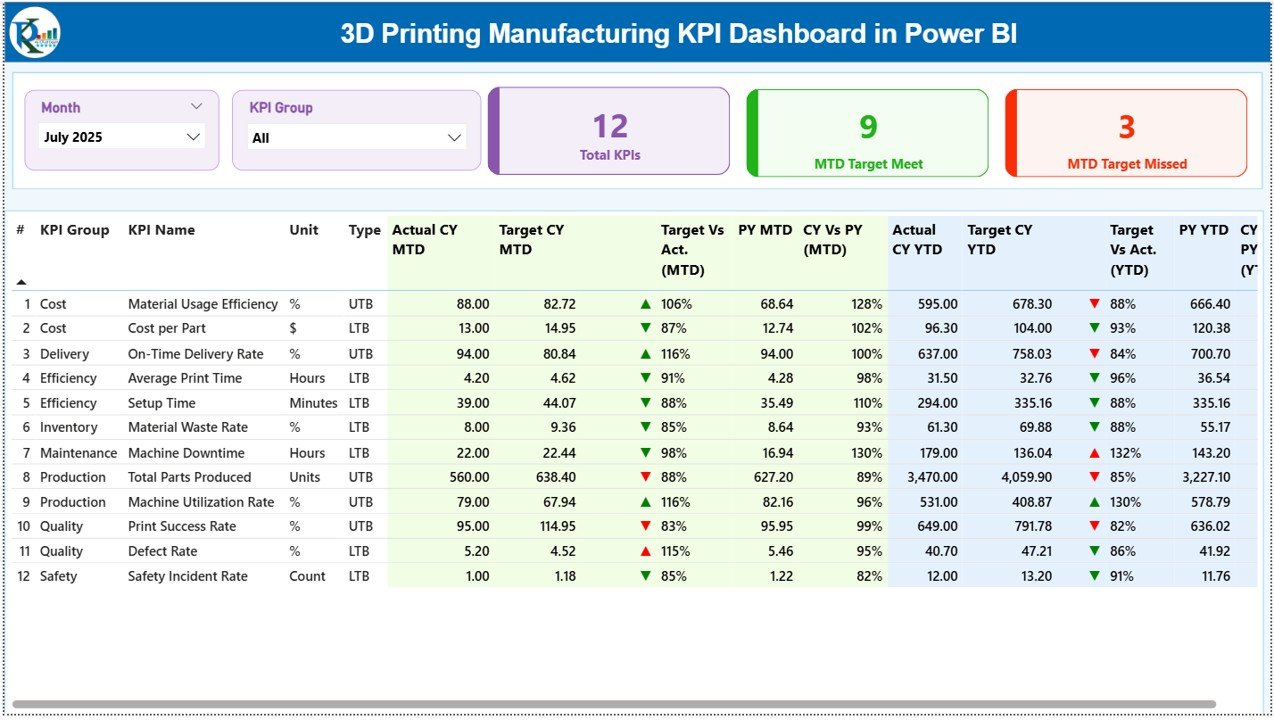
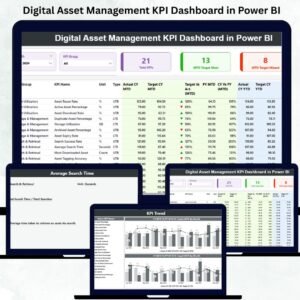
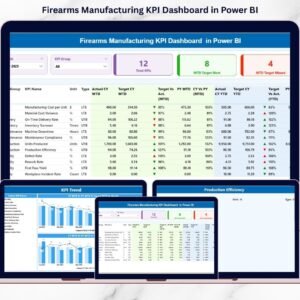
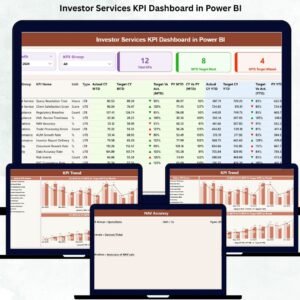
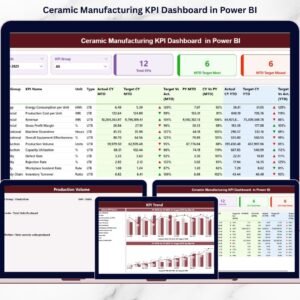
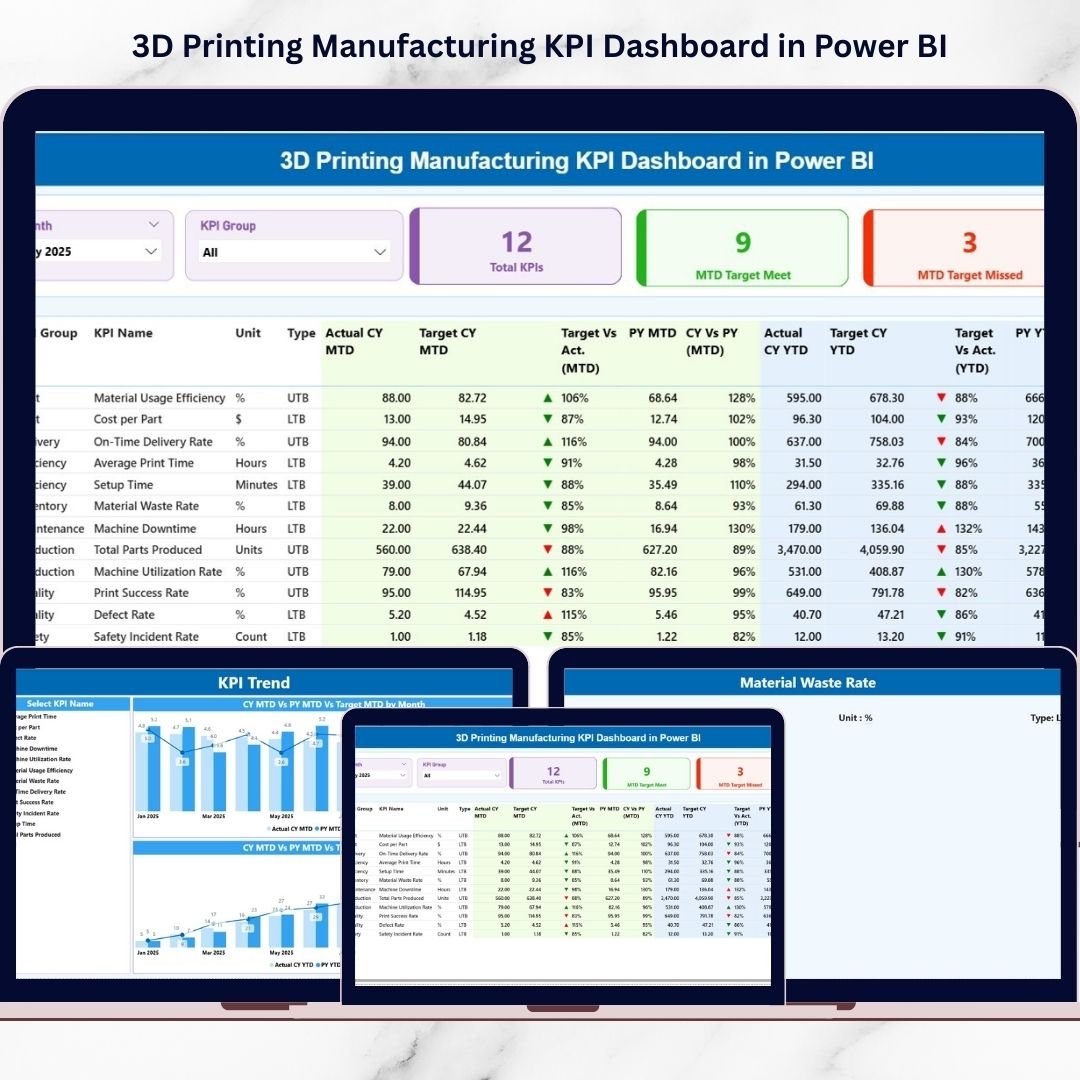
📊 Summary Page – Performance Overview
The main dashboard displaying KPI counts, MTD Target Meet/Missed cards, and a detailed KPI performance table including Actual, Target, and Previous Year comparisons.
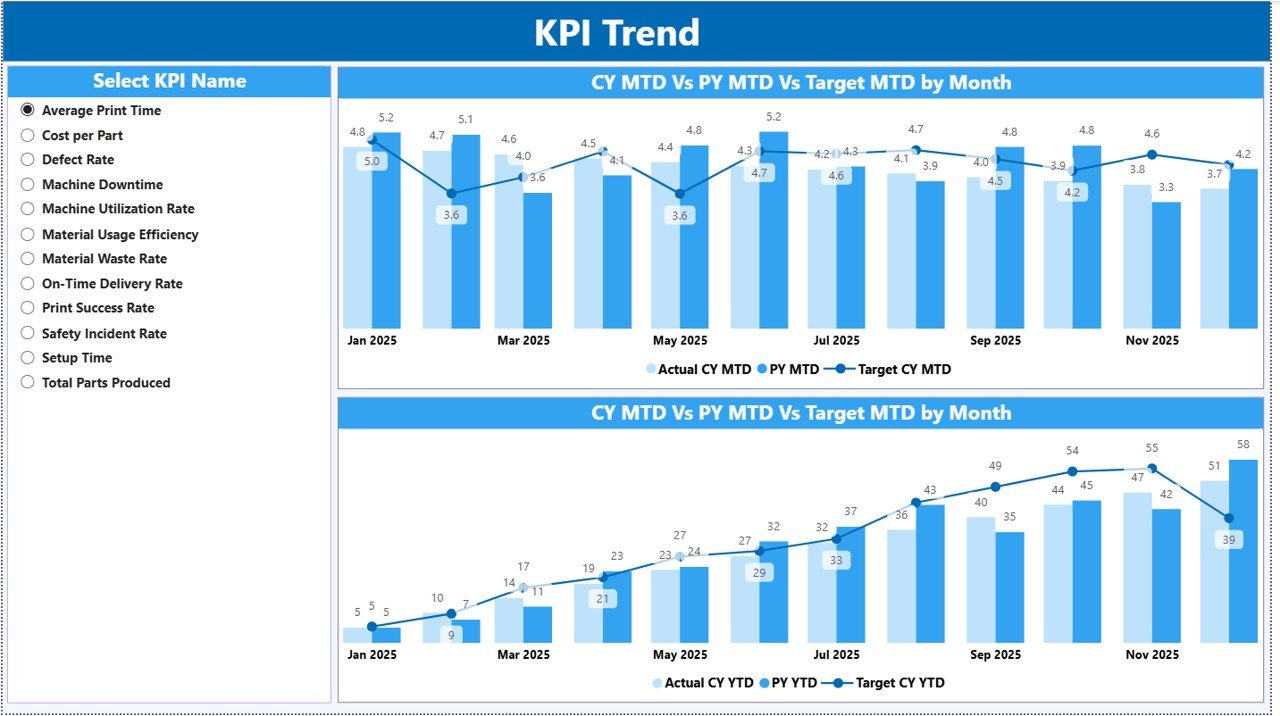
📈 KPI Trend Page – Deep Performance Insights
Dynamic charts visualize MTD and YTD trends comparing Current Year, Target, and Previous Year values to identify performance patterns quickly.
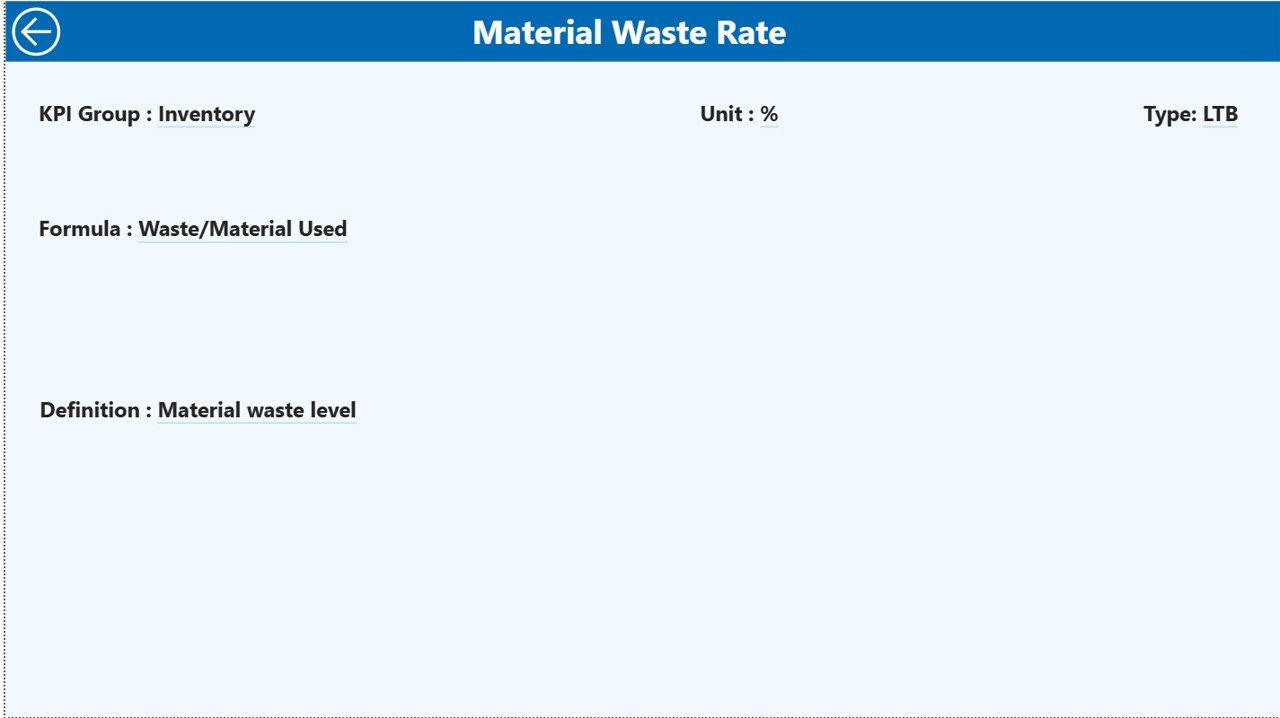
📘 KPI Definition Page – Drill-Through Analytics
A dedicated drill-through page showing KPI formulas, definitions, measurement logic, and KPI types for transparency and clarity.
Additionally, the dashboard connects seamlessly to structured Excel sheets for Actual data, Targets, and KPI Definitions.
⚙️ How to Use the 3D Printing Manufacturing KPI Dashboard in Power BI
The dashboard is designed for simplicity and efficiency:
1️⃣ Define manufacturing KPIs aligned with production goals.
2️⃣ Enter KPI definitions in the Excel definition sheet.
3️⃣ Input Actual and Target values monthly.
4️⃣ Refresh Power BI to update visuals automatically.
5️⃣ Use slicers to analyze performance by period or category.
6️⃣ Review KPI trends and performance indicators.
Within minutes, decision-makers gain a clear understanding of operational performance.
👥 Who Can Benefit from This 3D Printing Manufacturing KPI Dashboard in Power BI
This dashboard is ideal for professionals across manufacturing organizations:
🏭 Manufacturing Managers
⚙️ Production Supervisors
📊 Operations Leaders
✅ Quality Engineers
📈 Data Analysts
💼 Business Owners
🚀 Additive Manufacturing Companies
Both small manufacturers and large enterprises can implement this dashboard to enhance performance monitoring and strategic planning.
By combining Power BI’s advanced visualization with structured KPI tracking, organizations improve visibility, reduce operational risks, and drive continuous improvement initiatives.
Ultimately, the 3D Printing Manufacturing KPI Dashboard in Power BI transforms manufacturing data into actionable intelligence — helping teams optimize production, reduce waste, and achieve sustainable growth.
### Click here to read the Detailed blog post
Visit our YouTube channel to learn step-by-step video tutorials:
👉 https://youtube.com/@PKAnExcelExpert