

In today’s highly competitive manufacturing landscape, heavy vehicle assembly companies must continuously monitor production performance, operational efficiency, quality outcomes, and delivery timelines. Organizations assembling trucks, buses, construction equipment, and industrial vehicles handle complex workflows involving multiple production stages. However, many manufacturers still rely on disconnected spreadsheets and manual reports, making performance tracking slow and inefficient.
The Heavy Vehicle Assembly KPI Dashboard in Power BI is a powerful, ready-to-use business intelligence solution designed to transform assembly data into actionable insights. This interactive dashboard converts raw operational information into dynamic visual analytics, enabling managers to monitor performance instantly and make faster data-driven decisions.
Built using Power BI and connected to an Excel data source, this dashboard provides real-time visibility into key performance indicators (KPIs). Once users update the Excel data file, Power BI automatically refreshes visuals, ensuring leadership teams always work with the latest performance information.
Instead of reviewing multiple production reports separately, users can analyze assembly productivity, target achievement, efficiency trends, and historical performance from one centralized platform. Consequently, organizations reduce reporting effort, improve operational transparency, and enhance manufacturing performance.
The dashboard is structured with dedicated analytical pages that guide users from high-level summaries to detailed KPI insights. Visual indicators, automated calculations, and trend comparisons simplify complex manufacturing data into easy-to-understand visuals suitable for both technical and non-technical users.
Whether managing a large vehicle production plant or overseeing operational performance across assembly units, this dashboard provides a modern analytics framework that supports continuous improvement and operational excellence.
📊 Key Feature of Heavy Vehicle Assembly KPI Dashboard in Power BI
🚛 Centralized KPI Monitoring
Track assembly performance indicators in one interactive dashboard.
📅 Dynamic Month & KPI Filters
Analyze performance instantly using slicers.
📈 MTD & YTD Performance Tracking
Monitor both short-term and long-term operational performance.
🎯 Target vs Actual Analysis
Evaluate KPI achievement automatically with visual indicators.
🔁 Year-over-Year Comparison
Measure improvement using previous-year benchmarking.
📊 Interactive KPI Trend Analysis
Understand productivity patterns using dynamic charts.
🔍 Drill-Through KPI Definitions
View formulas and KPI logic instantly for transparency.
⚡ Automatic Data Refresh
Update Excel data and refresh Power BI visuals instantly.
📦 What’s Inside the Heavy Vehicle Assembly KPI Dashboard in Power BI
This professional dashboard includes three interactive analytical pages designed for complete manufacturing performance analysis.
🔹 Summary Page – Executive Performance Overview
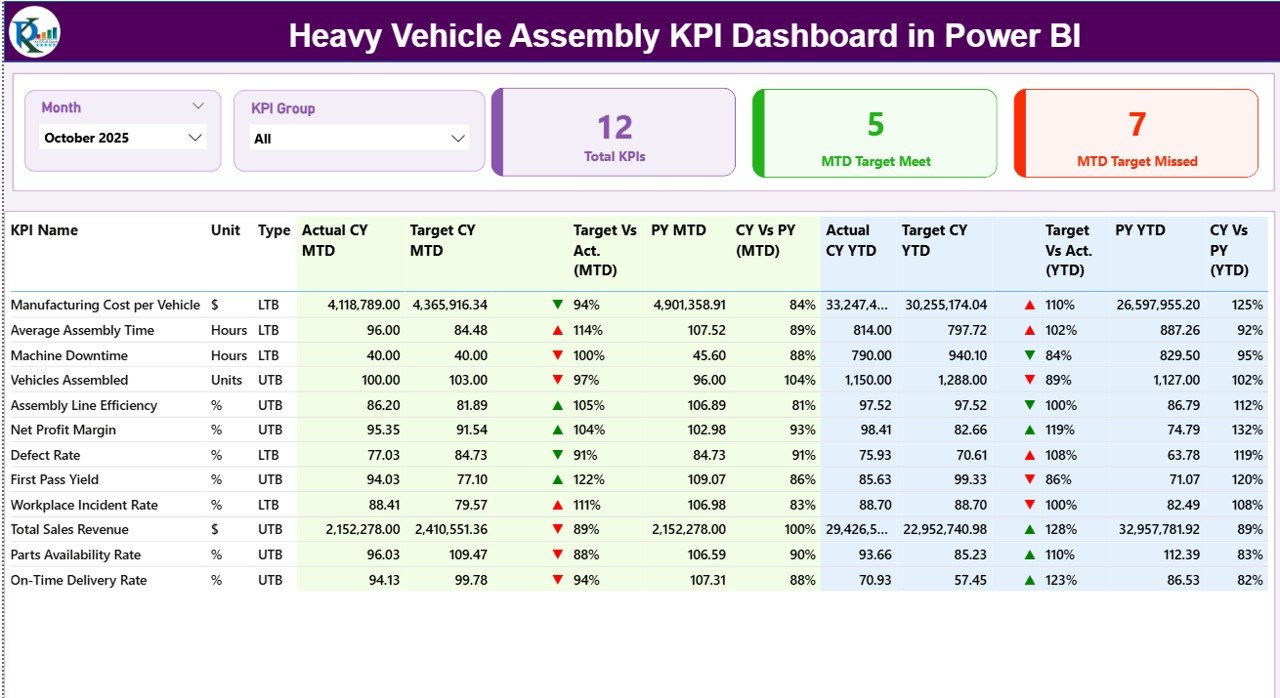
Acts as the main control center of the dashboard.
Key components include:
-
Month slicer
-
KPI Group slicer
-
KPI performance cards:
-
Total KPIs Count
-
MTD Target Meet Count
-
MTD Target Missed Count
-
The detailed KPI table displays:
-
KPI Number & Group
-
KPI Name and Unit
-
KPI Type (LTB / UTB)
-
Actual vs Target comparisons
-
Previous Year comparisons
-
Visual performance indicators (▲ / ▼)
This page enables managers to instantly evaluate operational health.
🔹 KPI Trend Page – Performance Over Time
Provides deeper analytical insights through historical comparisons.
Features include:
-
KPI selection slicer
-
MTD trend chart
-
YTD trend chart
-
Comparison of:
-
Current Year Actual
-
Previous Year Actual
-
Target values
-
Helps users identify productivity trends, seasonal variations, and improvement opportunities.
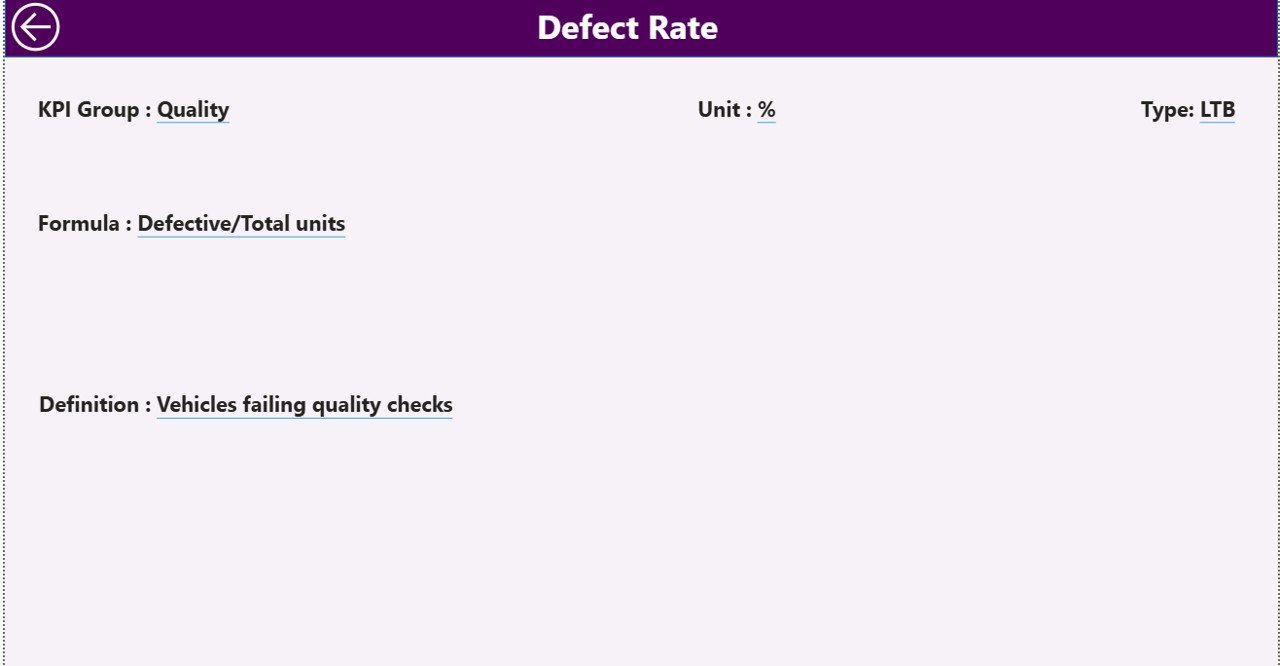
🔹 KPI Definition Page (Drill-Through)
A hidden drill-through page providing KPI transparency.
Users can view:
-
KPI Formula
-
KPI Definition
-
Measurement logic
-
KPI Type classification
A back button ensures smooth navigation.
🔹 Excel Data Source Structure
The dashboard connects to an Excel file containing three sheets:
✅ Input_Actual Sheet – Enter monthly MTD & YTD performance values
✅ Input_Target Sheet – Store KPI targets for comparison
✅ KPI Definition Sheet – Maintain KPI master data
This structure ensures standardized and accurate reporting.
🛠️ How to Use the Heavy Vehicle Assembly KPI Dashboard
1️⃣ Define KPIs in the KPI Definition sheet.
2️⃣ Enter monthly targets in Input_Target.
3️⃣ Update actual performance values.
4️⃣ Refresh Power BI dashboard.
5️⃣ Use slicers to analyze performance.
6️⃣ Review trends and take corrective actions.
No advanced Power BI expertise is required for daily usage.
👥 Who Can Benefit from This Dashboard
This dashboard is ideal for:
✔ Manufacturing Managers
✔ Assembly Plant Supervisors
✔ Operations Heads
✔ Production Analysts
✔ Quality Control Teams
✔ Industrial Engineers
✔ Automotive Manufacturing Companies
🚀 Business Benefits
Organizations implementing this dashboard can:
✅ Improve assembly efficiency
✅ Detect performance gaps early
✅ Monitor production targets effectively
✅ Reduce manual reporting workload
✅ Strengthen operational transparency
✅ Support data-driven manufacturing decisions
Ultimately, the dashboard enables manufacturers to transition from reactive reporting to proactive performance management.
### Click here to read the Detailed blog post
Visit our YouTube channel to learn step-by-step video tutorials
👉 Youtube.com/@PKAnExcelExpert


