In today’s fast-paced manufacturing world, glassware production companies must track performance with precision to stay competitive. Managing production efficiency, minimizing defects, controlling operational costs, and ensuring timely delivery are constant challenges. Without a structured monitoring system, businesses often rely on scattered spreadsheets and delayed reports, leading to slow decision-making and reduced productivity.
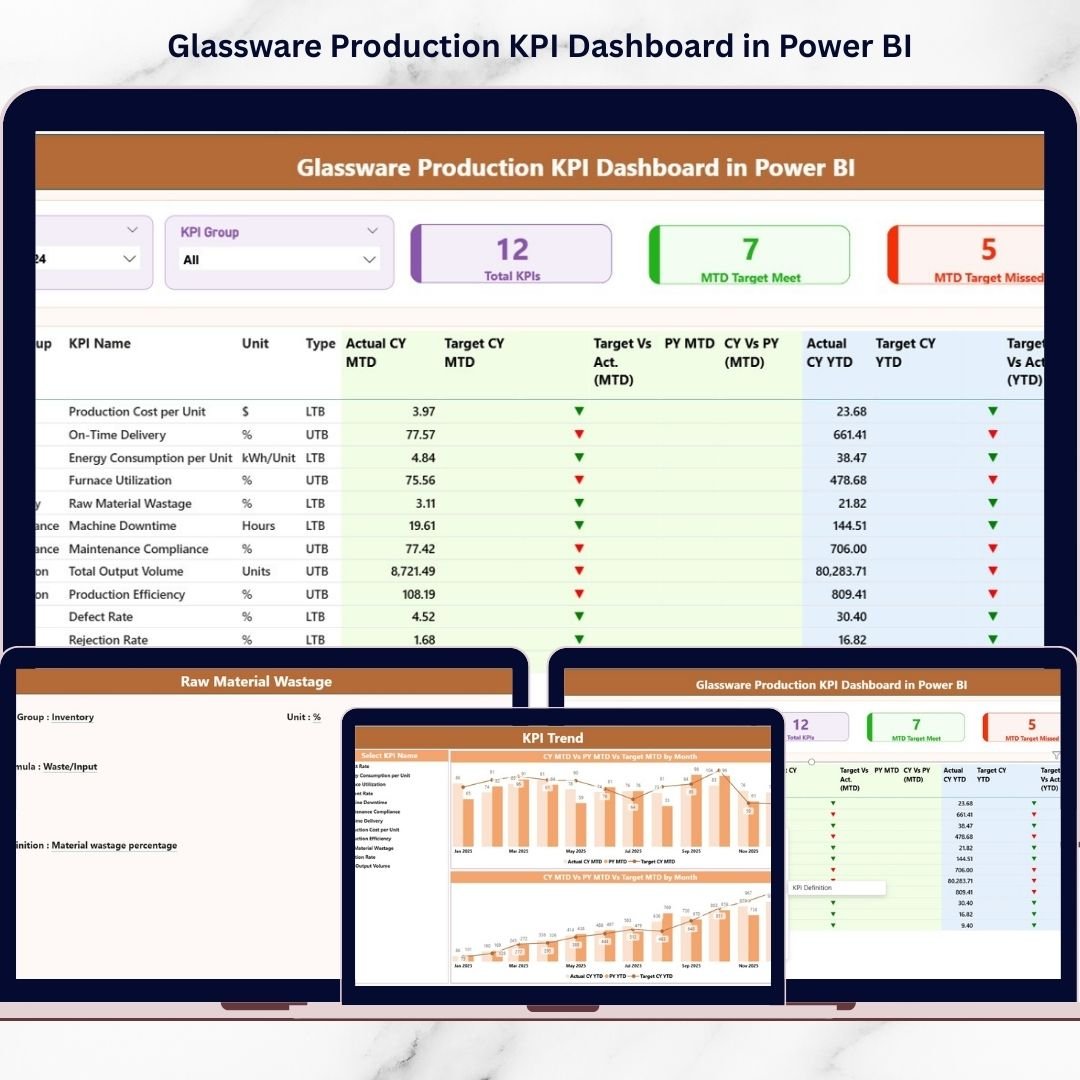
The Glassware Production KPI Dashboard in Power BI is designed to solve these challenges by transforming complex production data into clear, interactive, and actionable insights. This ready-to-use dashboard provides a centralized platform where manufacturers can monitor operational performance using powerful visual analytics.
Instead of manually analyzing reports, production managers can instantly evaluate KPIs through automated visuals, comparison charts, and dynamic filters. As a result, organizations gain better visibility, faster insights, and stronger operational control.
Built using Microsoft Power BI and supported by an Excel data source, this dashboard combines flexibility with advanced analytics. Whether you want to track monthly performance or analyze long-term production trends, this solution simplifies performance management while improving decision accuracy.
⭐ Key Features of Glassware Production KPI Dashboard in Power BI
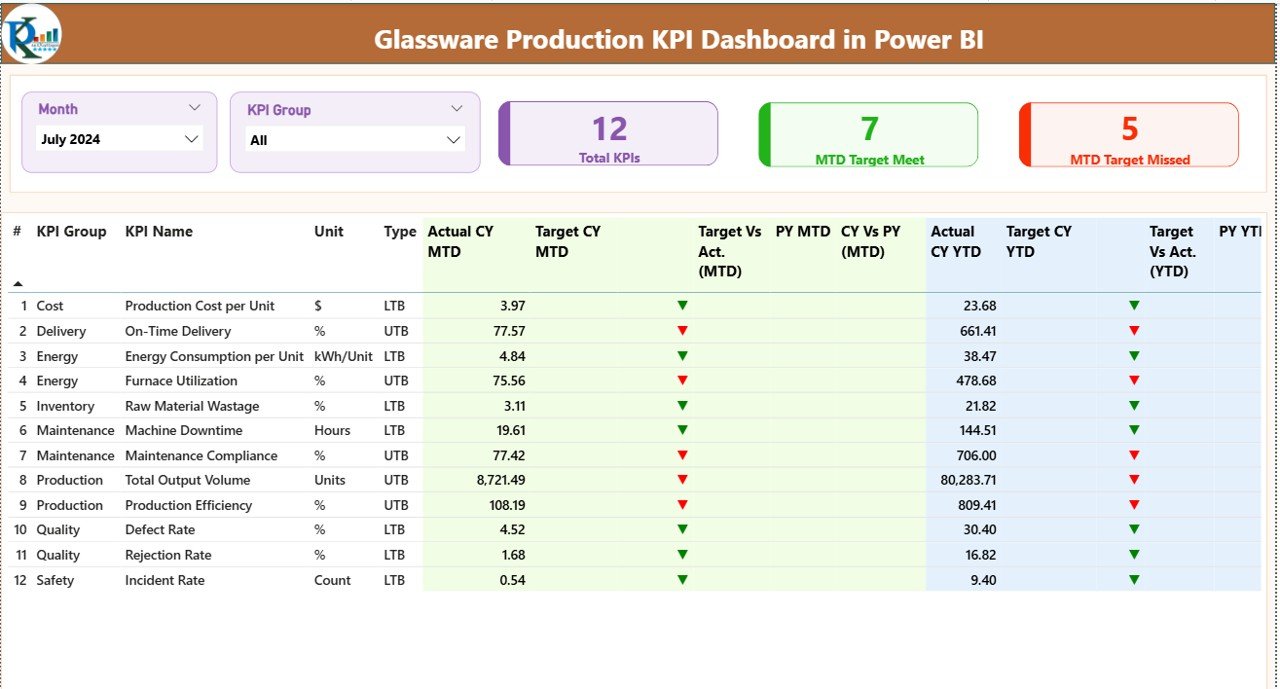
✅ Interactive Summary Page providing a complete performance overview
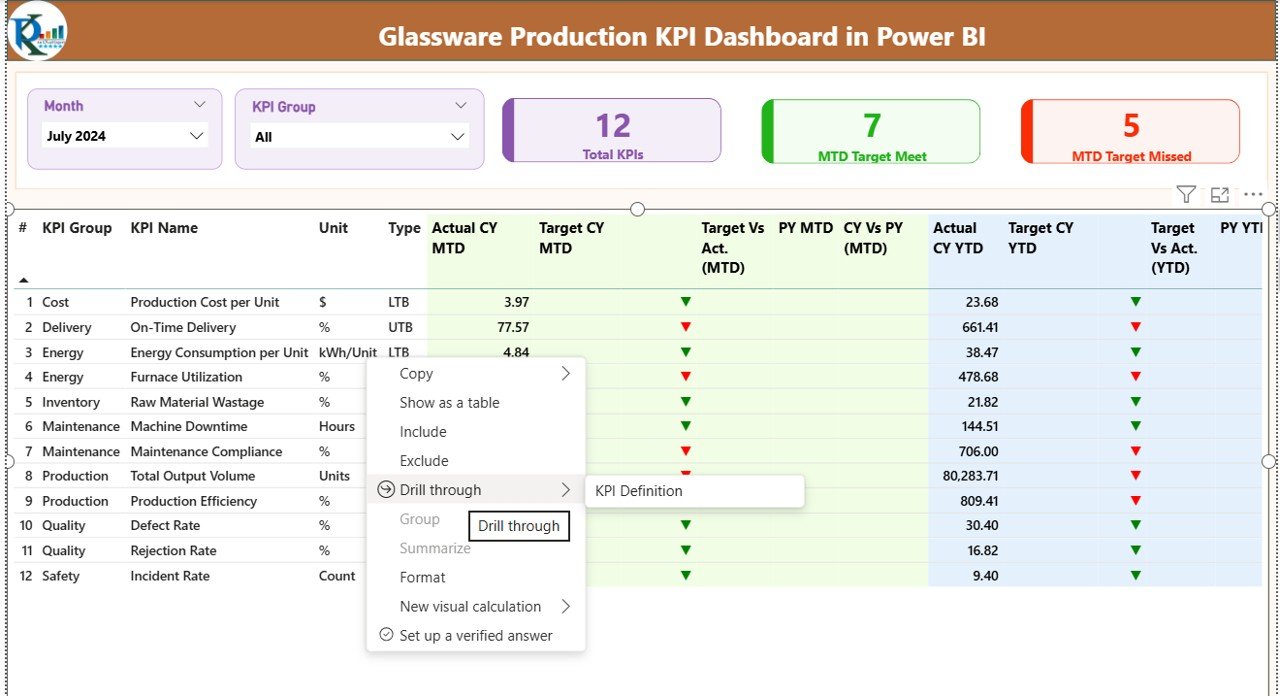
✅ Dynamic slicers for Month and KPI Group filtering
✅ KPI cards showing Total KPIs, Target Met, and Target Missed counts
✅ MTD and YTD performance comparison with automated calculations
✅ Current Year vs Previous Year analysis visuals
✅ Green and Red performance indicators for instant understanding
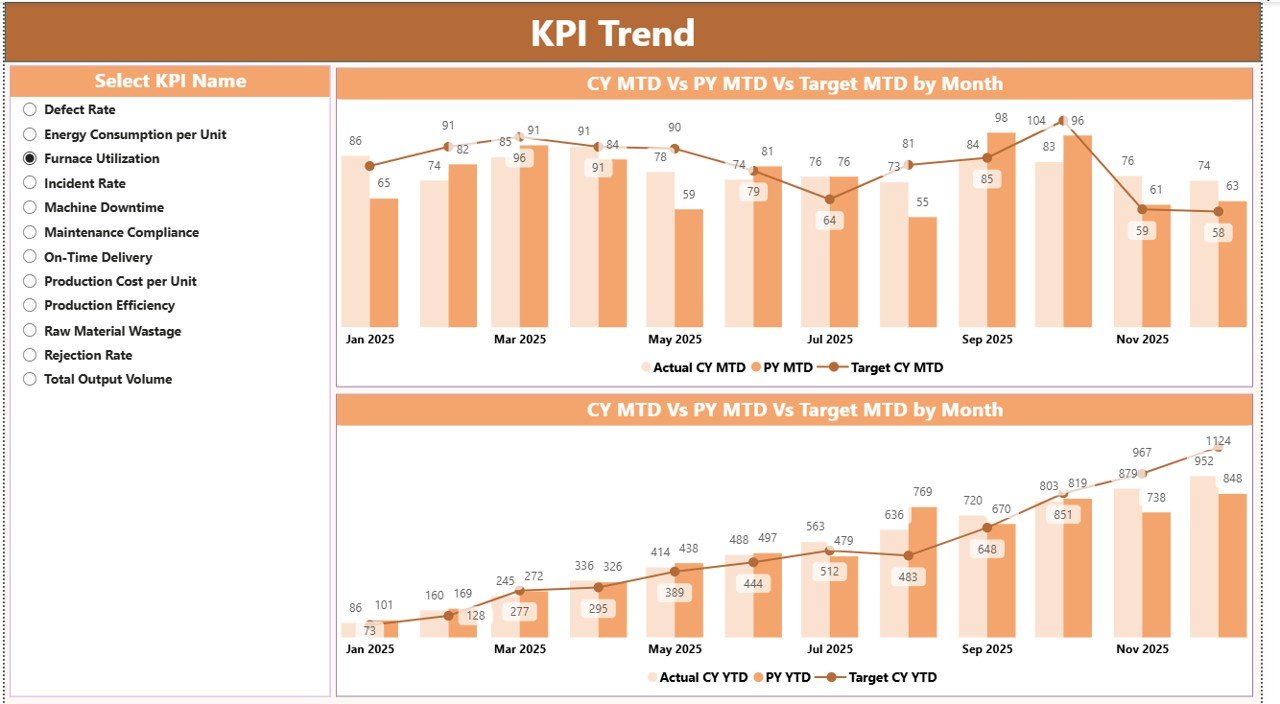
✅ KPI Trend Page with combo charts for historical analysis
✅ Drill-through KPI Definition page for detailed KPI logic
✅ Automated refresh using Excel data inputs
✅ User-friendly interface suitable for non-technical users
📦 What’s Inside the Glassware Production KPI Dashboard in Power BI
This digital product includes a professionally designed Power BI dashboard structured into three analytical pages:
1️⃣ Summary Page
Acts as the central control panel displaying KPI performance, comparisons, and status indicators in one view.
2️⃣ KPI Trend Page
Provides time-based performance analysis using MTD and YTD comparison charts to identify trends and improvement opportunities.
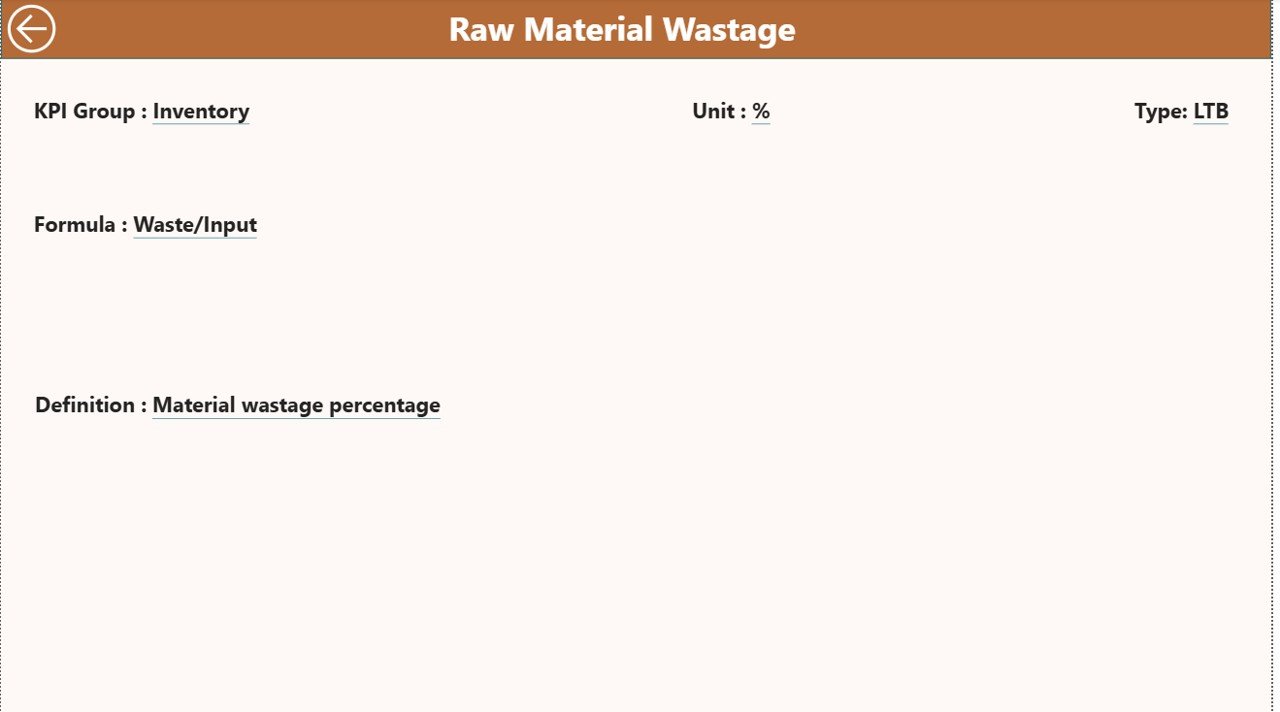
3️⃣ KPI Definition Page
A drill-through section explaining KPI formulas, definitions, and measurement logic for transparency.
Additionally, the dashboard connects to a structured Excel data file containing:
-
Input_Actual Sheet for performance values
-
Input_Target Sheet for KPI targets
-
KPI Definition Sheet for KPI setup and logic
This design ensures easy updates without modifying Power BI visuals.
🛠️ How to Use the Glassware Production KPI Dashboard in Power BI
Using this dashboard is simple and requires minimal technical knowledge:
1️⃣ Enter KPI actual values in the Excel Input_Actual sheet
2️⃣ Update monthly targets in the Input_Target sheet
3️⃣ Define or edit KPIs in the KPI Definition sheet
4️⃣ Refresh Power BI to update visuals automatically
5️⃣ Use slicers to filter Month or KPI Group
6️⃣ Analyze KPI performance instantly through visuals
With this streamlined workflow, teams spend less time preparing reports and more time improving operations.
🎯 Who Can Benefit from This Glassware Production KPI Dashboard in Power BI
This dashboard is ideal for:
✔ Glassware manufacturing companies
✔ Production Managers & Plant Supervisors
✔ Operations and Quality Teams
✔ Manufacturing Analysts
✔ Business Owners and Decision Makers
✔ Continuous Improvement Teams
✔ Industrial Engineers and Performance Analysts
Any organization seeking structured KPI monitoring and data-driven decision-making can benefit from this solution.
By implementing this dashboard, companies achieve real-time visibility into production performance, reduce manual reporting workload, and improve accountability across departments. Managers can quickly identify performance gaps, monitor efficiency trends, and take corrective action before problems escalate.
Because the dashboard integrates Excel simplicity with Power BI intelligence, businesses gain a scalable analytics solution without complex system implementation.
Ultimately, the Glassware Production KPI Dashboard in Power BI empowers manufacturers to move from reactive reporting to proactive performance management — helping organizations improve productivity, enhance quality control, and drive operational excellence.
Click here to read the Detailed blog post
Watch the step-by-step video tutorial:


