Nanotechnology organizations operate in a highly data-driven world where performance monitoring is not optional—it’s essential. Whether you work in nanomaterials research, manufacturing, or commercialization, you must track production efficiency, material quality, research output, operational targets, and innovation metrics consistently. However, when data sits in disconnected spreadsheets and manual reports, teams waste time compiling information instead of improving performance.
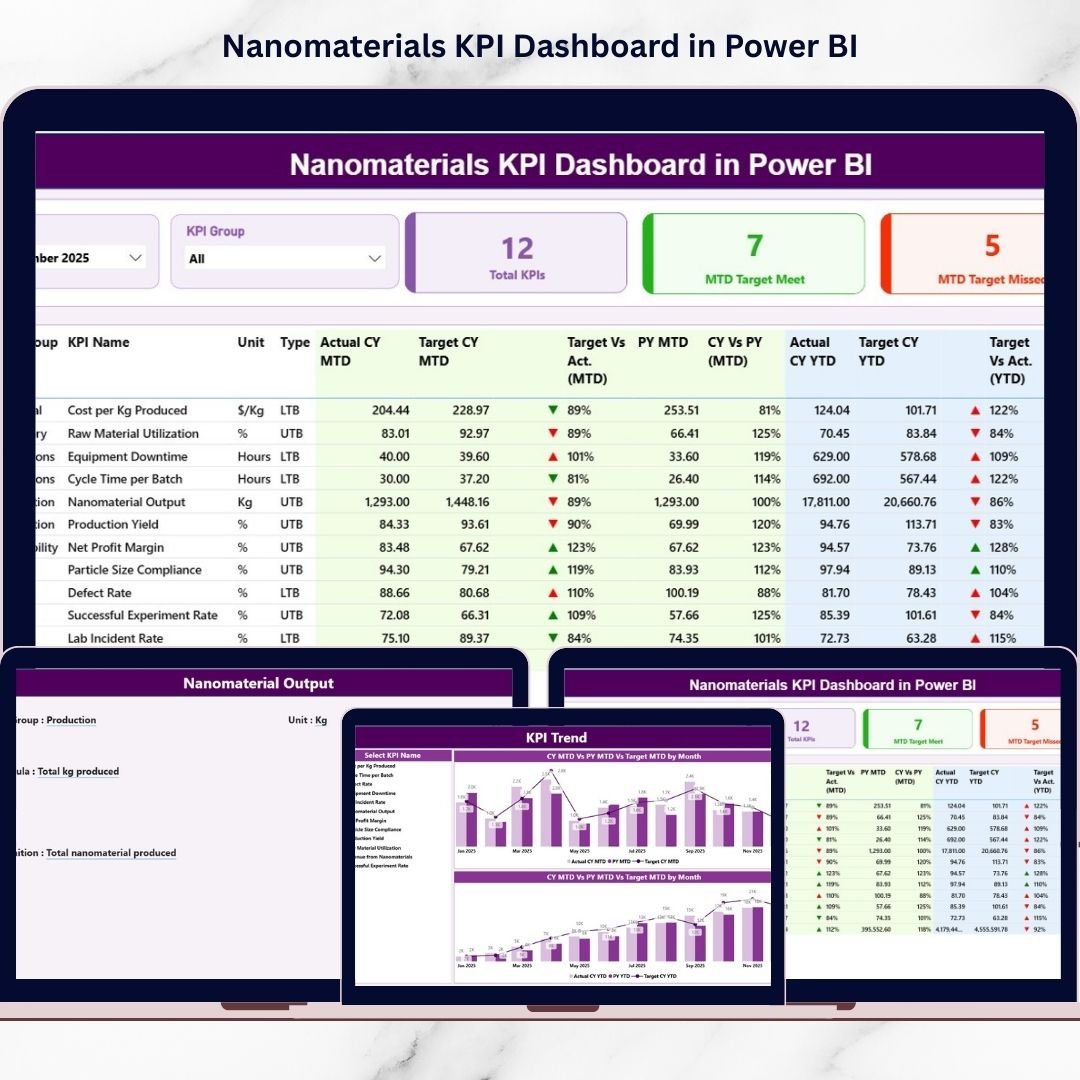
The Nanomaterials KPI Dashboard in Power BI is a ready-to-use, interactive analytics solution built to solve this exact challenge. It transforms raw nanomaterials data into powerful visual insights so decision-makers can evaluate performance instantly, identify gaps early, and take corrective action faster. Instead of opening multiple files and building reports from scratch, you get a centralized dashboard that delivers clear KPI status, target tracking, and trend analysis in seconds.
This dashboard uses an Excel data source (for simple data entry) and Power BI visuals (for advanced analytics). As a result, you get the best of both worlds: familiar Excel updates + professional Power BI reporting. It’s ideal for organizations that want enterprise-level KPI monitoring without expensive, complex systems.
🚀 Key Feature of Nanomaterials KPI Dashboard in Power BI
📅 Month & KPI Group Slicers
Filter performance instantly by month and KPI category without editing any data manually.
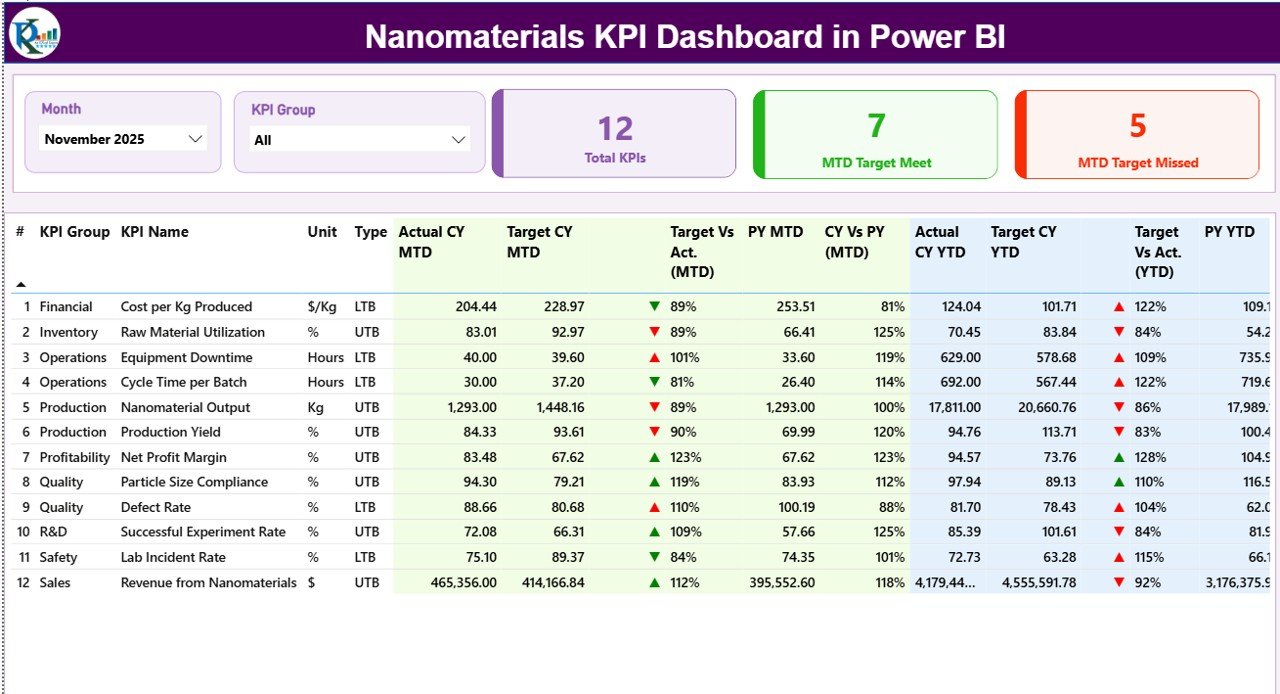
📊 Smart KPI Cards (Instant Status View)
See total KPIs, MTD target met count, and MTD target missed count at a glance.
✅ Detailed KPI Performance Table
Track KPI Number, Group, Name, Unit, Type (LTB/UTB), and complete MTD/YTD comparisons in one view.
🎯 Target vs Actual Tracking (MTD & YTD)
Automatically calculate and display achievement % so teams instantly spot deviations.
🔁 Previous Year Benchmarking (MTD & YTD)
Compare current performance vs last year to measure improvement and growth.
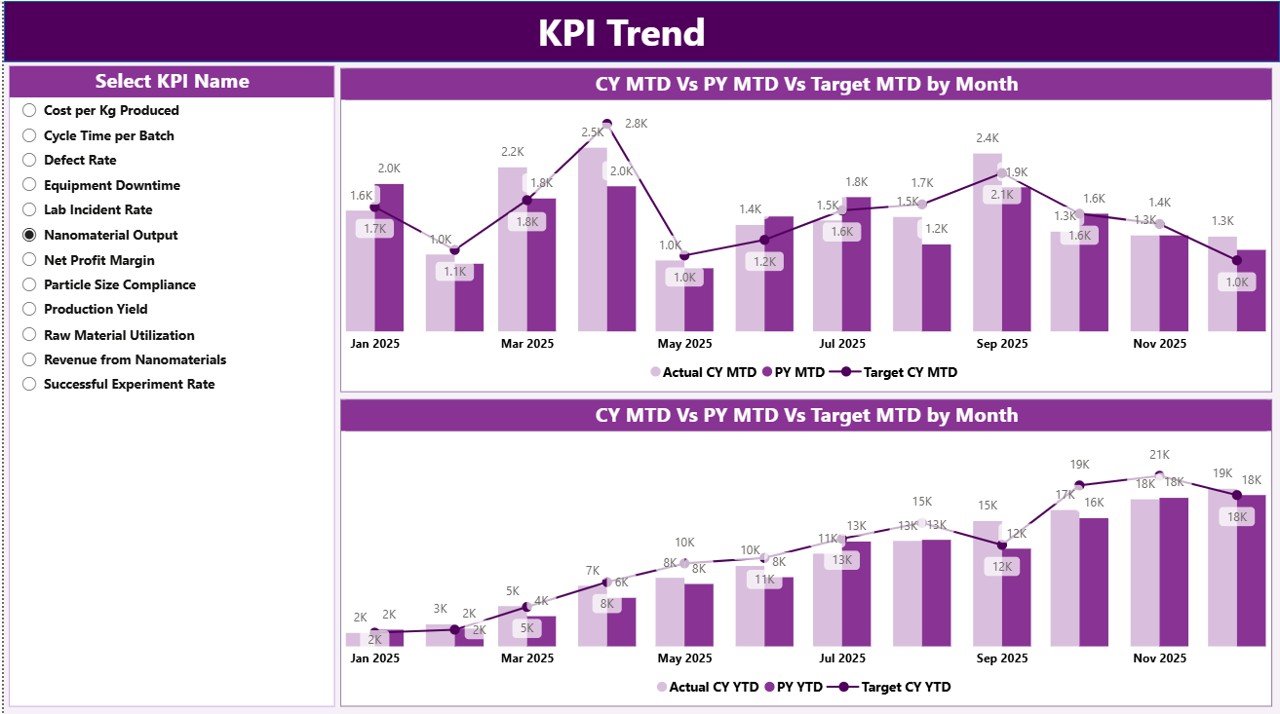
📈 KPI Trend Page with Combo Charts
Analyze performance patterns with Current Year vs Target vs Previous Year trends (MTD + YTD).
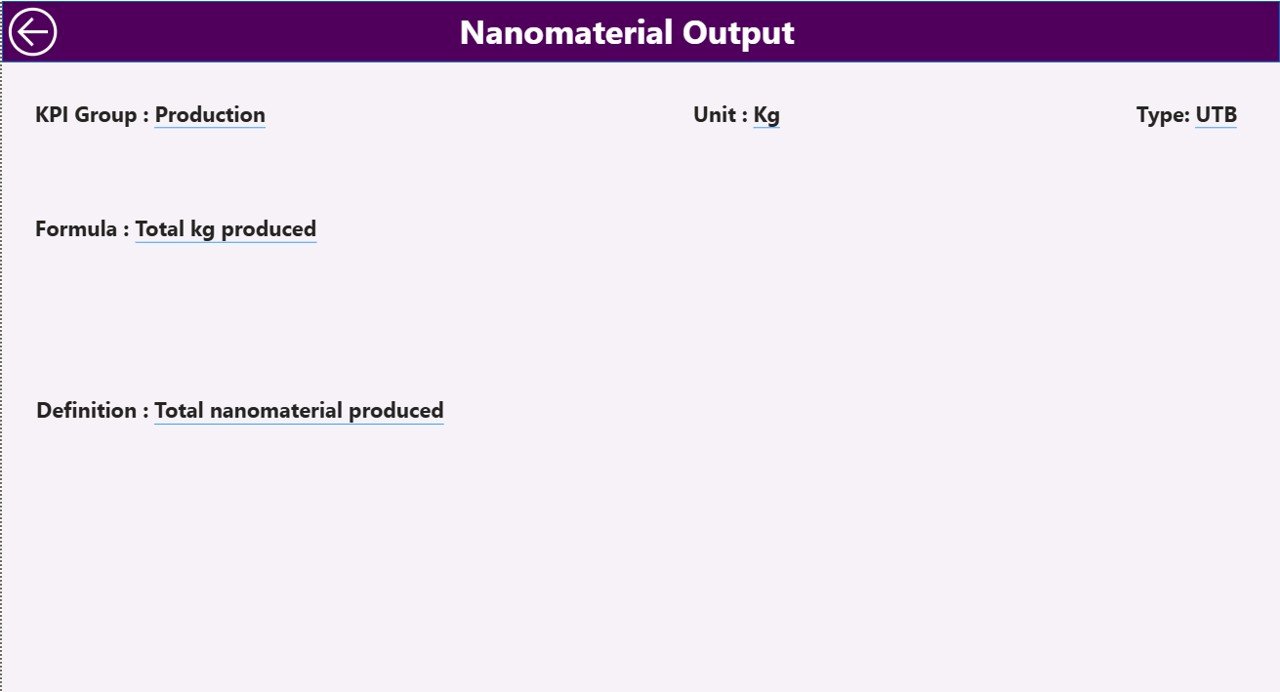
📘 KPI Definition Drill-Through Page
View KPI formula, definition, logic, group, and type for complete clarity and transparency.
⚡ Excel-Based Data Updates
Update Excel sheets and refresh Power BI—visuals update automatically.
📦 What’s Inside the Nanomaterials KPI Dashboard in Power BI
This dashboard is designed as a complete KPI monitoring system, including:
✅ Power BI Report with 3 Pages
-
Summary Page (main KPI overview + performance table)
-
KPI Trend Page (MTD/YTD trend combo charts)
-
KPI Definition Page (drill-through KPI documentation)
✅ Excel Data Source with 3 Sheets
-
Input_Actual (MTD/YTD actual data)
-
Input_Target (MTD/YTD target values)
-
KPI Definition (KPI metadata + formula + definition + LTB/UTB)
✅ Prebuilt Calculations & Visual Indicators
✅ Professional Layout for Nanotech KPI Reporting
🛠️ How to Use the Nanomaterials KPI Dashboard in Power BI
1️⃣ Update monthly KPI performance in Input_Actual (Excel).
2️⃣ Enter targets in Input_Target (Excel).
3️⃣ Maintain KPI details in KPI Definition (Excel).
4️⃣ Open the Power BI file and click Refresh.
5️⃣ Use slicers to filter by month or KPI group.
6️⃣ Review KPI cards, detailed table, trends, and drill-through definitions.
It’s simple, fast, and built for non-technical users too.
👥 Who Can Benefit from This Nanomaterials KPI Dashboard in Power BI
🔬 Nanotechnology Research Labs
🏭 Nanomaterials Manufacturing Companies
✅ Quality Assurance & Testing Teams
📊 Data Analysts & Reporting Teams
⚙ Operations & Production Managers
🚀 Innovation & R&D Departments
👨💼 Strategic Planning & Leadership Teams
If you need faster KPI insights and better operational control—this dashboard is made for you.
### Click here to read the Detailed blog post
Visit our YouTube channel to learn step-by-step video tutorials:
👉 https://youtube.com/@PKAnExcelExpert


