
The petrochemical industry operates in one of the most complex and performance-driven environments where operational efficiency, safety compliance, maintenance reliability, and financial performance must be monitored continuously. However, many organizations still depend on scattered spreadsheets and manual reporting processes. As a result, decision-makers struggle to identify performance gaps quickly and take timely action.
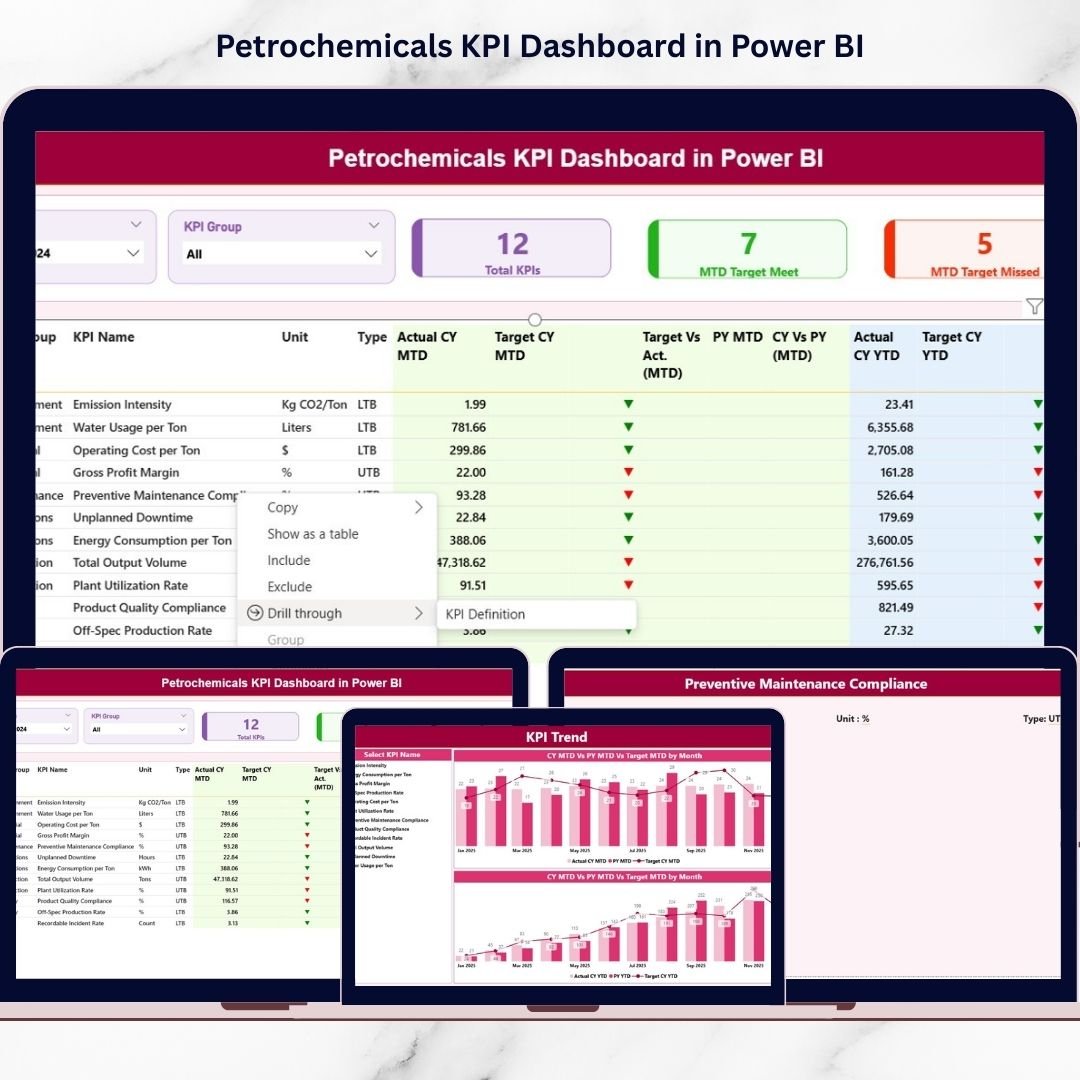
To solve this challenge, we have developed the Petrochemicals KPI Dashboard in Power BI — a professionally designed, ready-to-use analytics solution that transforms raw operational data into powerful business insights.
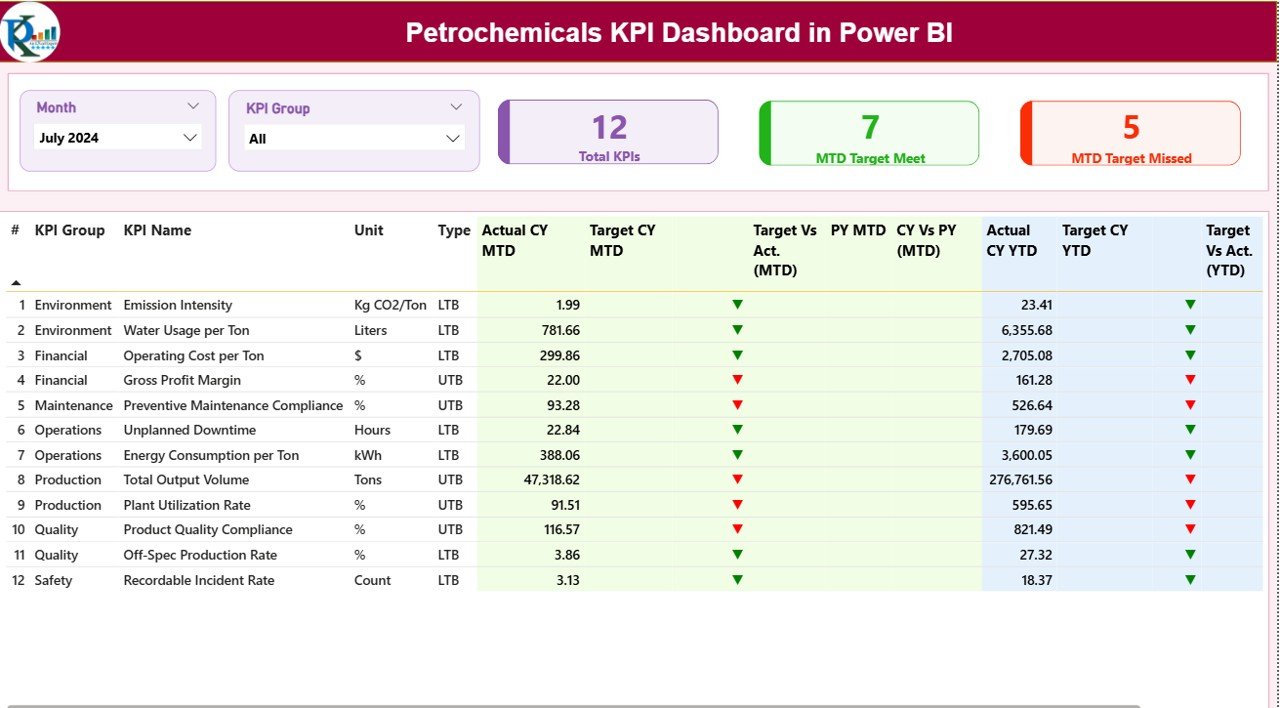
This dashboard combines structured Excel data with interactive Power BI visualizations, enabling organizations to monitor KPIs, compare performance trends, and make faster data-driven decisions without complex setup or technical expertise.
Whether you want to track production efficiency, safety metrics, maintenance performance, or financial indicators, this dashboard provides a centralized performance monitoring system designed specifically for petrochemical operations.
🚀 Key Feature of Petrochemicals KPI Dashboard in Power BI
✅ Interactive KPI Monitoring – Track operational, safety, maintenance, and financial KPIs in one centralized dashboard.
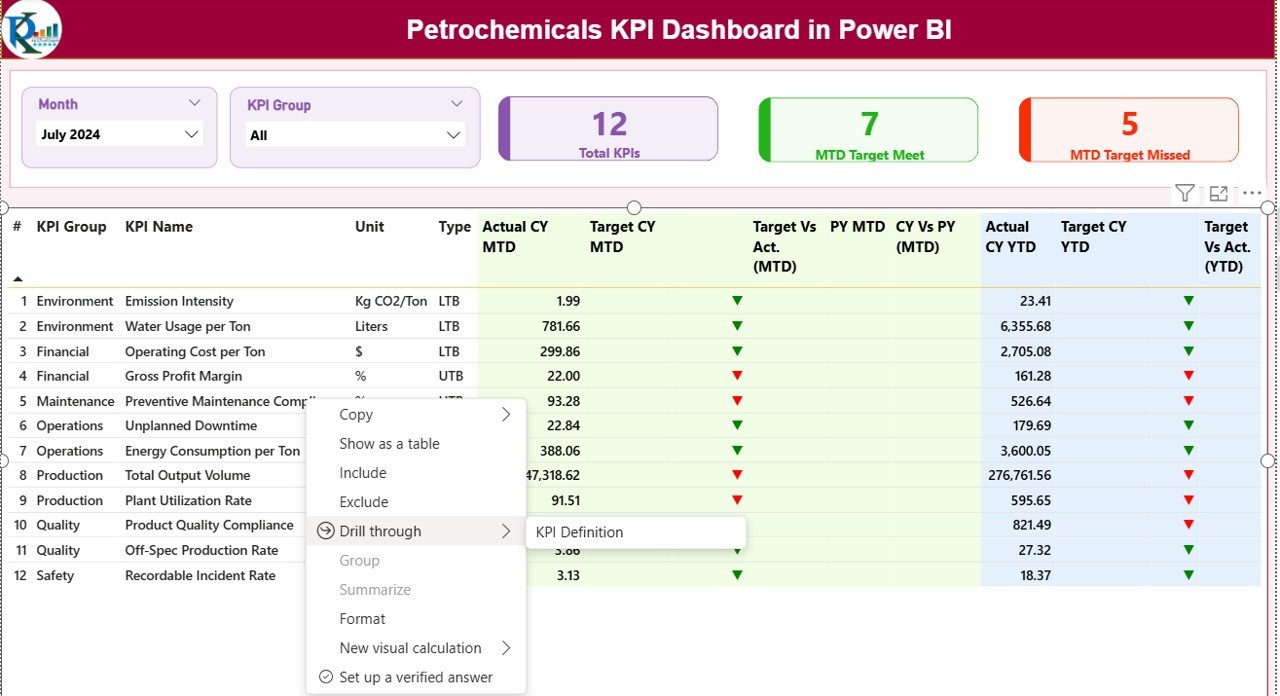
✅ Dynamic Slicers – Instantly filter data using Month and KPI Group slicers for flexible analysis.
✅ MTD & YTD Performance Tracking – Monitor both short-term and long-term performance simultaneously.
✅ Target vs Actual Comparison – Quickly evaluate whether performance goals are achieved.
✅ Previous Year Comparison – Analyze year-over-year improvement using automated calculations.
✅ Visual Performance Indicators – Green and red icons instantly highlight KPI success or risk areas.
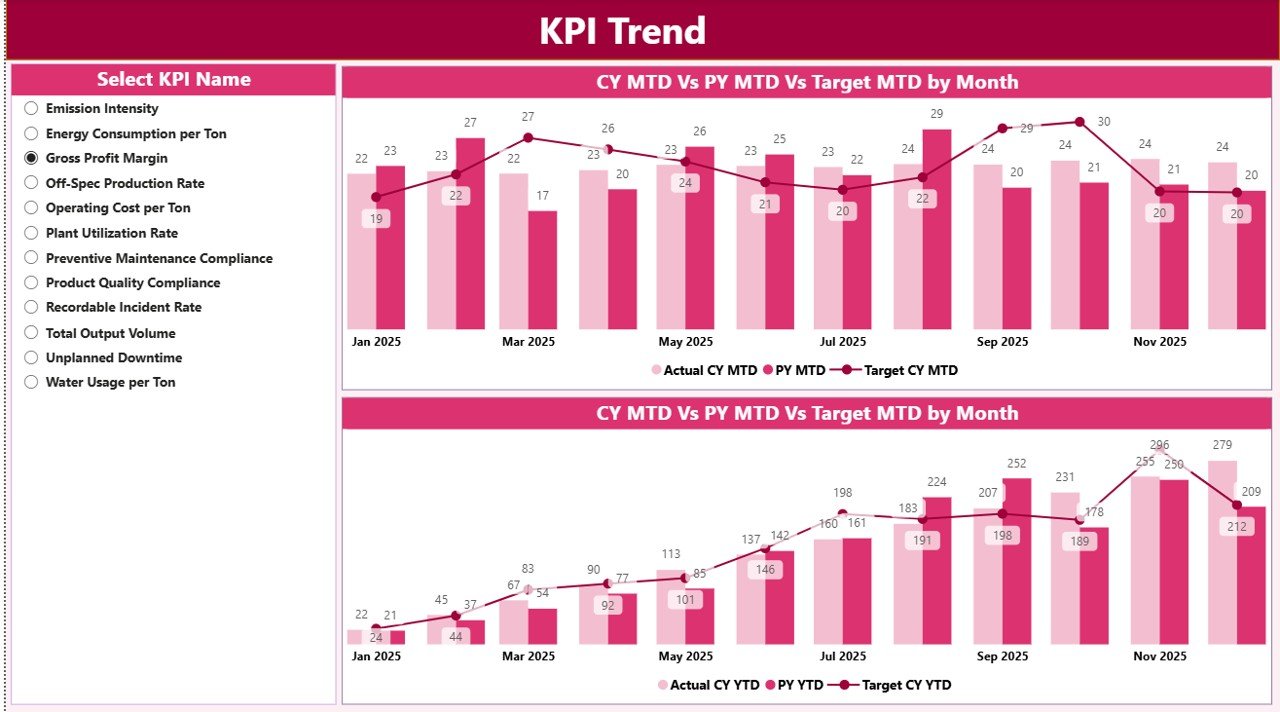
✅ Trend Analysis Charts – Identify performance patterns and operational trends using combo charts.
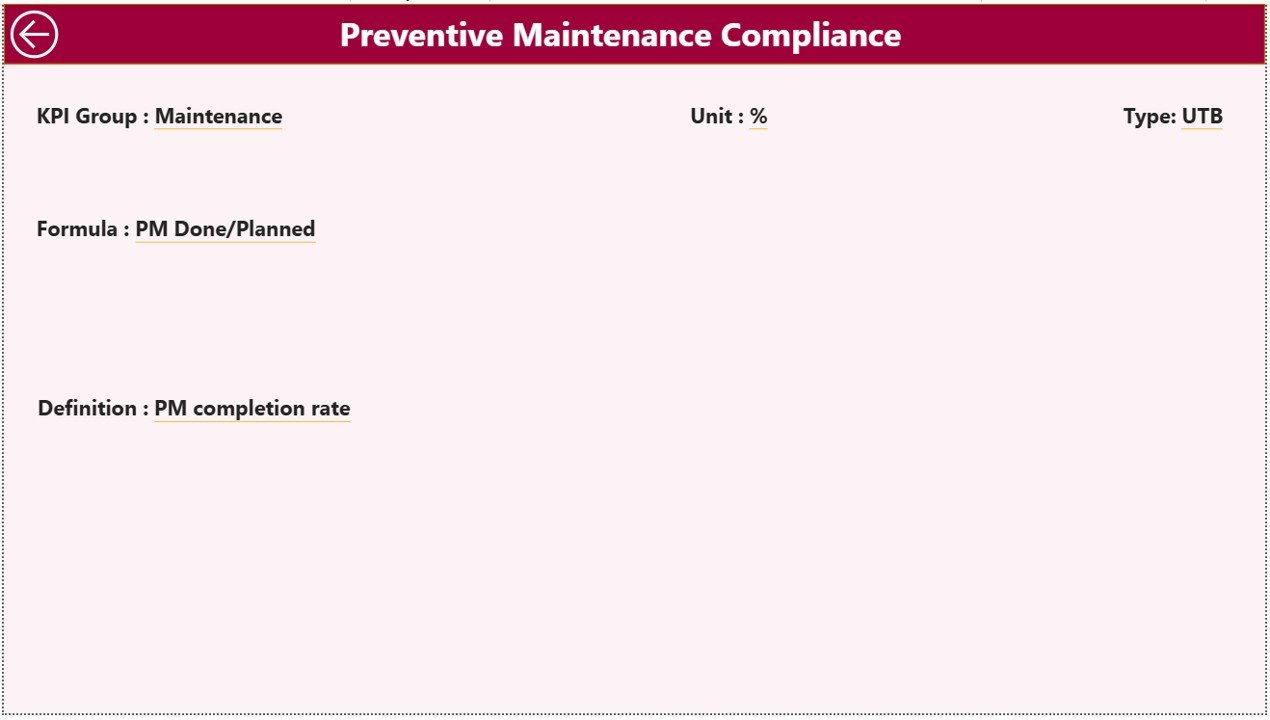
✅ Drill-Through KPI Definitions – View KPI formulas and logic without cluttering the main dashboard.
✅ Excel Integrated Data Source – Easy data entry with powerful Power BI analytics.
📊 What’s Inside the Petrochemicals KPI Dashboard in Power BI
This ready-to-use solution includes professionally structured Power BI pages:
📌 Summary Page
A centralized performance overview displaying KPI cards, performance tables, and status indicators for quick decision-making.
📌 KPI Trend Page
Interactive charts showing MTD and YTD performance trends, allowing managers to detect improvement or decline early.
📌 KPI Definition Page
A drill-through analytical page containing KPI formulas, definitions, and measurement logic for complete transparency.
📌 Excel Data Source File
Structured sheets for Actual data, Target data, and KPI Definitions to ensure easy maintenance and updates.
⚙️ How to Use the Petrochemicals KPI Dashboard in Power BI
Using this dashboard is simple and beginner-friendly:
1️⃣ Enter KPI Actual values in the Excel input sheet.
2️⃣ Update monthly Target data.
3️⃣ Maintain KPI definitions in the master sheet.
4️⃣ Connect or refresh Power BI Desktop.
5️⃣ Instantly analyze updated performance visuals.
Because the system separates data entry and visualization, even non-technical users can manage updates easily.
👥 Who Can Benefit from This Petrochemicals KPI Dashboard in Power BI
This dashboard is ideal for:
🏭 Petrochemical Plant Managers
📈 Operations & Production Teams
🛠 Maintenance Departments
🦺 Safety & Compliance Managers
💼 Business Analysts & Executives
📊 Performance Management Teams
Organizations aiming to improve operational visibility, reduce reporting effort, and strengthen decision-making will gain immediate value from this solution.
By implementing this dashboard, companies move from reactive reporting to proactive performance management. Teams spend less time preparing reports and more time improving results.
Click hare to read the Detailed blog post
Watch the step-by-step video tutorial:
Visit our YouTube channel to learn step-by-step video tutorials:
YouTube.com/@PKAnExcelExpert


