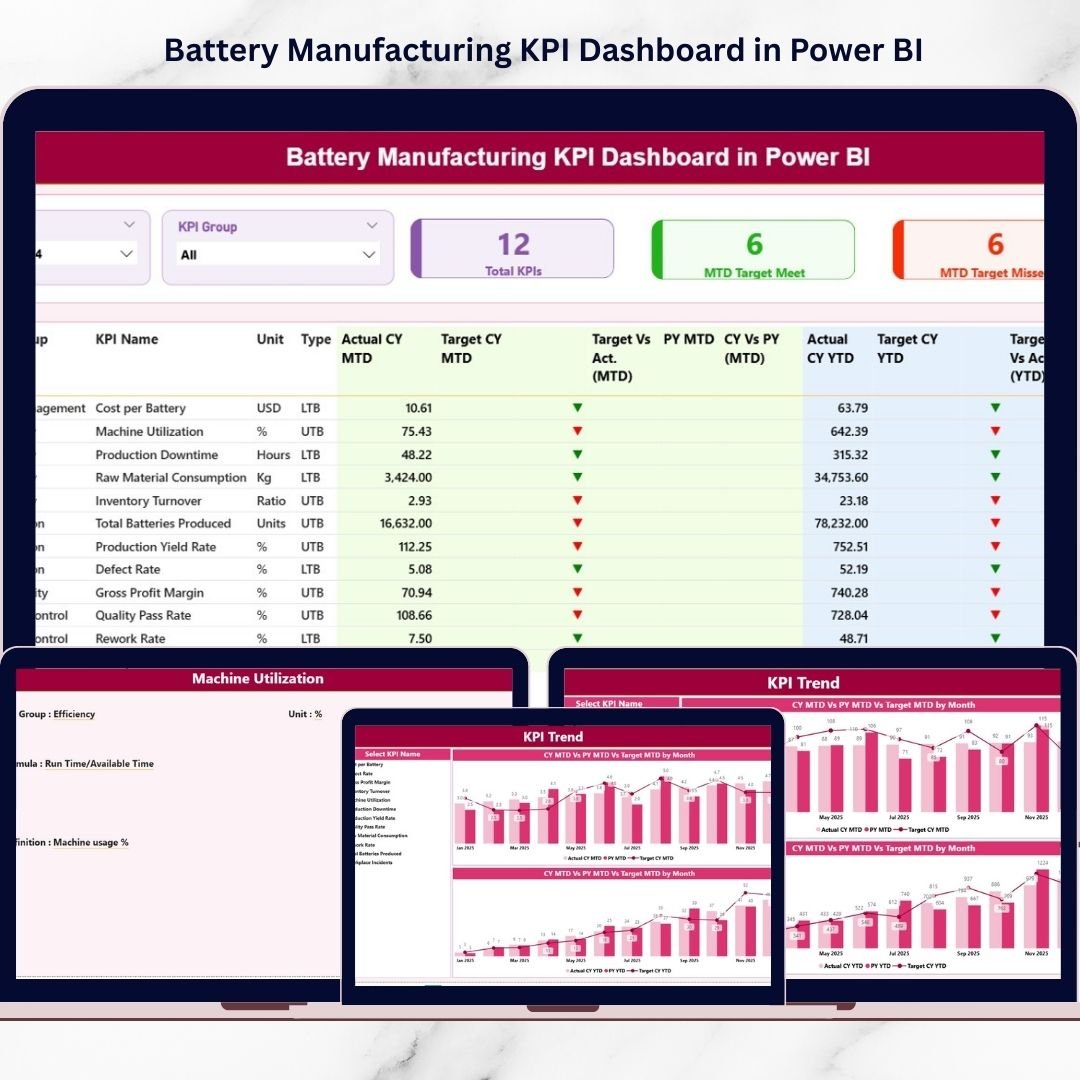
The battery manufacturing industry is growing faster than ever. With the rise of electric vehicles, renewable energy storage, and portable electronics, manufacturers must continuously monitor production efficiency, maintain strict quality standards, and control operational costs. However, many organizations still depend on scattered spreadsheets and manual reporting systems, making it difficult to track performance in real time.What if you could monitor your entire manufacturing performance from one powerful dashboard?The Battery Manufacturing KPI Dashboard in Power BI is a ready-to-use analytics solution designed to transform complex manufacturing data into clear, interactive insights. Instead of spending hours preparing reports, managers can instantly analyze KPIs, compare targets with actual performance, and identify operational gaps using dynamic Power BI visuals.
This dashboard helps manufacturing teams improve decision-making, increase transparency, and achieve operational excellence through structured KPI monitoring.Battery Manufacturing KPI Dashboard in Power BI
⭐ Key Features of Battery Manufacturing KPI Dashboard in Power BI
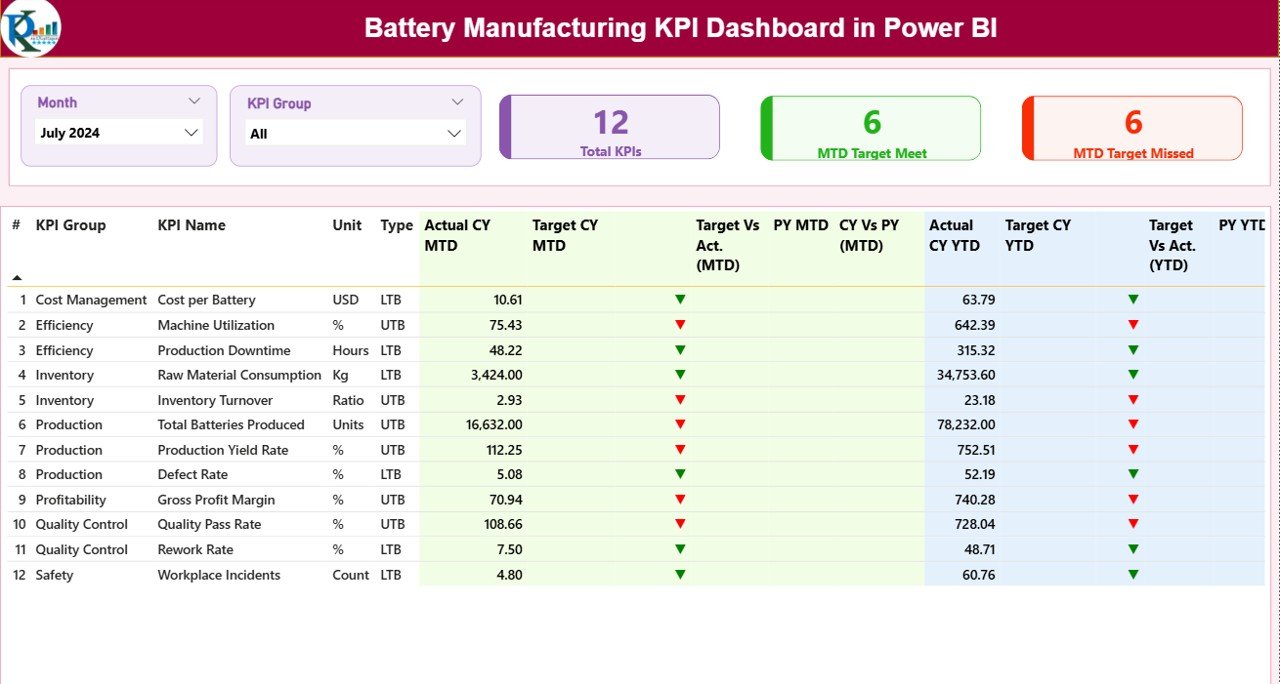
✅ Interactive Summary Dashboard with KPI performance overview
✅ Smart slicers to filter data by Month and KPI Group instantly
✅ KPI performance cards showing Total KPIs, Target Met, and Target Missed
✅ Automated comparison of Actual vs Target values
✅ Year-over-Year performance tracking for strategic analysis
✅ Visual status indicators (▲ ▼) for quick performance evaluation
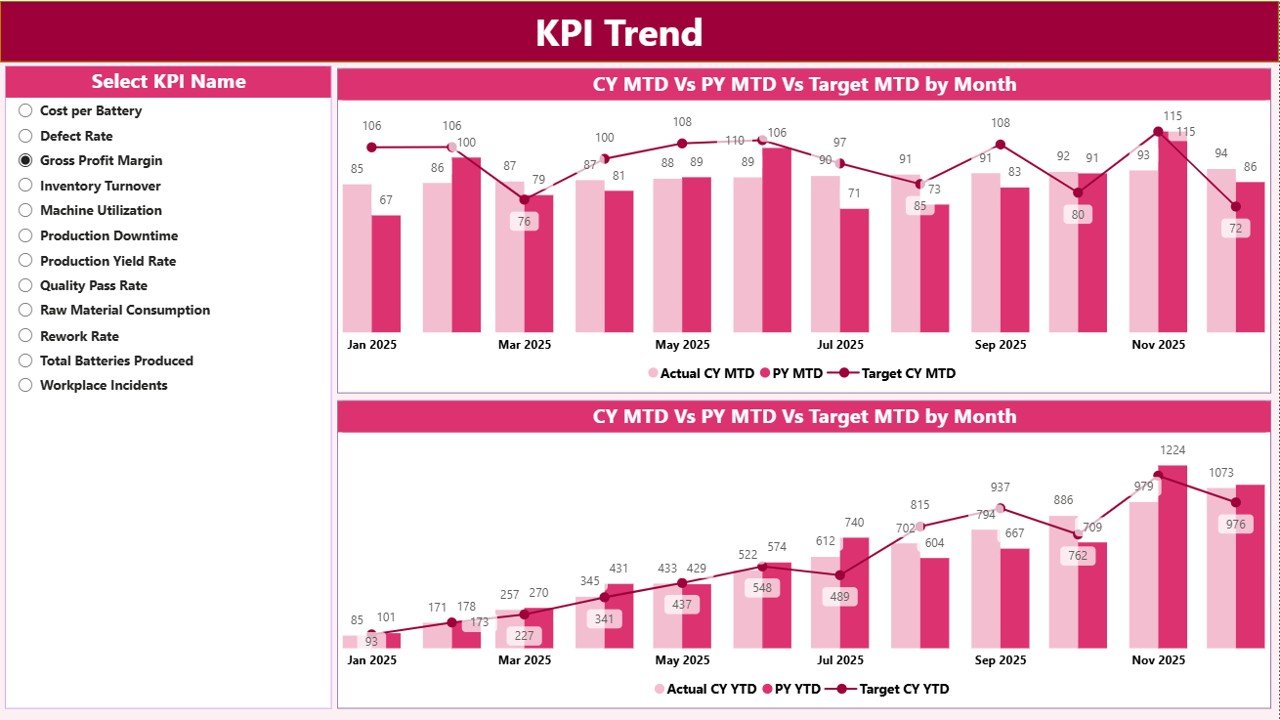
✅ Dedicated KPI Trend Page for MTD and YTD analysis
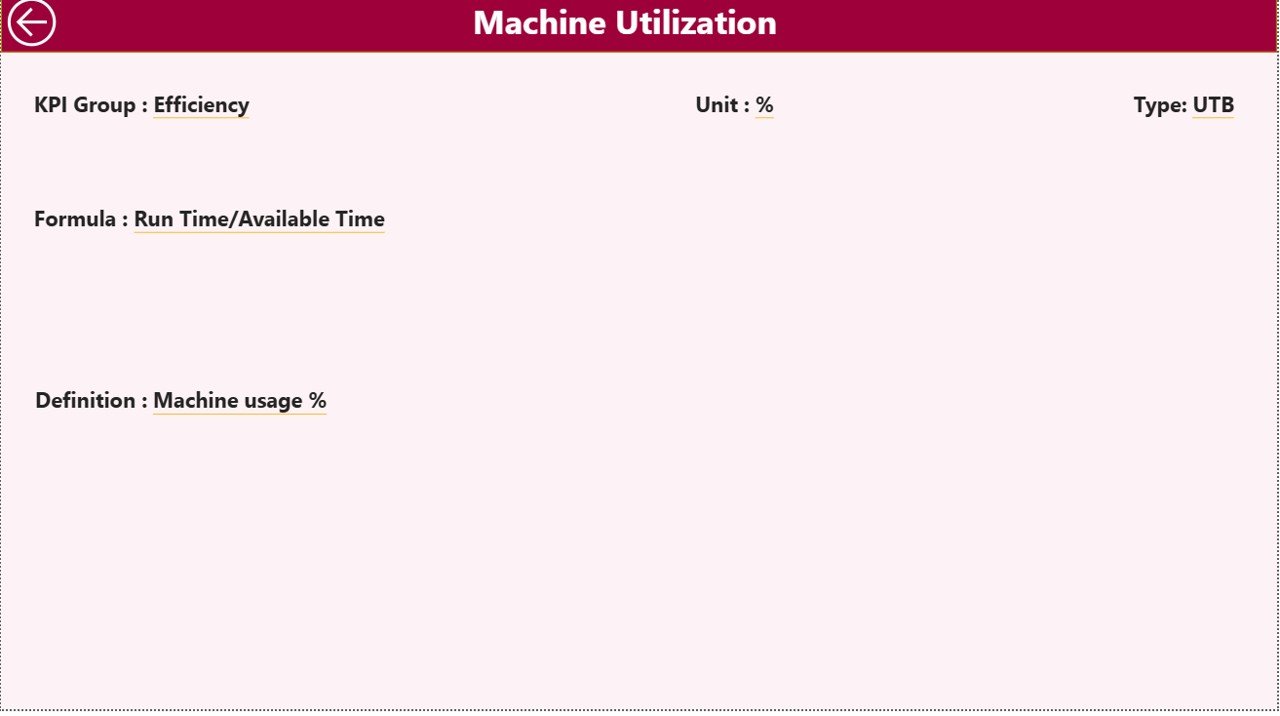
✅ Drill-through KPI Definition Page with formulas and explanations
✅ Dynamic Power BI visuals for faster decision-making
✅ Excel-based data source for easy updates without technical complexity
📦 What’s Inside the Battery Manufacturing KPI Dashboard in Power BI
This digital product includes a professionally designed Power BI dashboard connected with structured Excel data files.
You will get:
-
Power BI Dashboard File (.PBIX)
-
Excel Data Source Template
-
KPI Definition Structure
-
Pre-built Measures & Visualizations
-
Interactive Dashboard Pages
The Excel file contains three organized sheets:
Input_Actual Sheet – Enter actual manufacturing performance values.
Input_Target Sheet – Maintain KPI targets separately for planning comparison.
KPI Definition Sheet – Store KPI formulas, logic, and KPI types (LTB/UTB).
This structured setup ensures consistency, scalability, and easy implementation across manufacturing teams.
🛠 How to Use the Battery Manufacturing KPI Dashboard in Power BI
Using this dashboard is simple — even for beginners.
1️⃣ Enter actual performance data in the Excel template.
2️⃣ Update monthly or weekly KPI targets.
3️⃣ Open the Power BI file and refresh data.
4️⃣ Use slicers to filter KPIs instantly.
5️⃣ Analyze trends and performance comparisons.
6️⃣ Identify underperforming areas using visual indicators.
Because calculations and visuals are already configured, users only need to update data — no advanced Power BI skills required.
👥 Who Can Benefit from This Battery Manufacturing KPI Dashboard
This dashboard is ideal for professionals and organizations involved in manufacturing analytics, including:
-
Battery Manufacturing Companies
-
Production Managers
-
Operations Leaders
-
Quality Control Teams
-
Plant Supervisors
-
Data Analysts
-
Industrial Engineers
-
Energy Storage Manufacturers
-
EV Component Manufacturers
Whether you manage a production plant or oversee operational strategy, this dashboard helps you monitor performance with clarity and confidence.
The Battery Manufacturing KPI Dashboard in Power BI enables organizations to move beyond traditional reporting. Instead of reacting to problems late, teams gain real-time visibility into operations, allowing faster decisions and continuous improvement.
By combining structured Excel inputs with powerful Power BI visualizations, this dashboard provides a modern analytics environment that improves productivity, enhances accountability, and supports data-driven manufacturing strategies.
In today’s competitive industry, smart analytics is no longer optional — it is essential for sustainable growth.
Click here to read the Detailed blog post
Watch the step-by-step video tutorial: