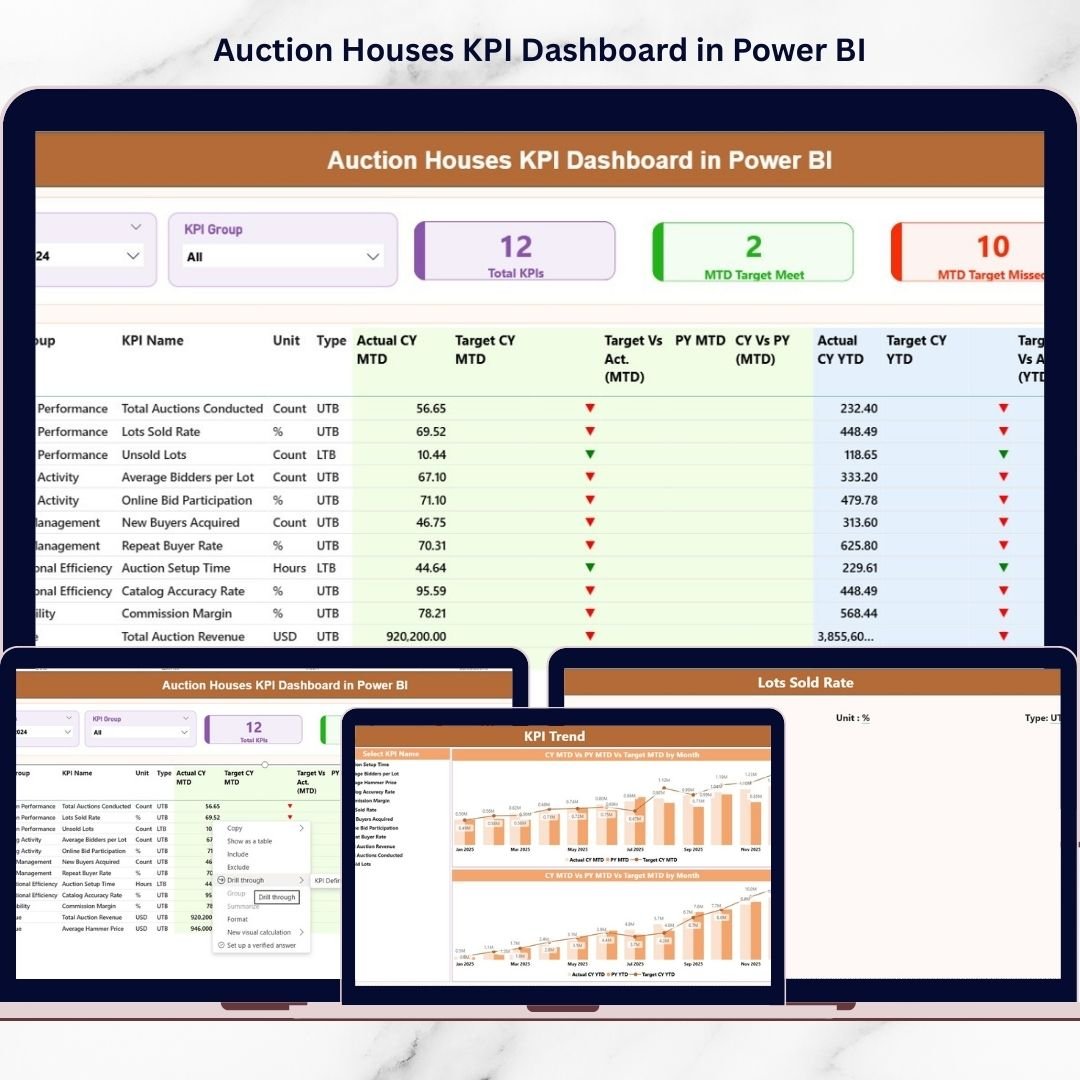
Managing auction operations without clear performance visibility can quickly become overwhelming. Auction houses handle consignments, bidders, commissions, revenue targets, and event outcomes simultaneously. However, many businesses still rely on scattered spreadsheets and manual reporting. As a result, leaders struggle to identify trends, monitor KPIs, and make timely strategic decisions.What if you could monitor your entire auction performance from one interactive dashboard?The solution is simple — Auction Houses KPI Dashboard in Power BI.This professionally designed and ready-to-use dashboard transforms raw Excel data into powerful visual insights. Instead of spending hours preparing reports, you can instantly analyze operational and financial performance using dynamic Power BI visuals.
Built specifically for auction businesses, this dashboard provides structured KPI tracking, trend analysis, and performance monitoring in one centralized interface. Consequently, auction managers gain clarity, improve efficiency, and make faster data-driven decisions.
🚀 Key Feature of Auction Houses KPI Dashboard in Power BI
✅ Interactive KPI Monitoring – Track auction performance using dynamic visuals and slicers.
✅ Target vs Actual Analysis – Instantly compare performance against targets.
✅ MTD & YTD Performance Tracking – Monitor both short-term and long-term results.
✅ KPI Trend Analysis – Identify growth patterns and performance gaps easily.
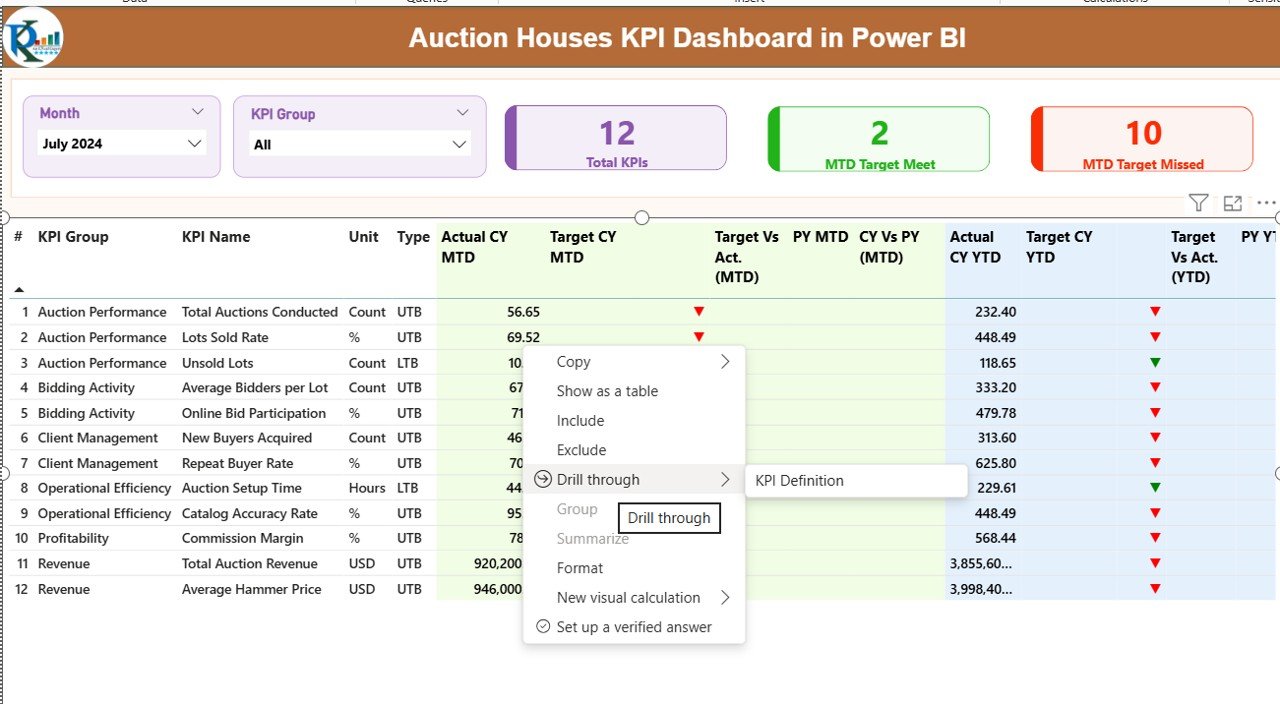
✅ Drill-Through KPI Definitions – Understand formulas and KPI logic instantly.
✅ Automated Data Refresh – Update Excel inputs and refresh Power BI to update visuals automatically.
✅ Visual Performance Indicators – Color icons highlight achieved and missed targets.
✅ Flexible KPI Structure – Add or modify KPIs without redesigning the dashboard.
📦 What’s Inside the Auction Houses KPI Dashboard in Power BI
This dashboard includes three powerful analytical pages designed for complete performance visibility:
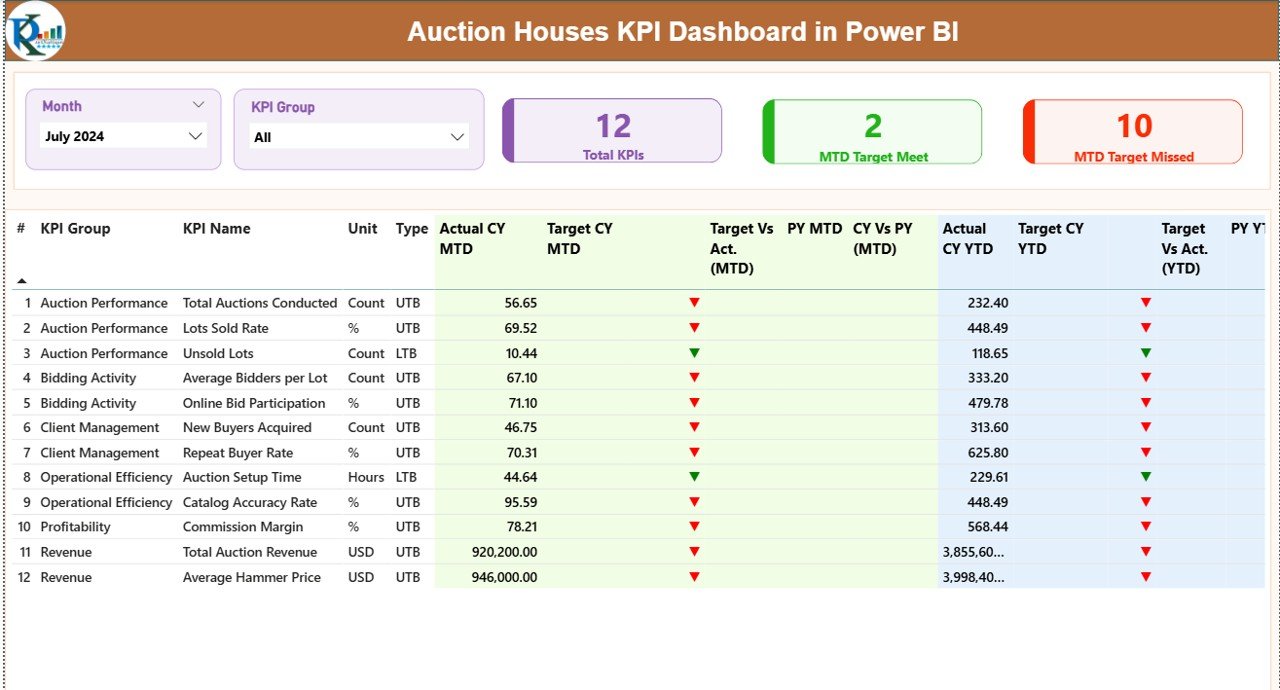
1️⃣ Summary Page – Executive Overview
View total KPI performance, target achievement status, and detailed KPI tables with MTD and YTD comparisons.
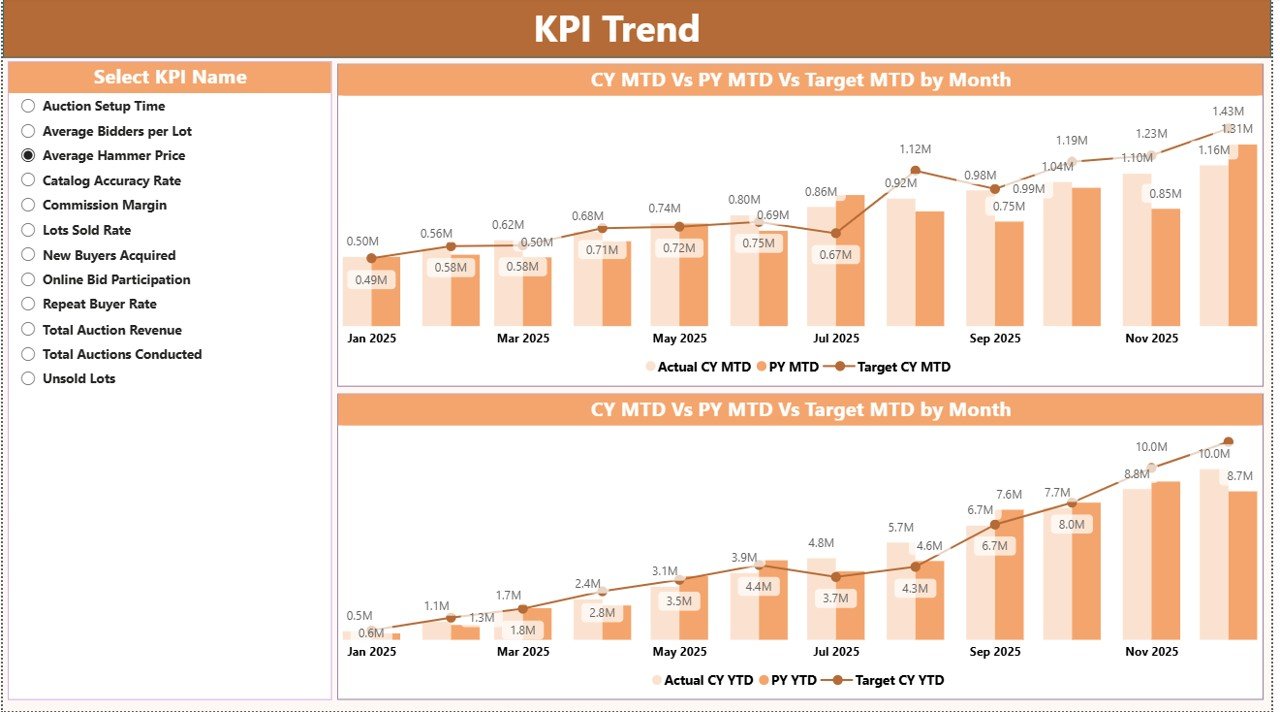
2️⃣ KPI Trend Page – Performance Movement Analysis
Analyze monthly and yearly trends using combo charts comparing Actual, Target, and Previous Year values.
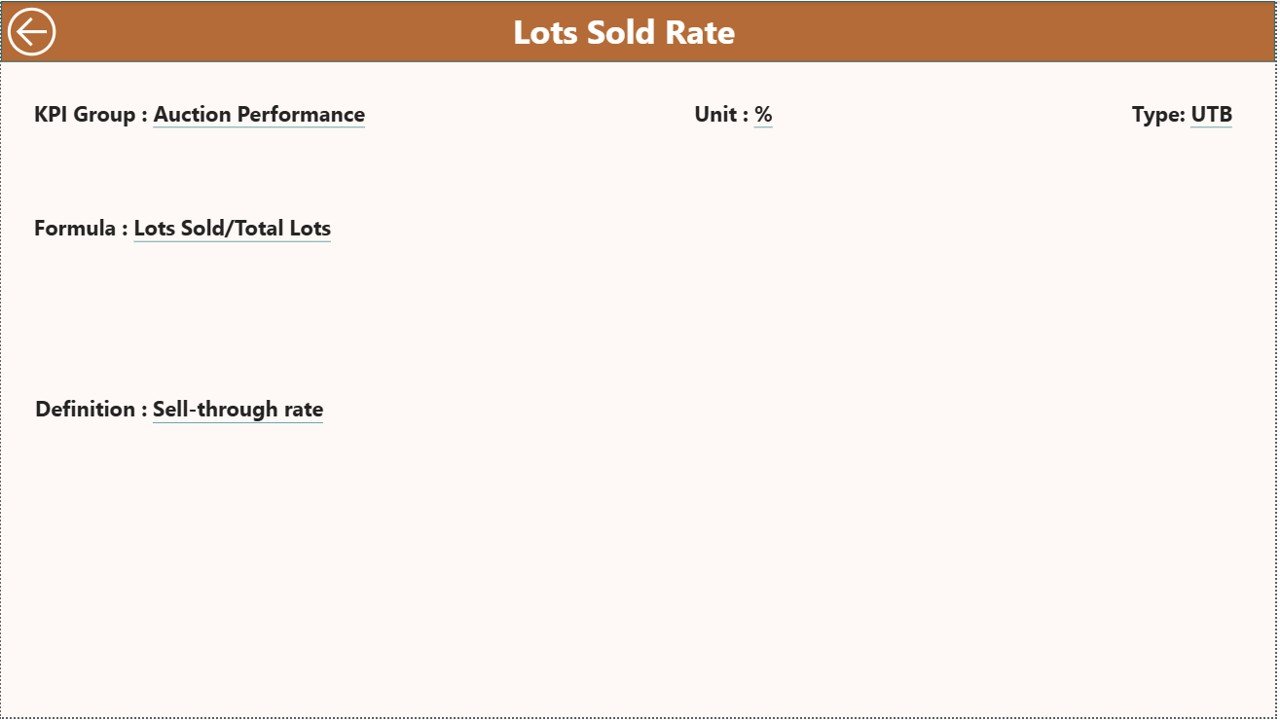
3️⃣ KPI Definition Page – Drill-Through Intelligence
Access KPI formulas, definitions, measurement logic, and KPI types for transparency and consistency.
Additionally, the dashboard connects to structured Excel sheets:
-
Input_Actual (Actual performance data)
-
Input_Target (KPI targets)
-
KPI Definition (KPI logic and formulas)
⚙️ How to Use the Auction Houses KPI Dashboard in Power BI
Using this dashboard is simple and requires no advanced Power BI expertise.
1️⃣ Enter performance data in Excel input sheets.
2️⃣ Update monthly KPI values and targets.
3️⃣ Open Power BI Desktop.
4️⃣ Click Refresh.
5️⃣ Instantly view updated dashboards and insights.
Because of this streamlined workflow, reporting becomes fast, accurate, and easy to maintain.
👥 Who Can Benefit from This Auction Houses KPI Dashboard in Power BI
This dashboard is ideal for professionals across auction organizations:
✔️ Auction House Owners – Monitor business health instantly.
✔️ Auction Managers – Track operational performance efficiently.
✔️ Financial Managers – Analyze revenue and commission metrics.
✔️ Business Analysts – Perform trend and KPI analysis.
✔️ Operations Teams – Improve auction efficiency and outcomes.
Whether you operate a small auction firm or a large auction enterprise, this dashboard helps standardize reporting and improve decision-making.
By implementing structured KPI tracking, auction houses gain deeper insights into performance drivers. Managers identify profitable categories, reduce inefficiencies, and improve target achievement rates. Instead of reacting late, teams make proactive decisions supported by real data.
Power BI’s interactive analytics eliminate reporting delays and transform complex datasets into easy-to-understand visuals. Consequently, businesses spend less time preparing reports and more time improving performance.
If you want to modernize auction reporting, improve transparency, and scale operations confidently, this dashboard becomes an essential management tool.
Click here to read the Detailed blog post
Watch the step-by-step video tutorial:


