Running a successful pet care business today requires more than passion. It requires visibility, control, and data-driven decisions.
Pet owners expect premium grooming, reliable boarding, professional daycare, quality training, and trusted veterinary services. However, if you still depend on scattered spreadsheets, you cannot see the full picture of your business performance.
That is exactly why you need the Pet Care Services KPI Dashboard in Power BI.
This ready-to-use, professionally designed Power BI dashboard transforms your Excel data into interactive business intelligence reports. Instead of manually reviewing multiple sheets, you can monitor bookings, revenue, occupancy rates, customer retention, and staff productivity in one dynamic interface.
It is modern. It is interactive. And it is built to help you grow faster.
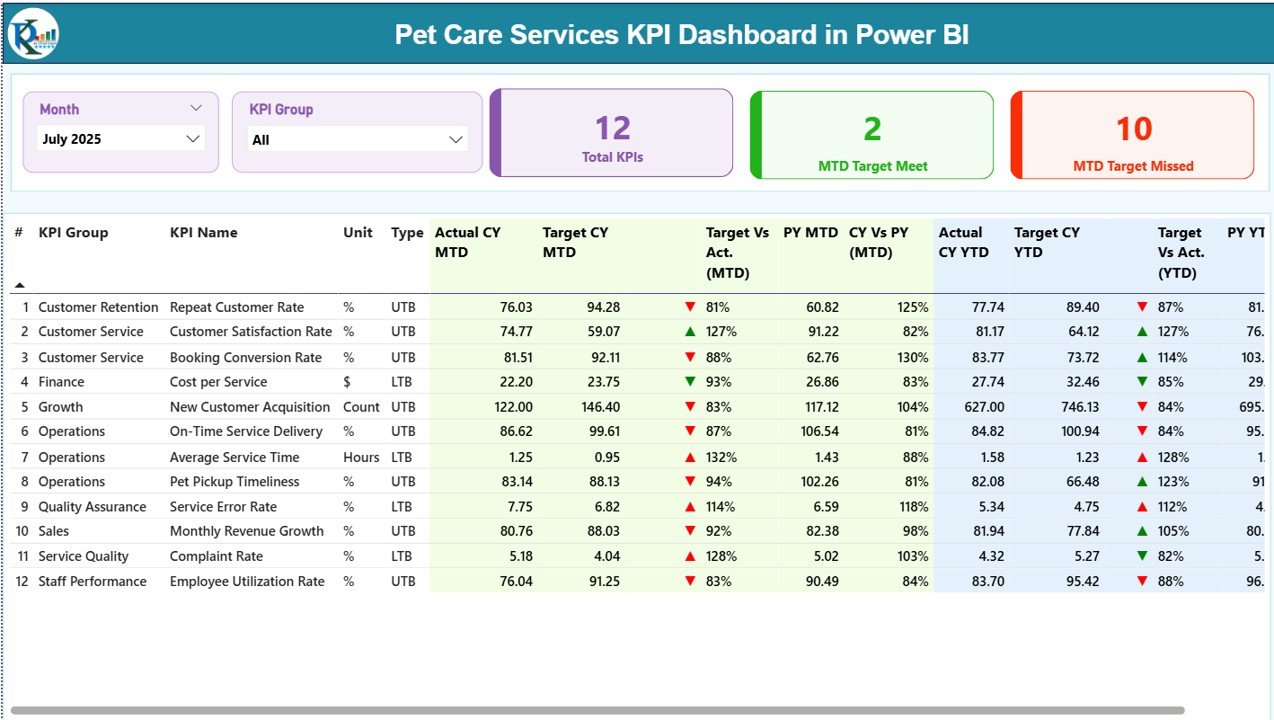
🚀 Key Feature of Pet Care Services KPI Dashboard in Power BI
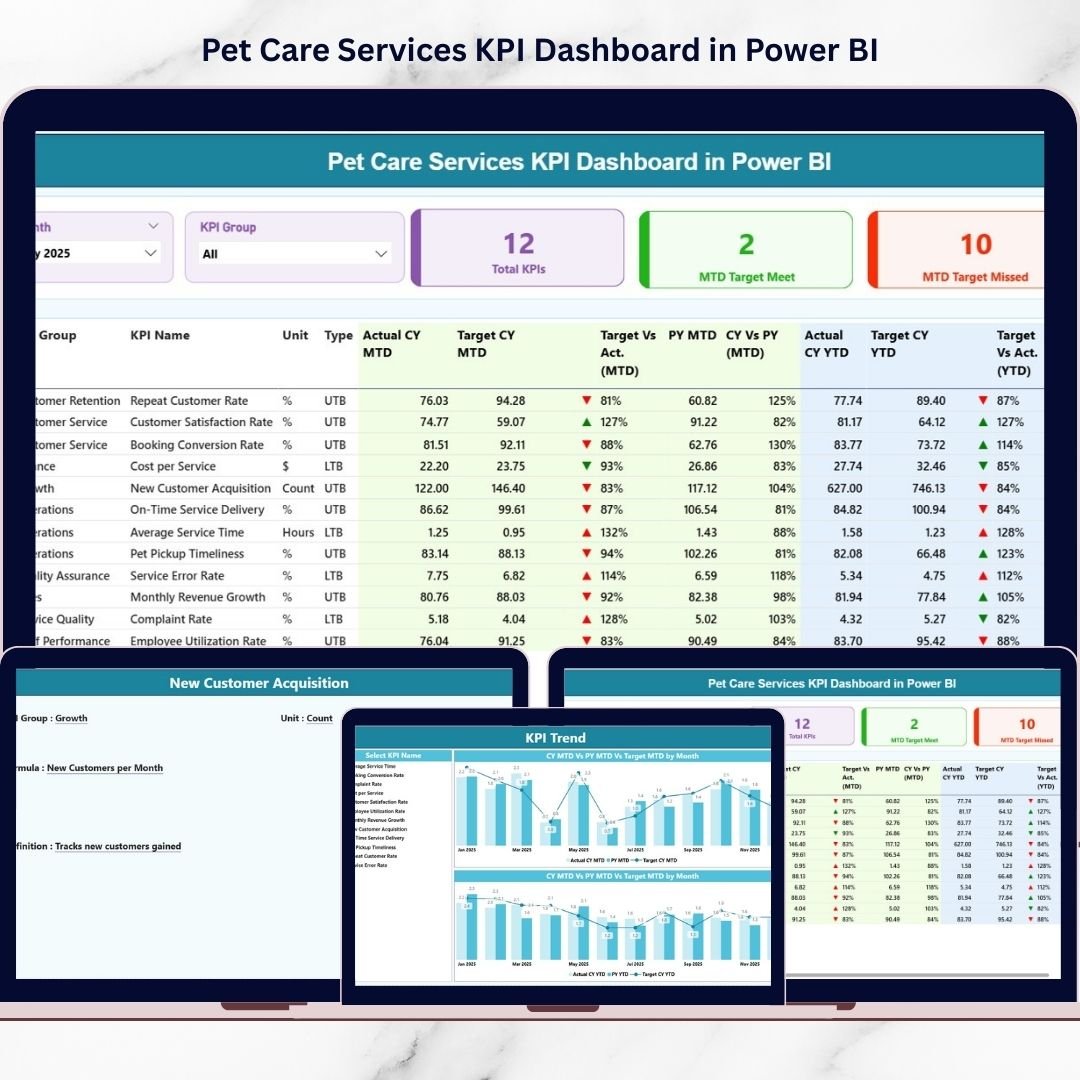
📊 Interactive Summary Page
Filter by Month and KPI Group instantly using slicers at the top of the dashboard.
🎯 Target vs Actual Monitoring
Compare MTD and YTD Actual vs Target performance with automatic percentage calculations.
📈 Year-over-Year Analysis
Track Current Year vs Previous Year performance using visual indicators.
📋 Smart KPI Cards
Quickly view:
-
Total KPIs Count
-
MTD Target Meet Count
-
MTD Target Missed Count
📉 Visual Icons & Indicators
Up and down arrows (▲ ▼) instantly show whether KPIs are improving or declining.
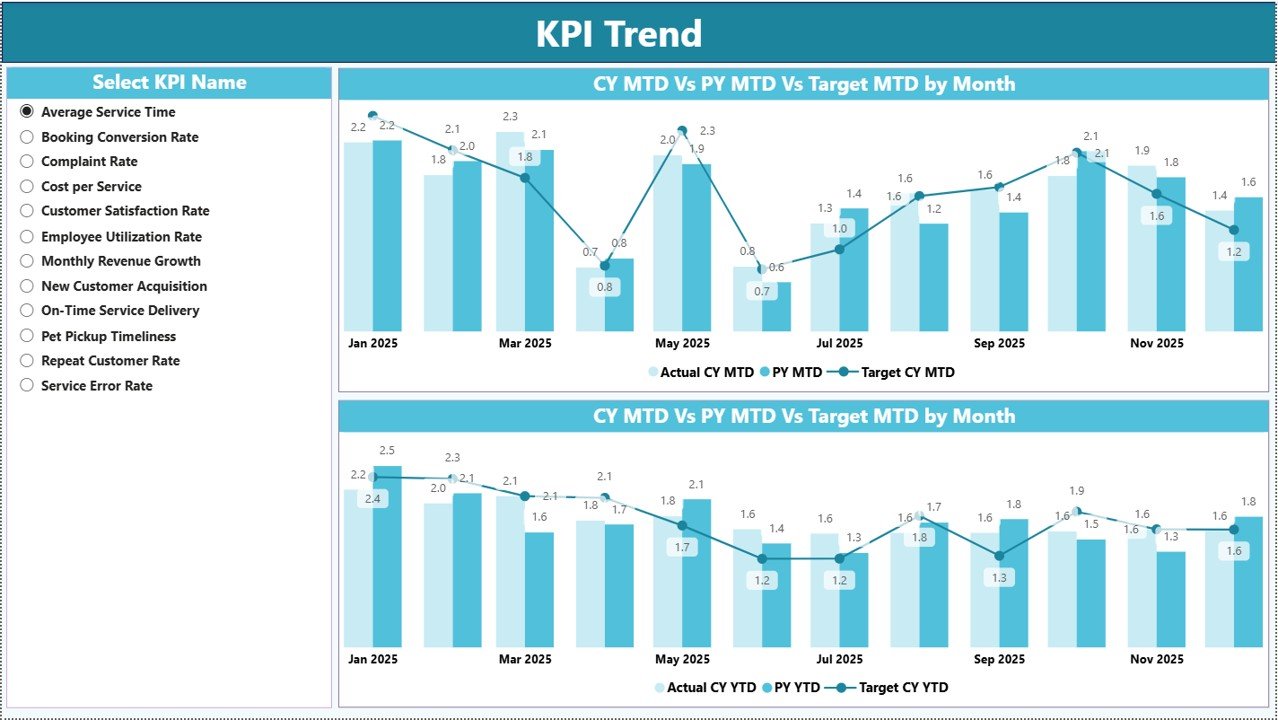
📊 Dynamic Trend Charts
Combo charts display Actual, Target, and Previous Year performance clearly.
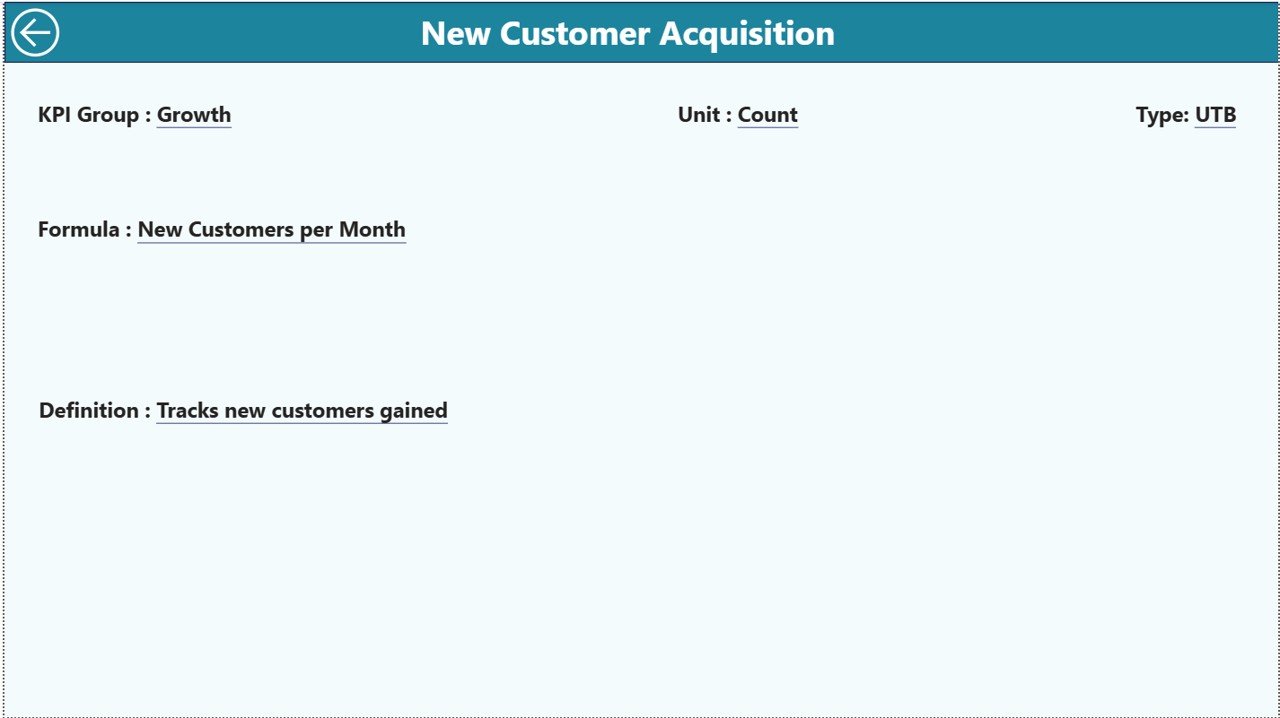
🔍 Drill-Through KPI Definitions
Click any KPI to view its detailed definition, formula, and type instantly.
📦 What’s Inside the Pet Care Services KPI Dashboard in Power BI
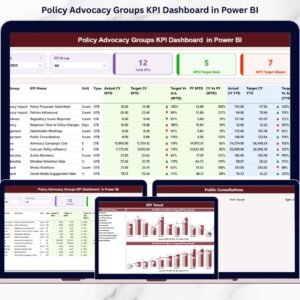
This powerful dashboard includes 3 professional report pages:
✔️ Summary Page – Complete KPI overview with slicers, KPI cards, and structured KPI table.
✔️ KPI Trend Page – Visual analysis with MTD and YTD combo charts for selected KPIs.
✔️ KPI Definition Page – Drill-through page displaying KPI formula, unit, type (LTB/UTB), and explanation.
The dashboard connects to a structured Excel data source containing:
• Input Actual sheet
• Input Target sheet
• KPI Definition sheet
Once you refresh the data, everything updates automatically.
🛠️ How to Use the Pet Care Services KPI Dashboard in Power BI
Using this dashboard is simple and structured:
1️⃣ Enter MTD and YTD data in the Input Actual sheet.
2️⃣ Define monthly targets in the Input Target sheet.
3️⃣ Maintain KPI definitions in the KPI Definition sheet.
4️⃣ Refresh the Power BI report.
5️⃣ Use slicers to filter by month or KPI group.
That’s it.
The dashboard instantly calculates:
✔ Target vs Actual %
✔ Current Year vs Previous Year %
✔ MTD & YTD performance
✔ KPI status indicators
You do not need advanced Power BI skills. If you can refresh data and use slicers, you can operate this dashboard confidently.
🐶 Who Can Benefit from This Pet Care Services KPI Dashboard in Power BI
This dashboard is ideal for:
🐾 Pet Grooming Salons
🐾 Veterinary Clinics
🐾 Boarding Centers
🐾 Pet Daycare Facilities
🐾 Training Institutes
🐾 Multi-Location Pet Care Businesses
If you want professional reporting, structured KPI tracking, and modern visual analytics — this solution is built for you.
Instead of reviewing raw Excel sheets, you can now:
✔ Monitor revenue performance
✔ Track occupancy and utilization rates
✔ Measure customer retention
✔ Evaluate staff productivity
✔ Analyze target achievement
✔ Identify seasonal growth patterns
This is not just a dashboard.
It is your complete pet care business intelligence system.
⭐ Why This Dashboard Will Transform Your Business
• Real-time interactive reporting
• Modern Power BI visualization
• Instant KPI filtering
• Drill-through clarity
• Clear performance indicators
• Professional management reporting
Stop guessing.
Start analyzing with confidence.
When you rely on structured KPI monitoring, you make smarter pricing decisions, optimize staffing, improve service capacity, and increase customer satisfaction.
If you are serious about scaling your pet care business, this Pet Care Services KPI Dashboard in Power BI will become your most powerful decision-making tool.