Managing facility leases across multiple locations should not feel overwhelming. However, many organizations still rely on scattered spreadsheets and manual tracking. As a result, teams struggle to monitor lease costs, escalation trends, occupancy status, and service charges in real time.
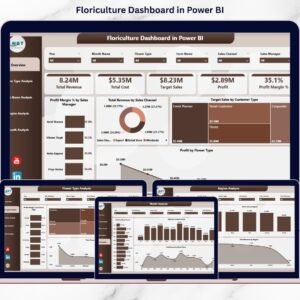
That’s why we created the Facilities Leasing Dashboard in Power BI — a powerful, ready-to-use business intelligence solution that transforms complex lease data into clear, interactive insights.
With this professionally designed dashboard, facility managers and finance teams can track lease performance, identify cost drivers, and compare departments, regions, and facility types — all in one centralized Power BI environment. Consequently, your organization gains better visibility, faster analysis, and stronger financial control.
If you want to move from reactive reporting to proactive facility management, this dashboard is exactly what you need.
🔑 Key Feature of Facilities Leasing Dashboard in Power BI
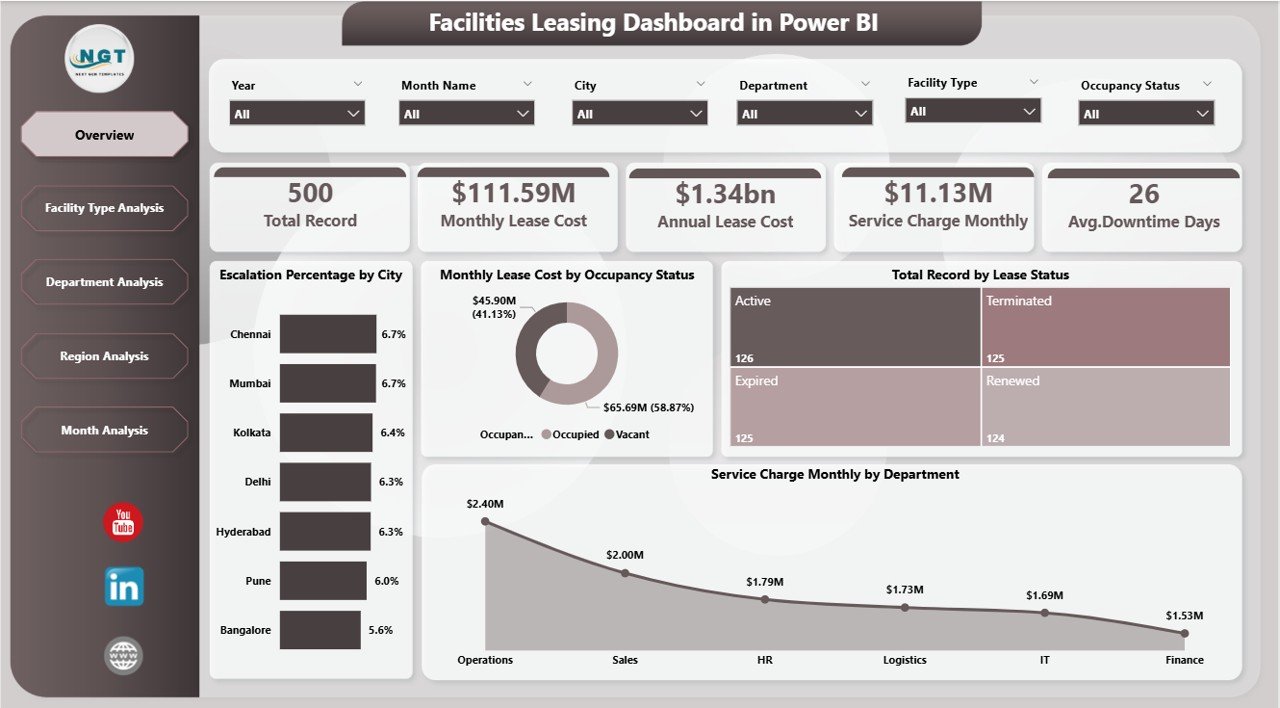
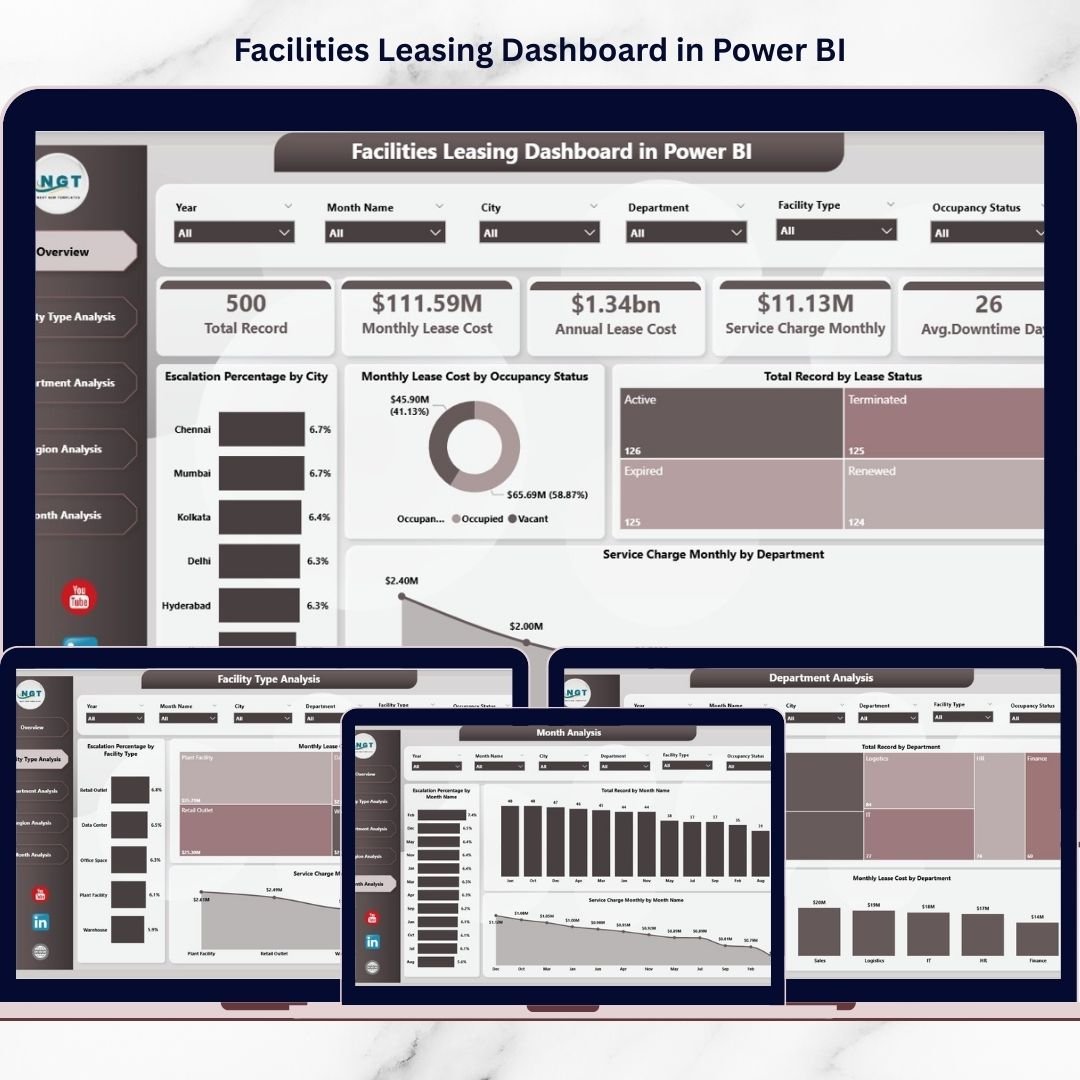
✨ Executive Overview Page
Instantly view key leasing KPIs with dynamic cards and high-impact visuals.
📊 Interactive Slicers
Filter by city, department, region, facility type, and month for real-time insights.
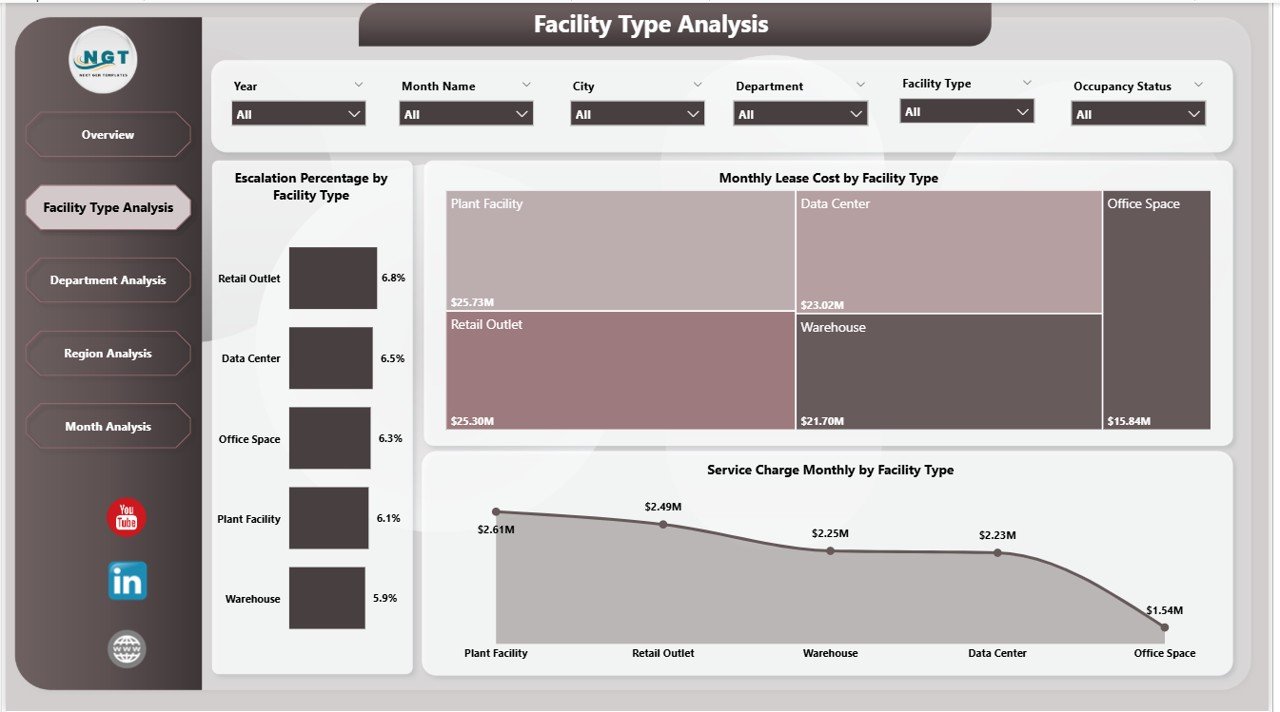
🏢 Facility Type Intelligence
Identify which facility categories generate the highest lease costs and service charges.
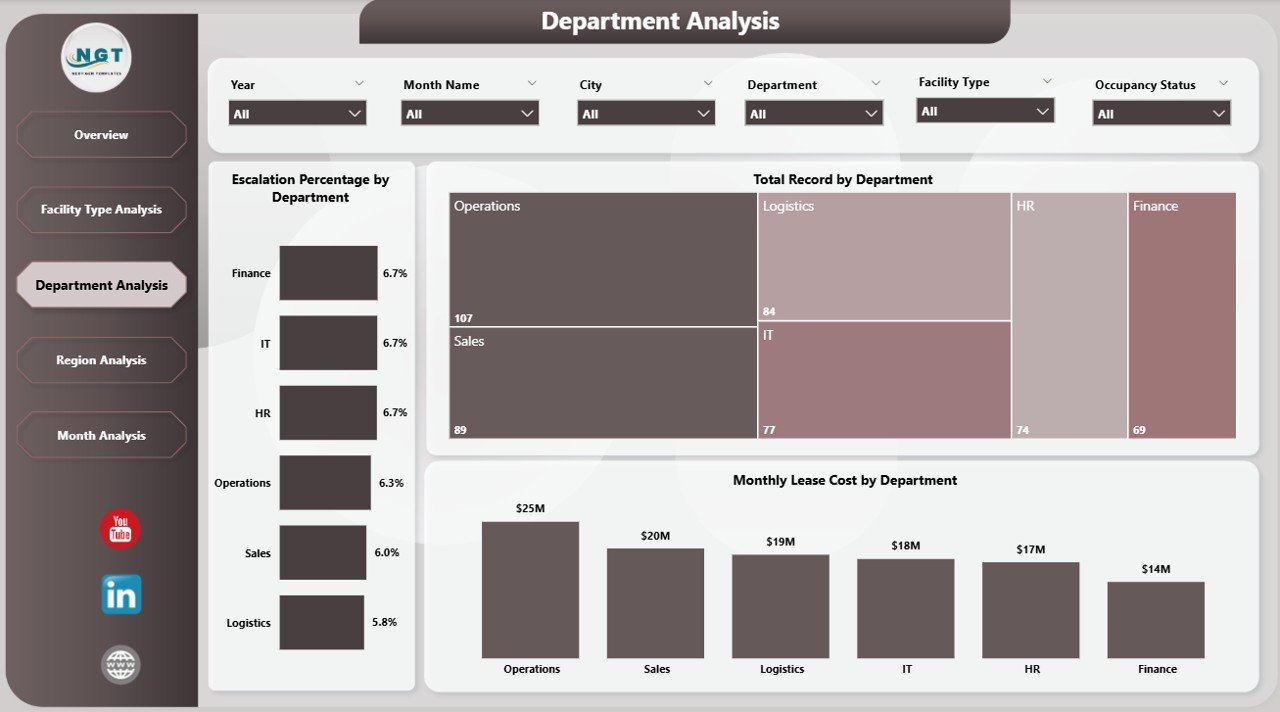
👥 Department Cost Analysis
Monitor department-wise leasing expenses and improve budget accountability.
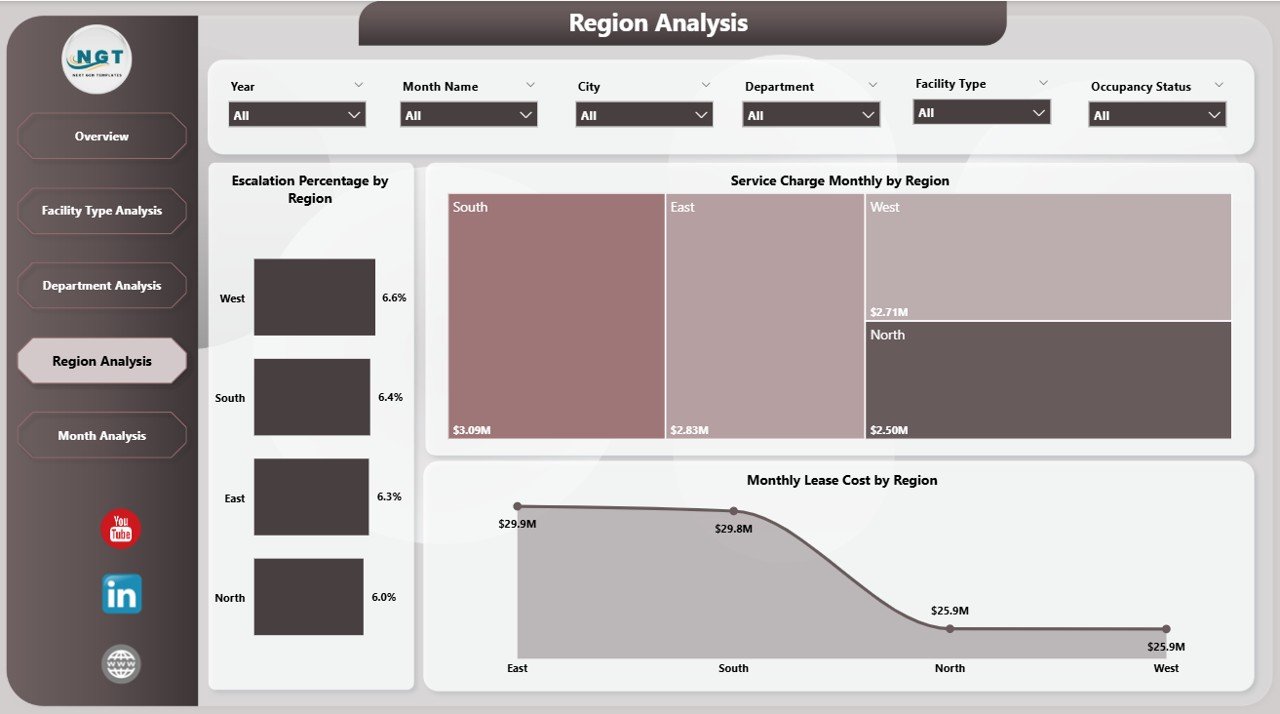
🌍 Region Performance Tracking
Compare geographic performance and detect high-cost regions quickly.
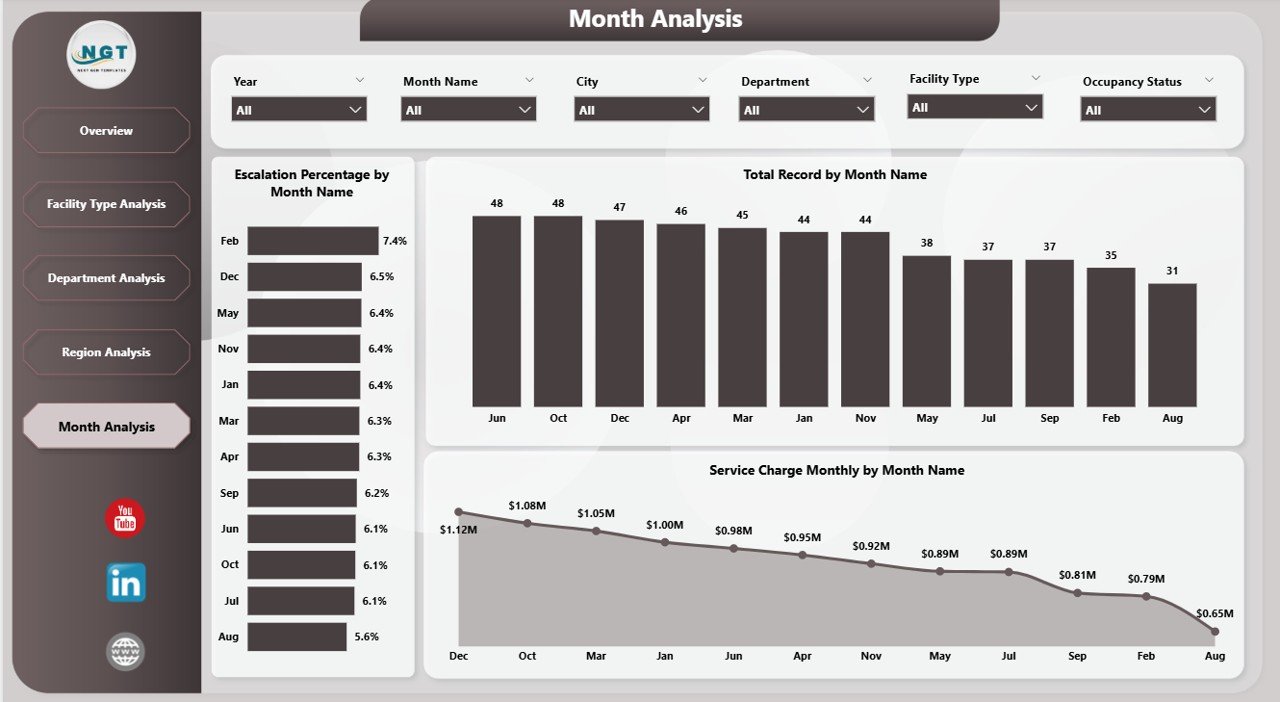
📅 Monthly Trend Monitoring
Track escalation patterns, service charges, and lease growth over time.
⚡ High-Speed Power BI Model
Optimized for smooth performance even with large datasets.
🎯 Executive-Ready Visuals
Clean, professional charts perfect for leadership reviews and presentations.
📦 What’s Inside the Facilities Leasing Dashboard in Power BI
This product delivers a complete, ready-to-use Power BI analytics solution.
✔️ Power BI Desktop File (.pbix)
✔️ 5 Fully Interactive Analytical Pages
✔️ Dynamic KPI Cards
✔️ Advanced Slicers for Filtering
✔️ Clean and Structured Data Model
✔️ Interactive Visual Reports
✔️ Easy Data Refresh Framework
Everything is pre-built so you can start analyzing your facility portfolio immediately.
🛠️ How to Use the Facilities Leasing Dashboard in Power BI
Getting started is quick and beginner-friendly.
Step 1: Download and open the PBIX file
Step 2: Replace sample data with your facility lease data
Step 3: Refresh the dataset
Step 4: Use slicers to filter insights
Step 5: Review dashboards for decision-making
Within minutes, you will have a powerful facility leasing command center.
🎯 Who Can Benefit from This Facilities Leasing Dashboard in Power BI
This dashboard is ideal for organizations managing multiple leased facilities.
✅ Facility Managers
✅ Finance Teams
✅ Corporate Real Estate Teams
✅ Operations Managers
✅ Infrastructure Teams
✅ Multi-location Businesses
✅ Admin Departments
If your organization wants better lease visibility and stronger cost control, this dashboard is a must-have.
Why This Dashboard Stands Out
Unlike manual reporting, this dashboard provides:
✔️ Centralized lease visibility
✔️ Real-time performance monitoring
✔️ Escalation tracking
✔️ Department accountability
✔️ Regional comparison
✔️ Faster executive reporting
As a result, your team shifts from reactive firefighting to proactive facility optimization.
### Click hare to read the Detailed blog post
📺 Visit our YouTube channel to learn step-by-step video tutorials
👉 Youtube.com/@PKAnExcelExpert