Brewing craft beer is passion.
Scaling a microbrewery is strategy. 🍺📊
You perfect recipes. You manage fermentation. You build brand identity. However, without structured performance tracking, small inefficiencies in yield, cost, or sales can silently reduce your margins.
Therefore, you need more than spreadsheets.
You need real-time brewing intelligence.
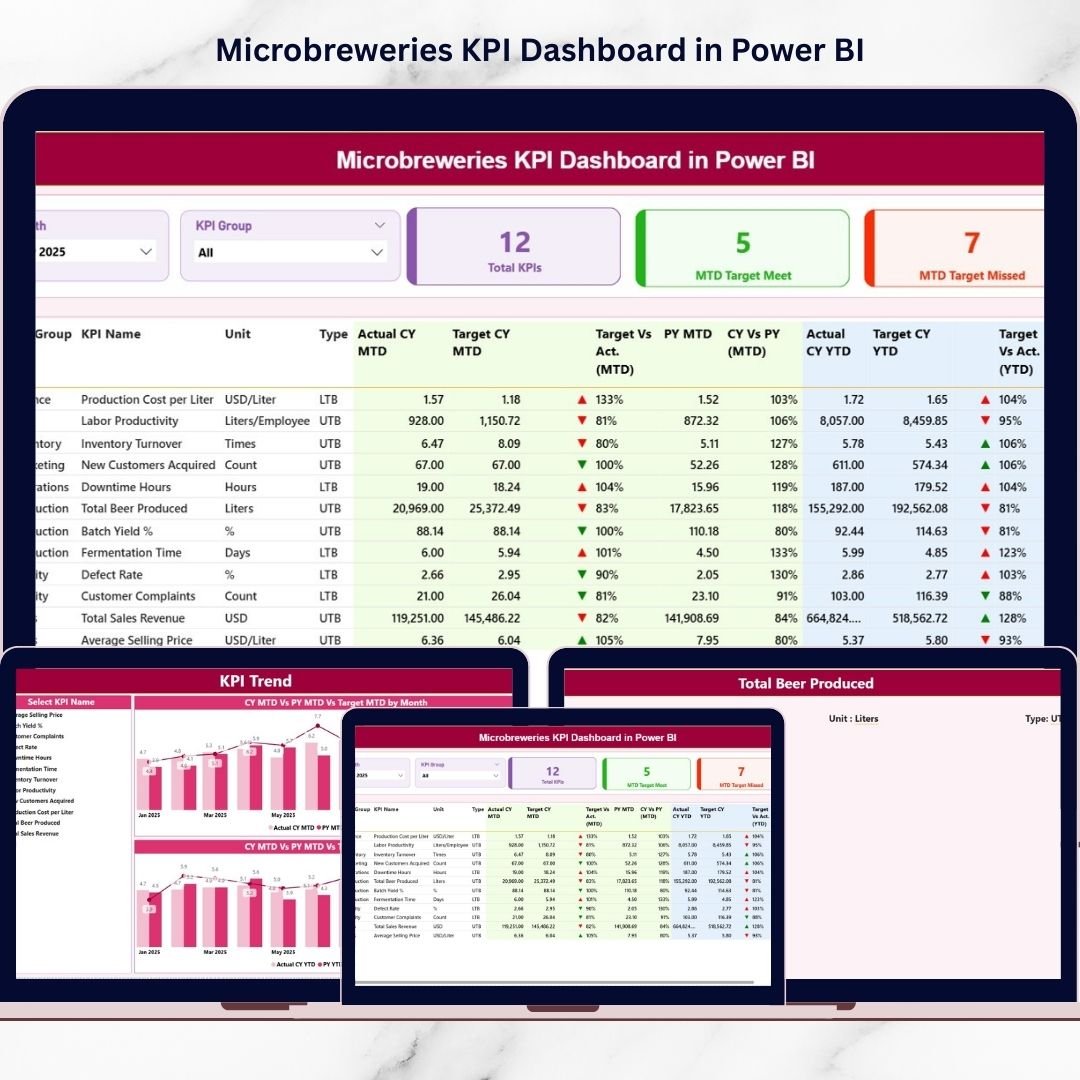
The Microbreweries KPI Dashboard in Power BI transforms structured Excel data into dynamic, interactive, and executive-ready performance visuals. Instead of manually comparing reports, you instantly monitor MTD, YTD, Target vs Actual, and Previous Year performance — all in one powerful dashboard.
Now, you do not guess.
You analyze, compare, and act.
Key Feature of Microbreweries KPI Dashboard in Power BI 🍺📈
This ready-to-use Power BI dashboard is designed specifically for craft breweries and microbreweries.
🚀 Interactive Month & KPI Group Slicers
📊 MTD & YTD Performance Tracking
🎯 Target vs Actual Comparison
📅 Current Year vs Previous Year Analysis
🔴🟢 Red/Green KPI Performance Icons
📈 Combo Trend Charts (MTD & YTD)
🔍 Drill-Through KPI Definition Page
📂 Excel-Based Data Integration
Because it runs inside Power BI, you get professional visuals with instant filtering and interactive analysis.
What’s Inside the Microbreweries KPI Dashboard in Power BI 📊
This Power BI file contains 3 structured pages; each designed for clarity and decision-making.
1️⃣ Summary Page – Your Brewery Control Panel
This is the main performance overview page.
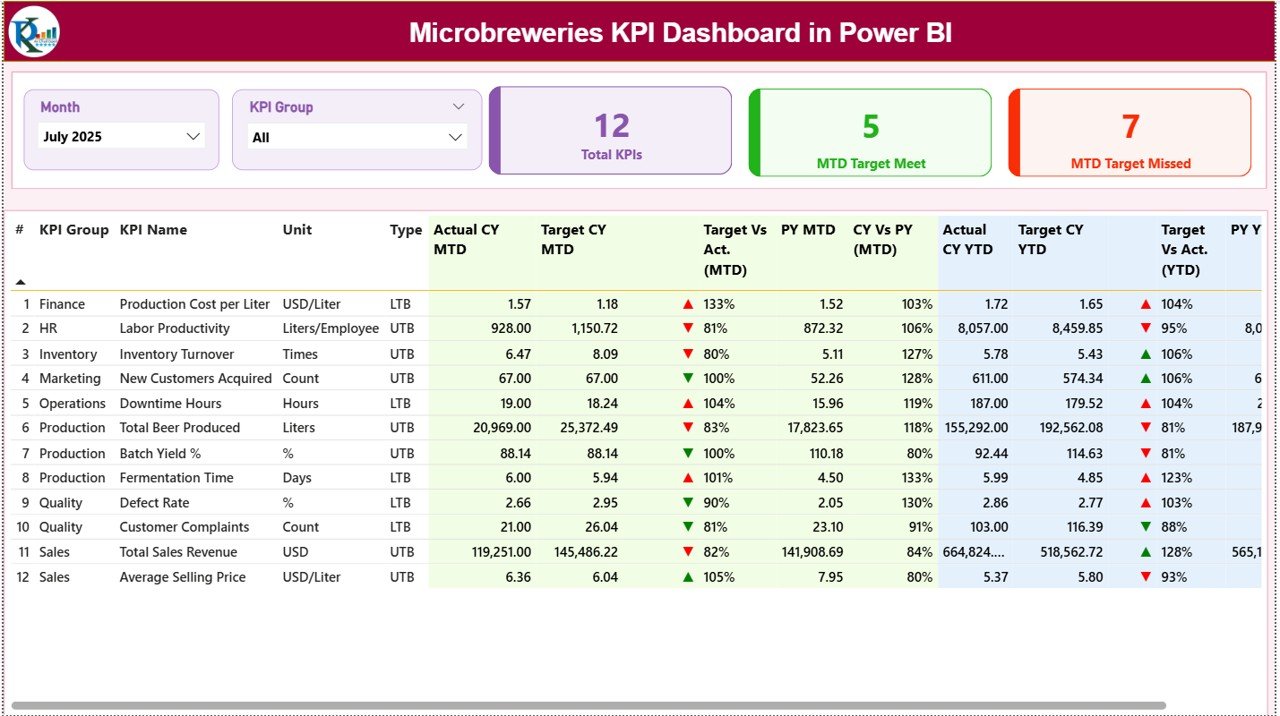
At the top, you will find:
📅 Month Slicer
📊 KPI Group Slicer
These allow you to filter by specific month or category (Production, Financial, Quality, Sales).
KPI Cards Section
Three KPI cards provide instant visibility:
-
Total KPIs Count
-
MTD Target Meet Count
-
MTD Target Missed Count
Within seconds, you understand overall brewery health.
Detailed KPI Performance Table
The structured KPI table displays:
-
KPI Number
-
KPI Group
-
KPI Name
-
Unit
-
Type (LTB or UTB)
-
Actual CY MTD
-
Target CY MTD
-
PY MTD
-
Target vs Actual % (MTD)
-
CY vs PY % (MTD)
-
Actual CY YTD
-
Target CY YTD
-
PY YTD
-
Target vs Actual % (YTD)
-
CY vs PY % (YTD)
Green ▲ indicates positive growth.
Red ▼ highlights underperformance.
Therefore, performance interpretation becomes immediate and simple.
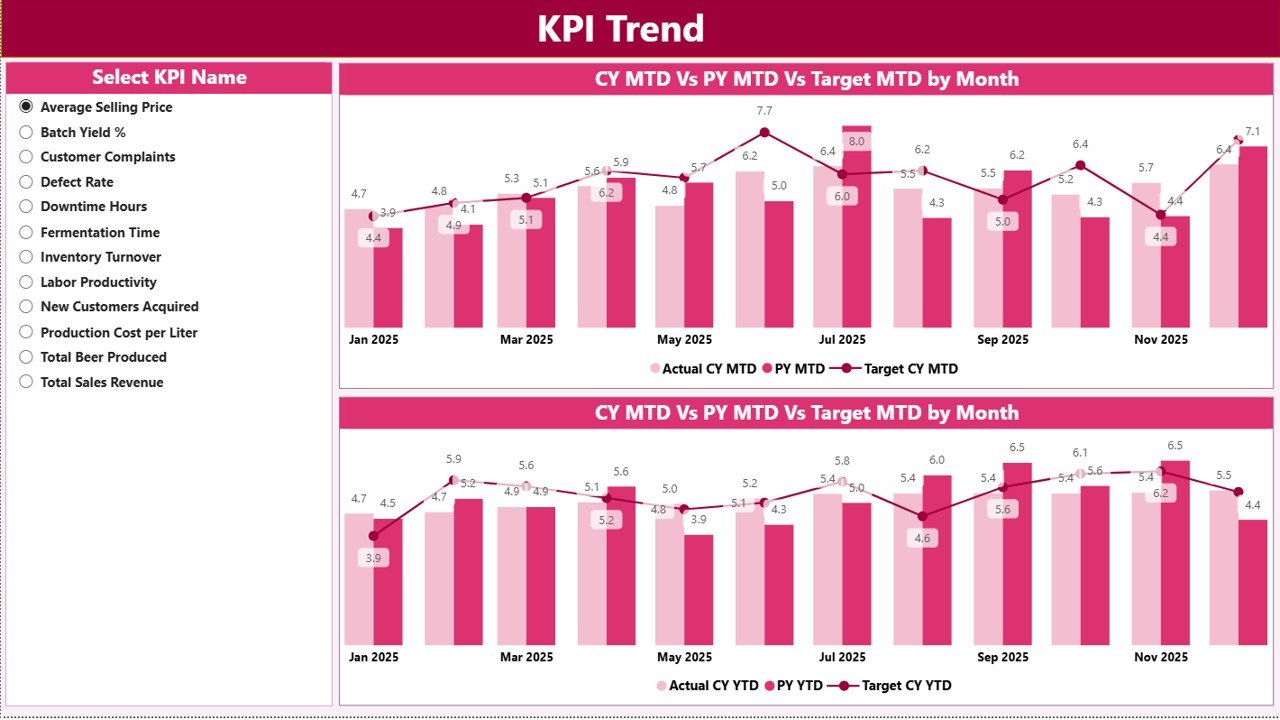
2️⃣ KPI Trend Page – Deep Performance Analysis
This page allows detailed trend review.
Select a KPI using the slicer, and the page instantly updates.
You get:
📊 MTD Trend Combo Chart
📊 YTD Trend Combo Chart
Each chart compares:
-
Current Year Actual
-
Previous Year Actual
-
Target
Because the dashboard shows month-by-month trends, you can:
-
Detect seasonal production dips
-
Identify declining margins
-
Analyze sales growth patterns
-
Evaluate cost fluctuations
Instead of reacting late, you anticipate issues early.
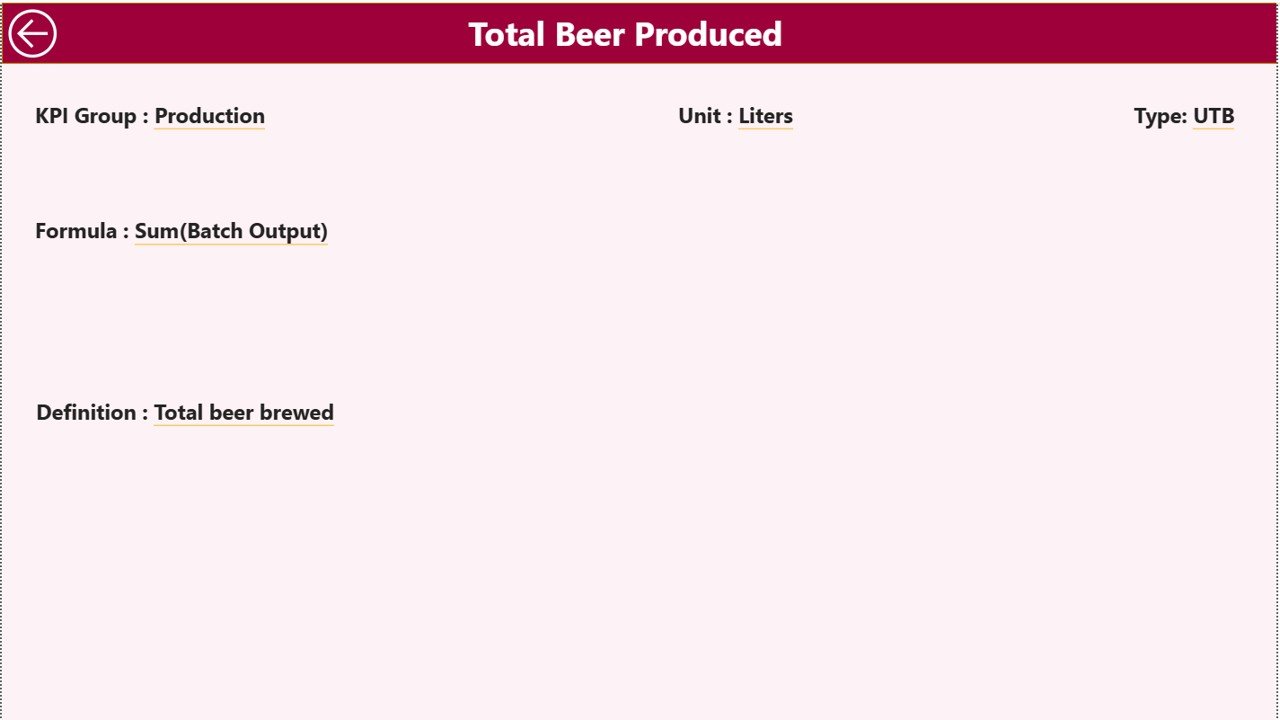
3️⃣ KPI Definition Page – Drill-Through Intelligence
This page ensures clarity and governance.
From the Summary page, you can drill through any KPI to view:
-
KPI Formula
-
KPI Definition
-
Unit
-
KPI Type (LTB or UTB)
This eliminates confusion and ensures standardized performance measurement.
How to Use the Microbreweries KPI Dashboard in Power BI ⚙️
Step 1️⃣ Enter Data in Excel
Update:
-
Input Actual Sheet
-
Input Target Sheet
-
KPI Definition Sheet
Step 2️⃣ Refresh Power BI
Click Refresh, and visuals update instantly.
Step 3️⃣ Select Month
Use the slicer to analyze specific performance periods.
Step 4️⃣ Review KPIs
Check red indicators first and investigate underperformance.
Step 5️⃣ Analyze Trends
Use the KPI Trend page to study monthly and cumulative growth.
The process is simple, structured, and powerful.
Who Can Benefit from This Microbreweries KPI Dashboard 👥
This dashboard is ideal for:
✔ Microbrewery Owners
✔ Brewmasters
✔ Production Managers
✔ Finance Teams
✔ Sales Managers
✔ Brewery Consultants
Whether you operate a small craft brewery or a growing distribution brand, this dashboard scales with you.
How This Dashboard Improves Profitability 💰
When you monitor performance clearly:
🍺 You reduce production waste
📉 You detect yield decline early
📊 You optimize ingredient cost
📈 You monitor high-margin SKUs
📅 You evaluate seasonal demand
💡 You improve pricing strategies
Because performance becomes measurable, profitability becomes controllable.
Instead of reviewing static reports, you gain interactive performance intelligence.
Brew Smarter. Grow Faster. 🚀
Craft brewing demands creativity.
Sustainable growth demands analytics.
The Microbreweries KPI Dashboard in Power BI provides:
📊 Real-time visibility
🎯 Target accountability
📈 Year-over-Year comparison
📅 MTD & YTD analysis
🔍 Drill-through transparency
📊 Professional management reporting
If you want to scale your microbrewery using structured data insights, this dashboard gives you clarity, speed, and control.
Stop guessing.
Start brewing with intelligence.
Click here to read the Detailed blog post
Visit our YouTube channel to learn step-by-step video tutorials
👉 https://youtube.com/@PKAnExcelExpert


