That is exactly why we created the Pawnshops KPI Dashboard in Power BI — a ready-to-use, interactive performance management system designed specifically for pawnshop businesses.
This powerful dashboard transforms structured Excel data into clear visual insights. You can track MTD and YTD performance instantly, compare Current Year vs Previous Year, monitor target achievement, and identify underperforming KPIs in seconds.
If you want structured control and smarter decisions, this dashboard delivers.
🚀 Key Feature of Pawnshops KPI Dashboard in Power BI
This dashboard contains 3 structured analytical pages, each built for clarity and performance monitoring.
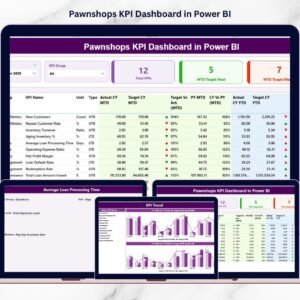
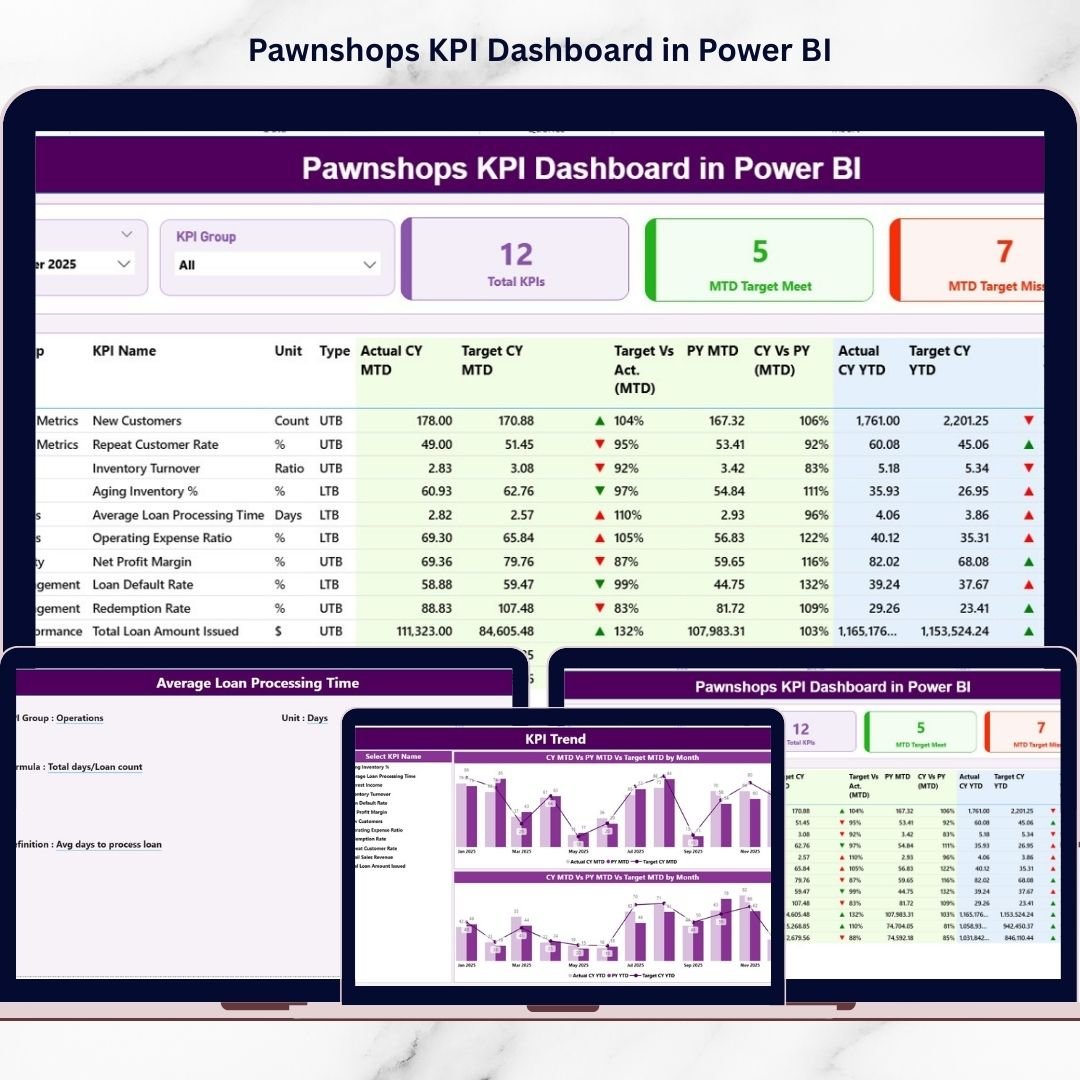
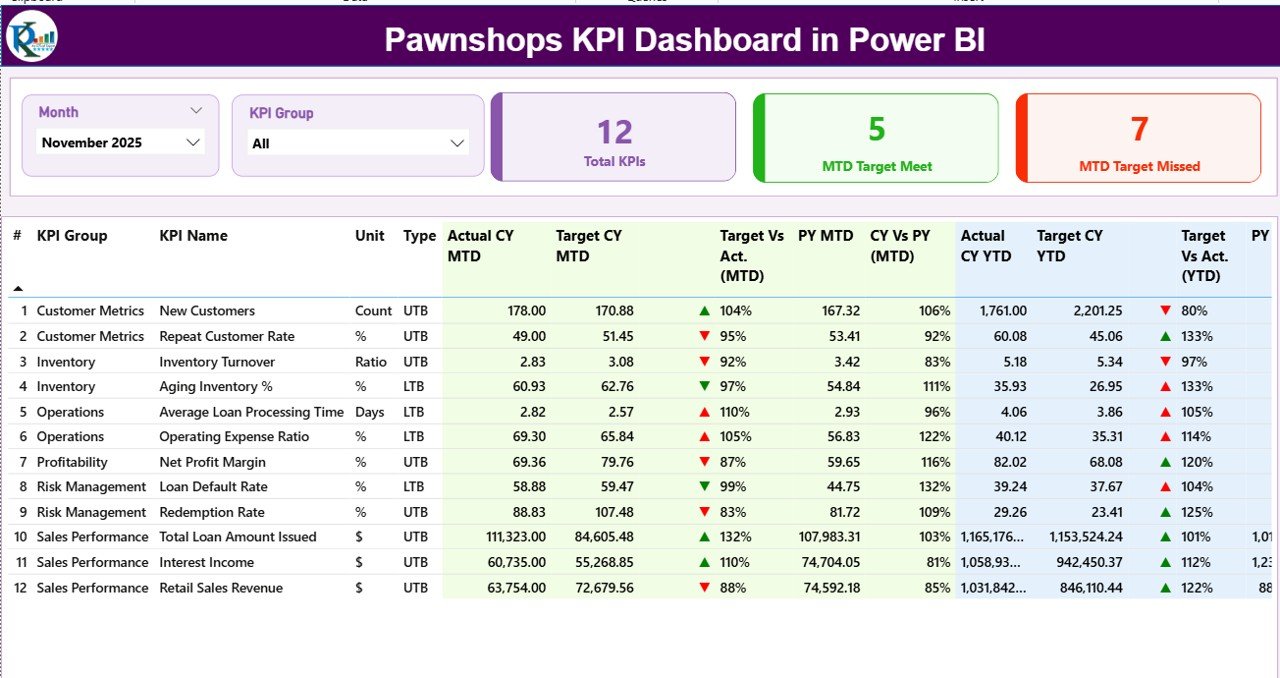
📊 Summary Page (Main Control Center) – Monitor all KPIs with MTD & YTD comparisons, visual indicators, and dynamic slicers.
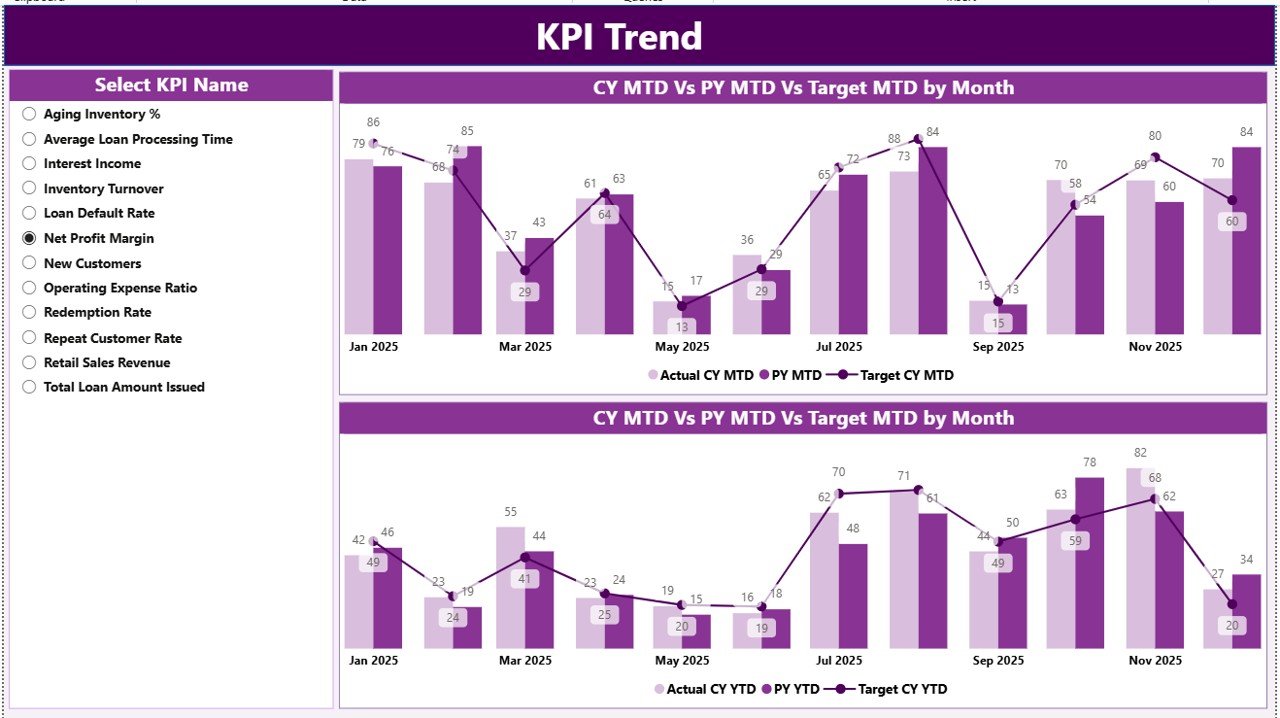
📈 KPI Trend Page – Visual combo charts comparing Actual, Target, and Previous Year performance.
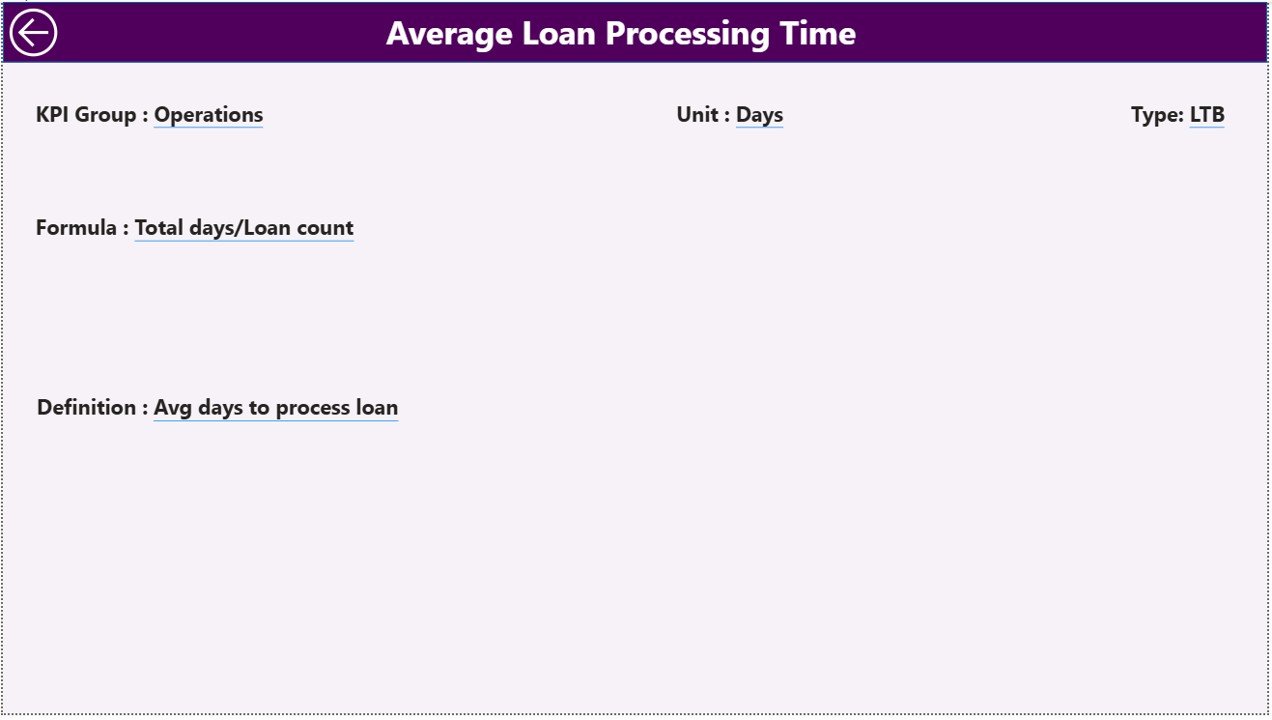
📘 KPI Definition Page (Drill-Through) – Instantly view KPI formula, definition, unit, and type (LTB/UTB).
✨ Advanced Power BI features include:
-
Month Slicer for period selection
-
KPI Group Slicer for category filtering
-
Target Meet & Missed KPI count cards
-
Green ▲ / Red ▼ performance icons
-
Dynamic filtering
-
Excel-connected data refresh
Because everything updates dynamically, leadership always sees the latest performance.
📦 What’s Inside the Pawnshops KPI Dashboard in Power BI
This ready-to-use Power BI file includes:
✔ Total KPIs Count Card
✔ MTD Target Meet Count
✔ MTD Target Missed Count
✔ MTD Actual vs Target comparison
✔ YTD Actual vs Target comparison
✔ Previous Year benchmarking
✔ KPI-level drill-through definitions
✔ Visual trend analysis charts
✔ Interactive filtering system
The backend connects to an Excel file containing:
-
Input_Actual Sheet – MTD & YTD numbers
-
Input_Target Sheet – Target values
-
KPI Definition Sheet – KPI logic & classification
You update Excel. Power BI handles analytics automatically.
🛠 How to Use the Pawnshops KPI Dashboard in Power BI
Using the dashboard is simple:
1️⃣ Enter actual MTD & YTD data in Excel.
2️⃣ Enter monthly targets in the Target sheet.
3️⃣ Maintain KPI definitions (LTB/UTB).
4️⃣ Connect Excel to Power BI.
5️⃣ Refresh the dashboard monthly.
Select a month using the slicer.
For example:
If Default Rate (LTB KPI) increases, the red ▼ icon alerts you instantly.
If Loan Recovery Rate improves year-over-year, the green ▲ confirms progress.
If Inventory Turnover slows down, trend charts highlight the pattern.
Because you see both MTD and YTD performance together, short-term control and long-term growth stay aligned.
👥 Who Can Benefit from This Pawnshops KPI Dashboard in Power BI
This dashboard is ideal for:
💼 Pawnshop Owners
🏪 Multi-Branch Pawnshop Chains
📊 Finance Managers
📈 Operations Managers
👨💼 Business Analysts
Whether you manage a single store or multiple branches, this dashboard improves:
✔ Loan portfolio monitoring
✔ Default risk management
✔ Inventory turnover tracking
✔ Profit margin visibility
✔ Customer performance analysis
When performance becomes measurable, improvement becomes predictable.
💰 How This Dashboard Improves Profitability
Profitability in pawnshops depends on risk control and efficient capital rotation.
This dashboard helps you:
-
Reduce default rates
-
Improve loan recovery
-
Optimize inventory turnover
-
Monitor operating cost ratio
-
Track gross and net profit margins
Instead of reacting after financial damage occurs, you prevent issues early.
And prevention protects your margins.
Click hare to read the Detailed blog post
Visit our YouTube channel to learn step-by-step video tutorials