Managing a Fleet Without KPIs? That’s Fueling Hidden Losses 🚛💸
Fleet operations demand precision, cost control, and real-time performance visibility. Vehicles move daily. Fuel prices fluctuate. Maintenance schedules shift. Drivers operate under tight timelines. Yet many fleet managers still rely on scattered spreadsheets and manual reports.
The result?
Rising fuel costs.
Unexpected breakdowns.
Low vehicle utilization.
Shrinking profit margins.
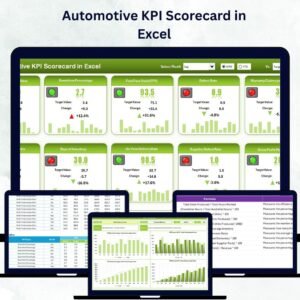
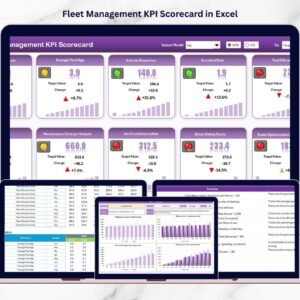
The Fleet Management KPI Scorecard in Excel gives you a structured, ready-to-use performance monitoring system designed to bring clarity and control to your fleet operations.
Instead of guessing performance, you measure it.
Instead of reacting late, you act early.
This powerful Excel-based scorecard helps you track fuel efficiency, vehicle utilization, maintenance performance, driver metrics, and operational expenses — all in one centralized workbook.
Key Feature of Fleet Management KPI Scorecard in Excel 📊
This ready-to-use Excel template includes 4 structured worksheets designed for complete visibility:
✅ Dynamic Month Selection – Analyze specific months instantly.
✅ MTD & YTD Toggle – Switch between Month-to-Date and Year-to-Date views.
✅ Actual vs Target Comparison – Measure goal achievement clearly.
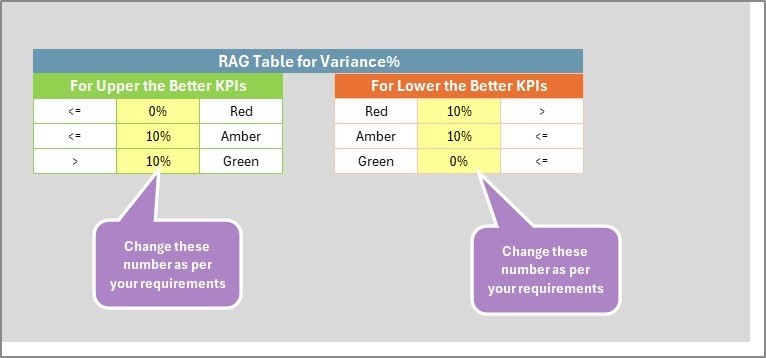
✅ Visual Performance Indicators – Green for strong performance, Red for underperformance.
✅ KPI Trend Analysis – Monitor performance patterns over time.
✅ KPI Classification (LTB / UTB) – Auto-adjust evaluation logic.
✅ Centralized Data Input – Update numbers in one sheet.
✅ Fully Customizable Structure – Add or modify KPIs easily.
Because the template runs inside Excel, you get flexibility without expensive fleet management software.
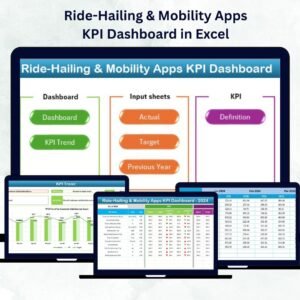
What’s Inside the Fleet Management KPI Scorecard in Excel 📁
You receive a professionally designed Excel file with 4 powerful worksheets:
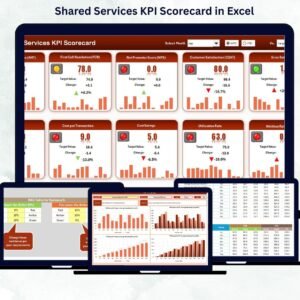
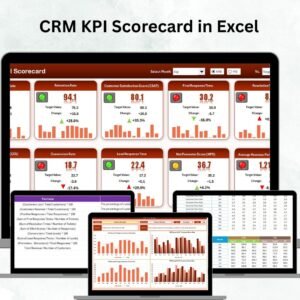
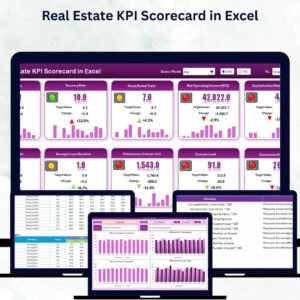
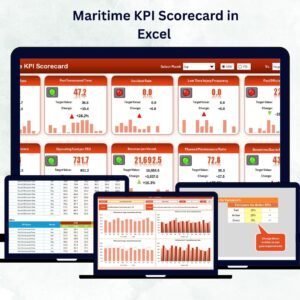
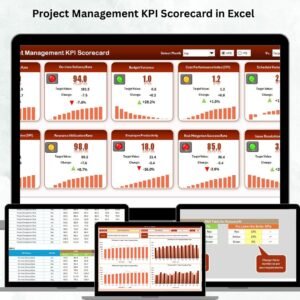
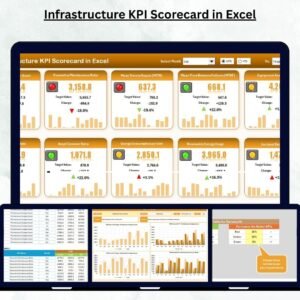
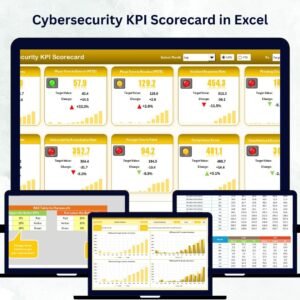
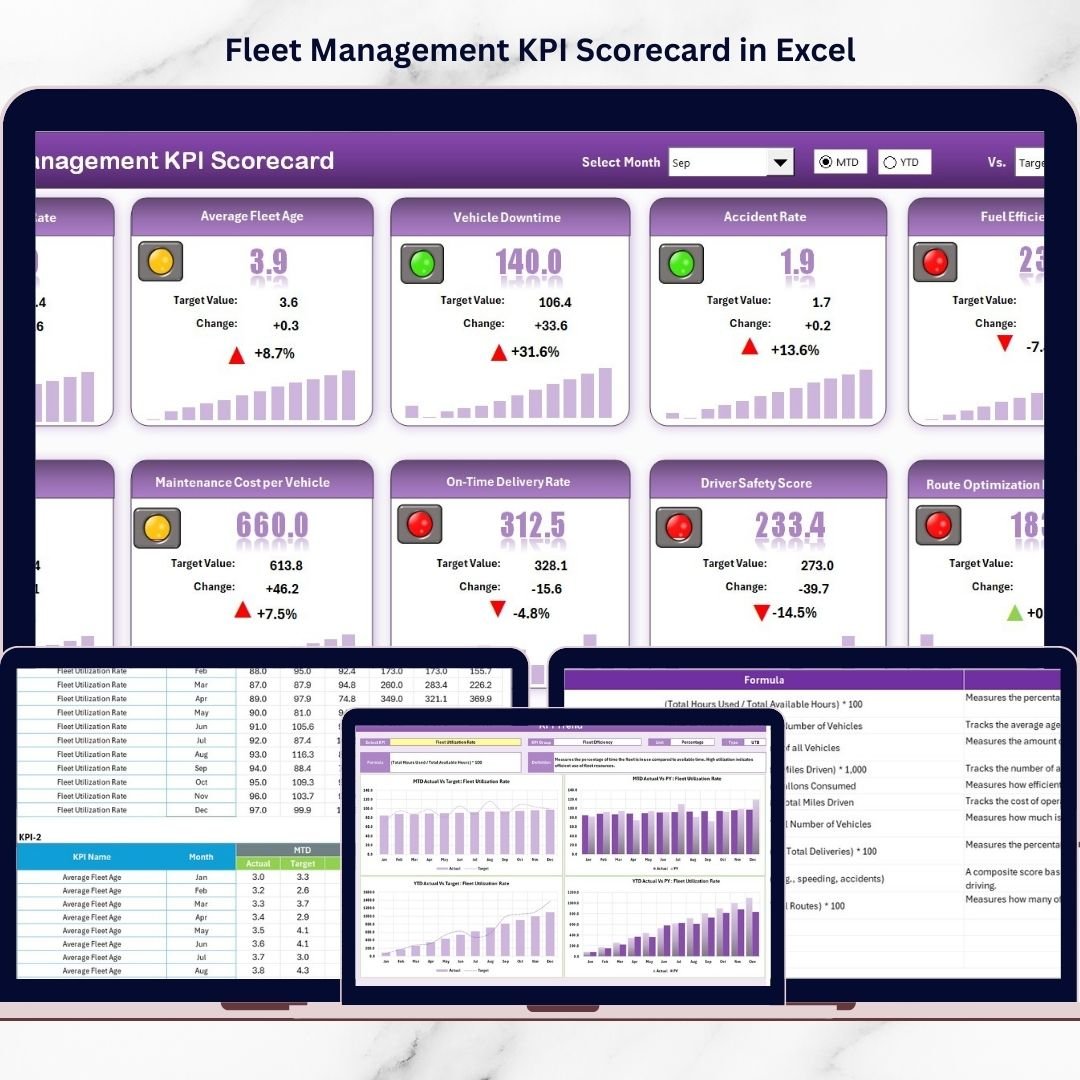
🚛 1️⃣ Scorecard Sheet – Main Performance Dashboard
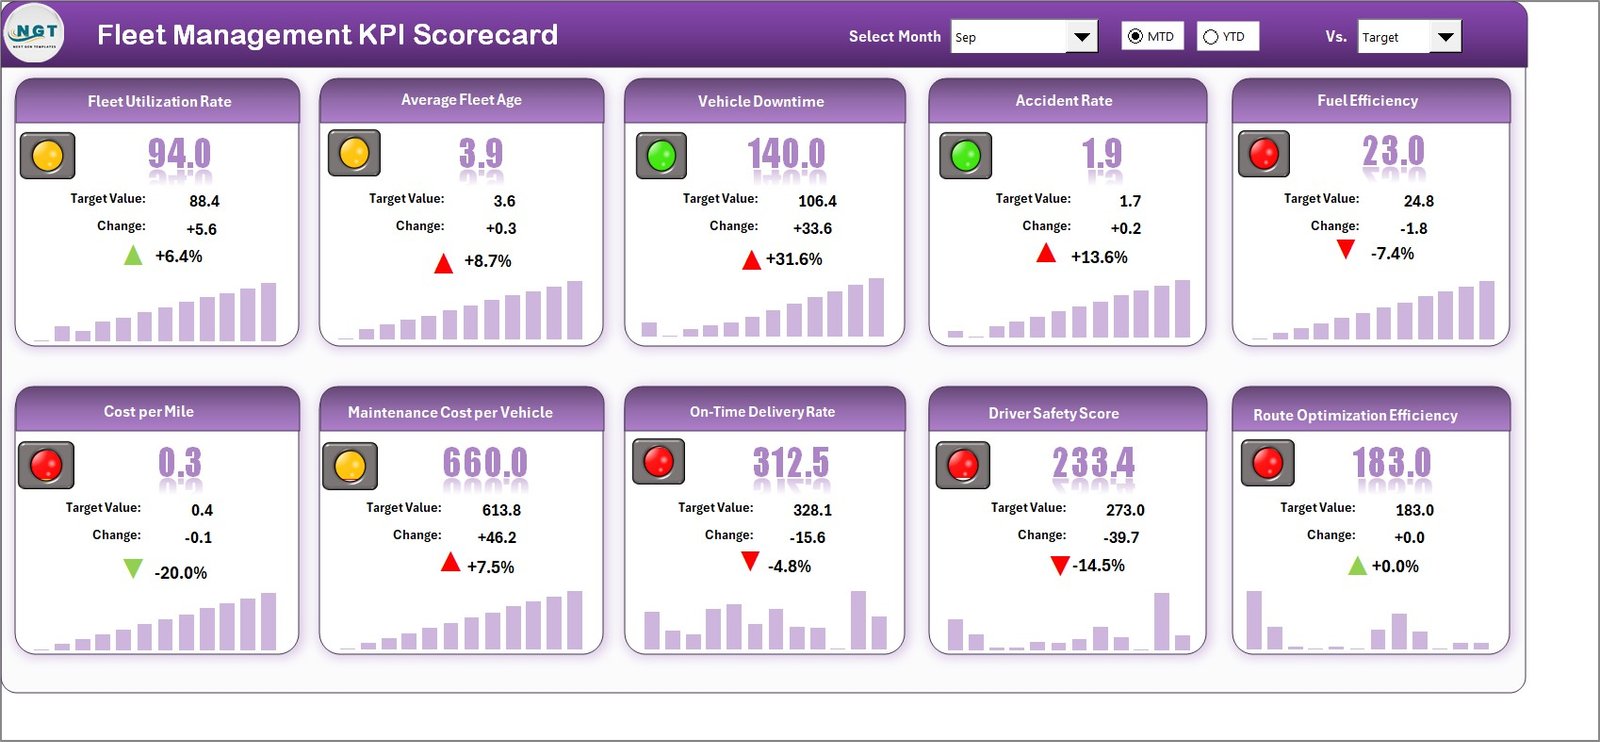
This sheet acts as your fleet control center.
At the top, you can select:
-
Month
-
MTD or YTD view
As soon as you change the selection, the entire scorecard updates automatically.
For each KPI, you can see:
-
Actual Value
-
Target Value
-
Performance Comparison
-
Color-coded status indicators
The sheet also displays:
-
KPI Name
-
KPI Group
-
MTD Performance
-
YTD Performance
Because everything appears in one structured layout, you get instant operational clarity.
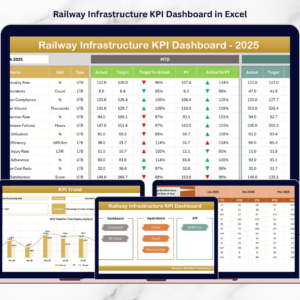
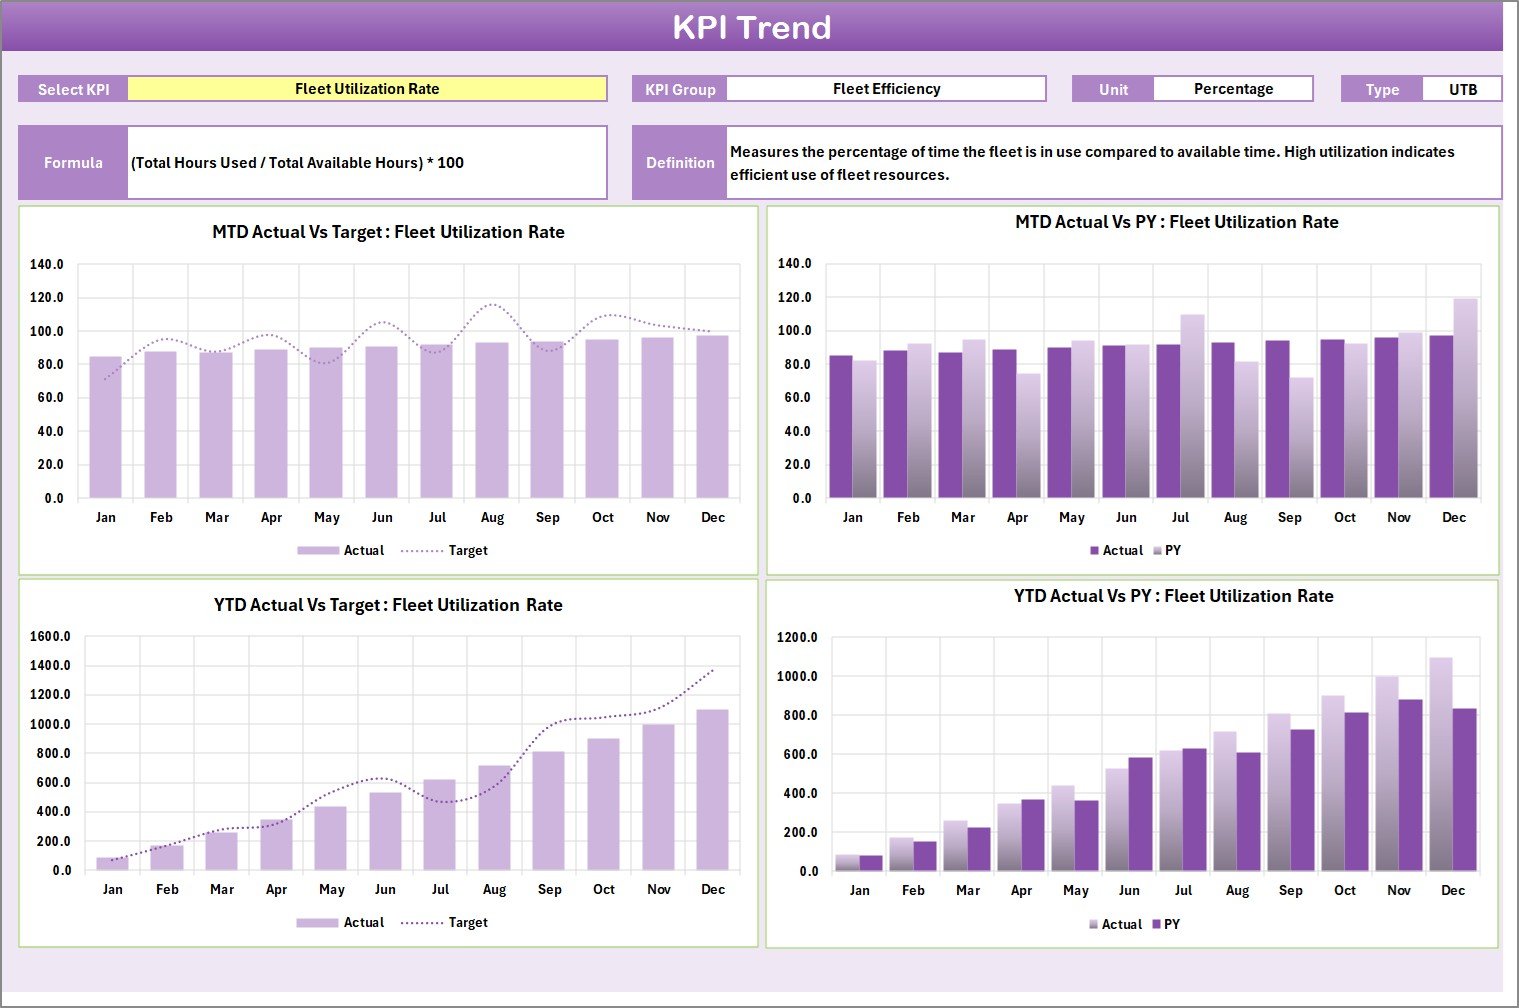
📈 2️⃣ KPI Trend Sheet – Deep Analysis View
Select any KPI from dropdown (Cell C3).
The sheet displays:
-
KPI Group
-
Unit
-
Type (Lower the Better / Upper the Better)
-
Formula
-
KPI Definition
You also get:
-
MTD Trend Chart (Actual, Target, Previous Year)
-
YTD Trend Chart (Actual, Target, Previous Year)
Trend analysis helps you identify long-term patterns, seasonal fuel variations, and maintenance trends.
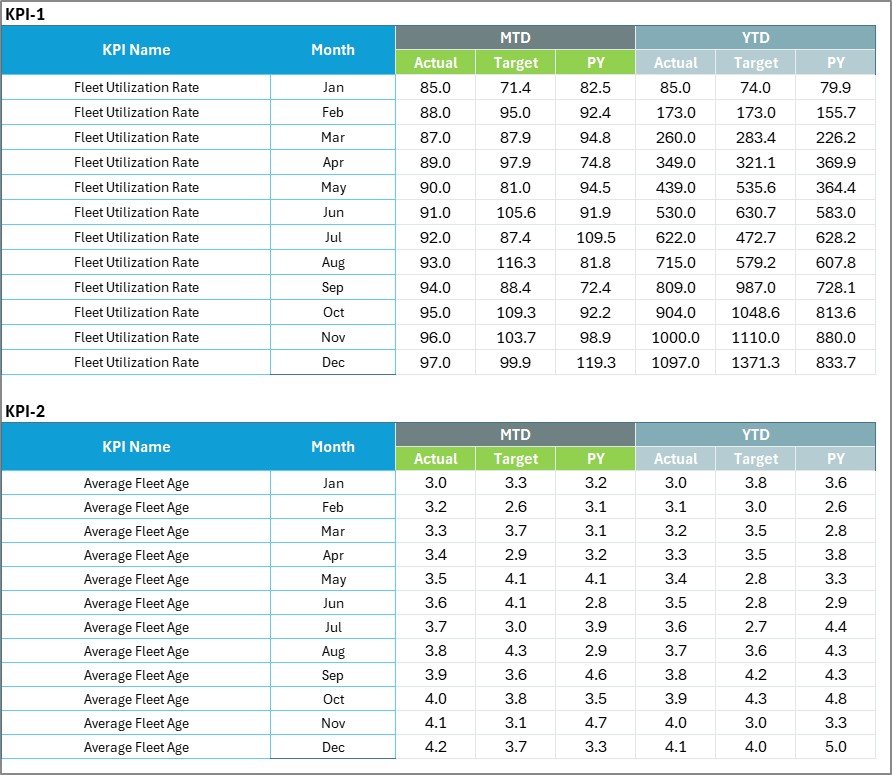
📊 3️⃣ Input Data Sheet – Data Foundation
Enter:
-
Actual KPI values
-
Target KPI values
-
Supporting metrics
The scorecard updates automatically as soon as you refresh data.
This centralized structure eliminates scattered reporting.
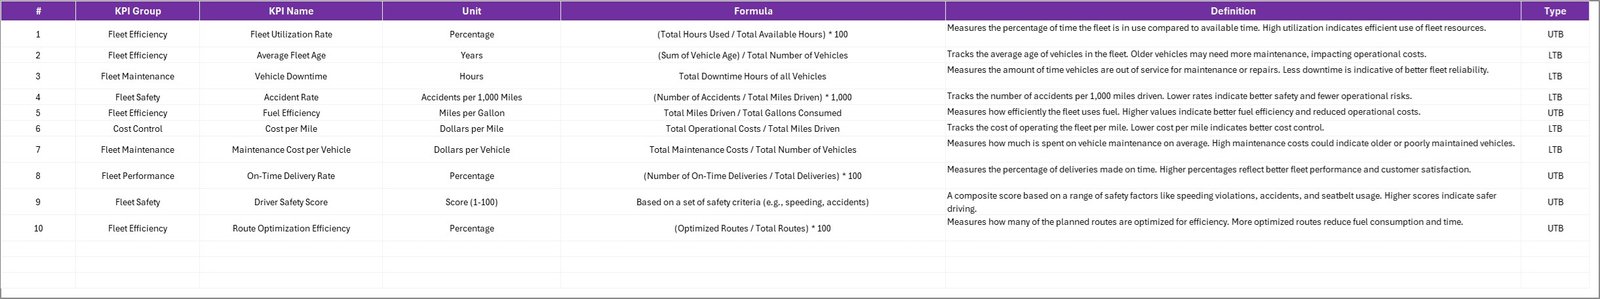
📘 4️⃣ KPI Definition Sheet – KPI Documentation
Document:
-
KPI Name
-
KPI Group
-
Unit
-
Formula
-
KPI Definition
This sheet ensures consistency and transparency across teams.
How to Use the Fleet Management KPI Scorecard in Excel ⚙️
Step 1: Define KPIs
Enter operational, fuel, maintenance, and driver metrics.
Step 2: Set Targets
Define measurable performance goals.
Step 3: Update Data Regularly
Enter weekly or monthly actual values.
Step 4: Select Month & View
Switch between MTD and YTD instantly.
Step 5: Analyze Red Indicators
Focus on underperforming KPIs and take corrective action.
Within minutes, your fleet reporting becomes structured and actionable.
Who Can Benefit from This Fleet Management KPI Scorecard in Excel 👥
This template is ideal for:
✔ Fleet Managers
✔ Logistics Companies
✔ Transportation Businesses
✔ Delivery Service Providers
✔ Operations Managers
✔ Financial Controllers
Whether you manage 10 vehicles or 1,000, this scorecard scales with your operation.
How This Scorecard Improves Fleet Profitability 💰
It helps you:
🔹 Increase fuel efficiency
🔹 Reduce maintenance costs
🔹 Minimize vehicle downtime
🔹 Improve driver performance
🔹 Enhance delivery reliability
🔹 Control operational expenses
Because weak KPIs become visible immediately, corrective action happens faster.
Instead of waiting for quarterly losses, you optimize performance monthly.
If cost control, efficiency, and profitability matter to your fleet — this KPI Scorecard becomes your competitive advantage.
Click here to read the Detailed blog post
Visit our YouTube channel to learn step-by-step video tutorials
👉 Youtube.com/@PKAnExcelExpert