
Customer experience is no longer optional — it is the backbone of business growth. Companies that monitor customer satisfaction, loyalty, and service efficiency consistently outperform competitors. Customer Experience KPI Scorecard in Excel However, many organizations still rely on disconnected spreadsheets, manual calculations, and inconsistent reporting.
What if you could track CSAT, NPS, response time, complaint resolution, and retention rate in one structured, professional system?
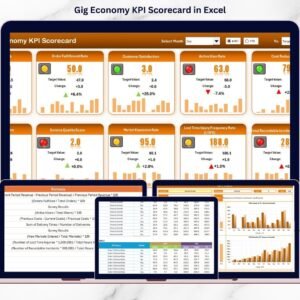
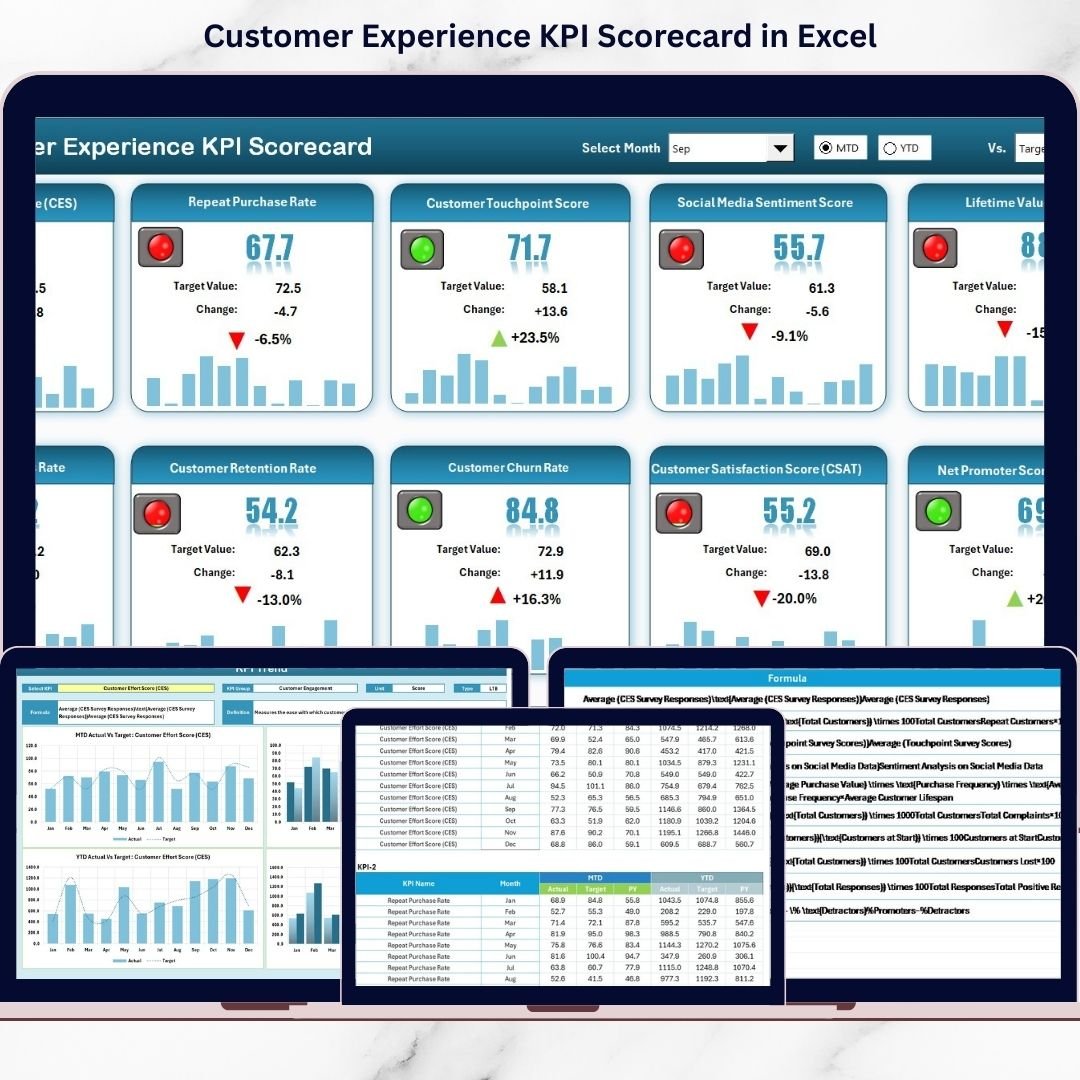
Customer Experience KPI Scorecard in Excel That is exactly what the Customer Experience KPI Scorecard in Excel delivers.
This ready-to-use Excel template helps you measure, monitor, and improve customer performance metrics with clarity and confidence. Whether you are managing a service team, customer support department, or an entire organization, this scorecard turns complex data into actionable insights.
🚀 Key Feature of Customer Experience KPI Scorecard in Excel
This powerful Excel scorecard is designed with simplicity and impact in mind.
✅ Dynamic Scorecard Dashboard
Select the month and switch between MTD (Month-to-Date) and YTD (Year-to-Date) instantly. The entire dashboard updates automatically.
✅ Actual vs Target Comparison
Track KPI performance side by side with target values and variance. Instantly see performance gaps.
✅ Previous Year Comparison
Analyze how current performance compares with historical data to understand progress.
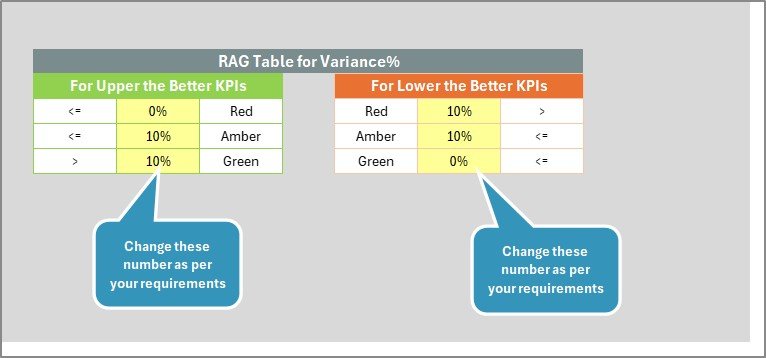
✅ Color-Coded Indicators
Green, Yellow, and Red performance signals highlight strong, moderate, or critical KPIs immediately.
✅ KPI Trend Analysis Sheet
Select any KPI from the dropdown (Cell C3) and view detailed trend charts for Actual, Target, and Previous Year data.
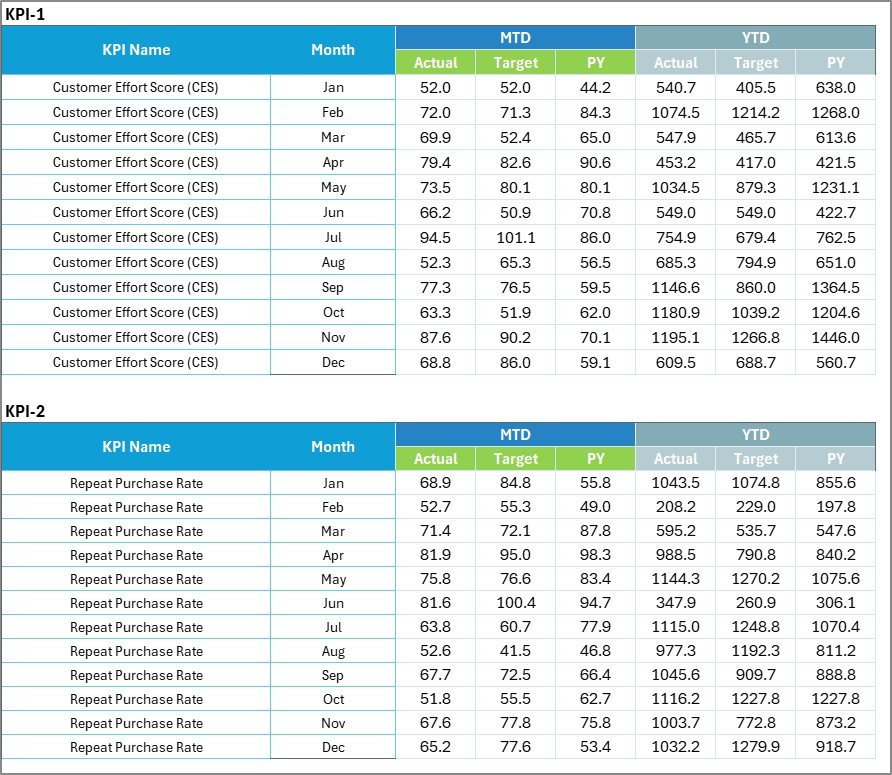
✅ Centralized Input Data Sheet
Easily enter monthly actual and target values in one structured location.
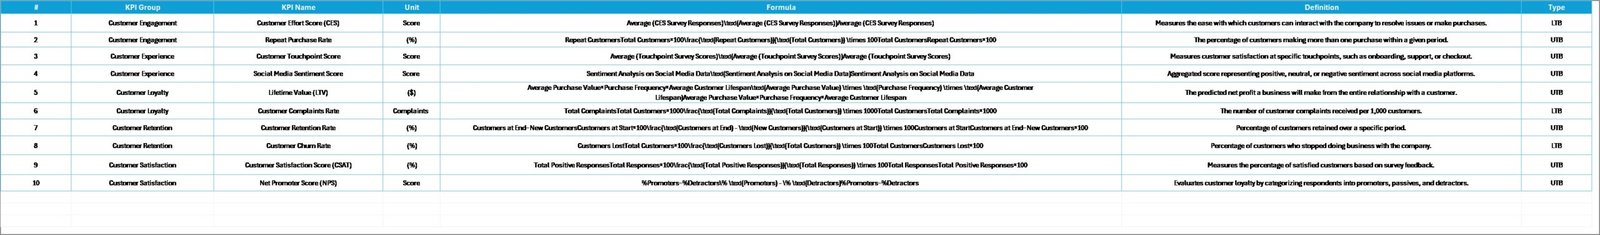
✅ KPI Definition Sheet
Clearly define KPI name, group, unit, formula, and type (Lower the Better / Upper the Better) for full standardization.
📊 What’s Inside the Customer Experience KPI Scorecard in Excel
This template includes 4 professionally structured worksheets:
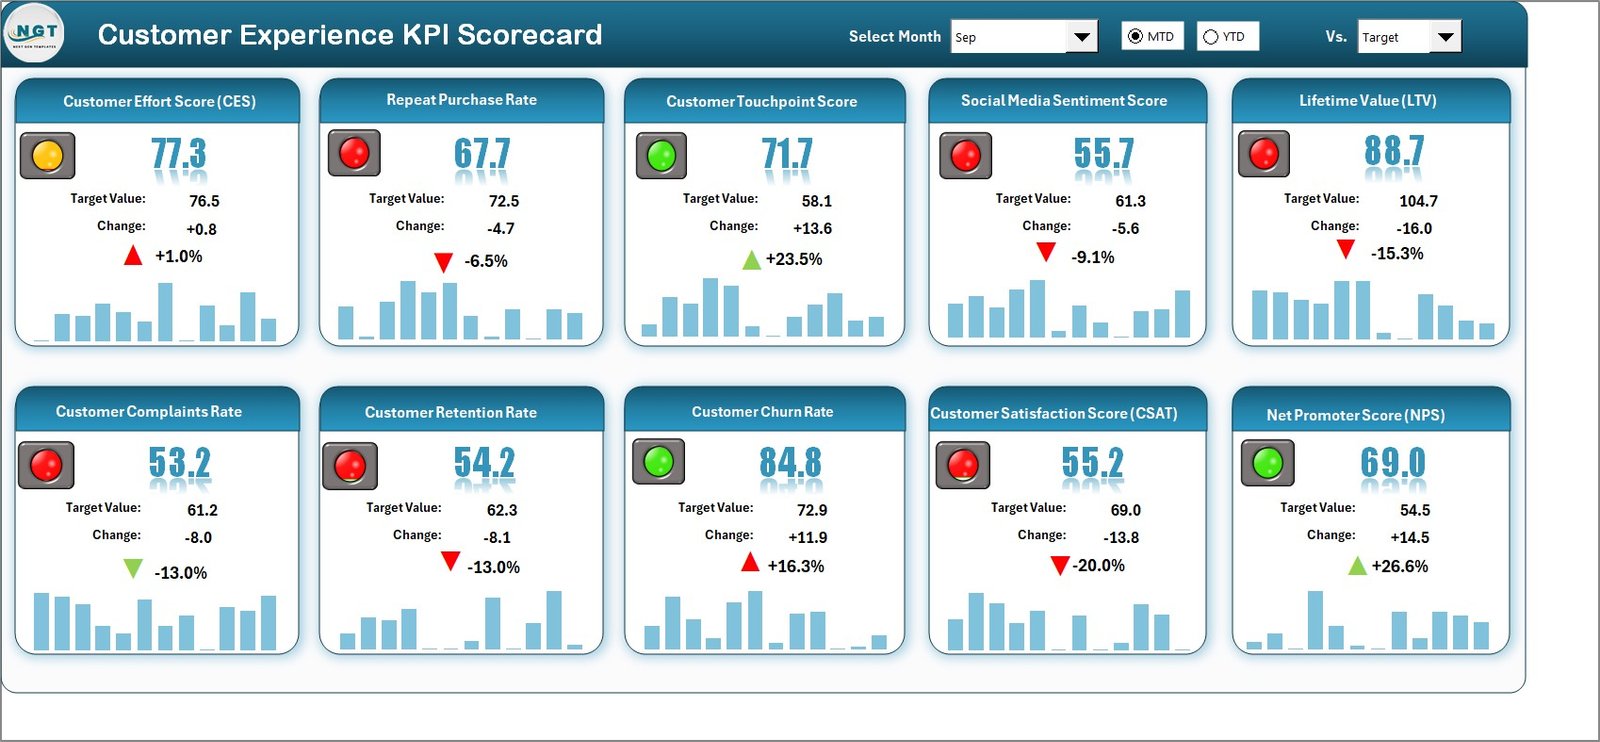
1️⃣ Scorecard Sheet – The main dashboard with MTD, YTD, Target vs Actual, and visual indicators.
2️⃣ KPI Trend Sheet – Deep performance analysis for individual KPIs with trend charts and definitions.
3️⃣ Input Data Sheet – Central data entry area for updating monthly KPI values.
4️⃣ KPI Definition Sheet – Standardized documentation of KPI formulas, definitions, and measurement types.
You can track essential customer experience KPIs such as:
-
Customer Satisfaction Score (CSAT)
-
Net Promoter Score (NPS)
-
First Response Time
-
Average Resolution Time
-
Complaint Resolution Rate
-
Customer Retention Rate
-
Customer Effort Score
-
Churn Rate
Everything is structured for clarity, speed, and decision-making.
⚙️ How to Use the Customer Experience KPI Scorecard in Excel
Using this template is simple and efficient.
Step 1: Enter monthly Actual and Target values in the Input Data Sheet.
Step 2: Define or customize KPIs in the KPI Definition Sheet.
Step 3: Select the month and view performance in the Scorecard Sheet.
Step 4: Use the Trend Sheet to analyze performance direction over time.
Within minutes, you will see:
✔ Performance gaps
✔ Service delays
✔ Improvement areas
✔ Loyalty patterns
No advanced Excel skills are required. Basic knowledge is enough to operate this scorecard effectively.
👥 Who Can Benefit from This Customer Experience KPI Scorecard in Excel
This template is ideal for:
✔ Customer Service Managers
✔ Support Team Leaders
✔ Operations Managers
✔ Business Owners
✔ CX Analysts
✔ Small and Medium Enterprises
✔ Startups tracking customer growth
If your goal is to improve satisfaction, reduce churn, and increase loyalty, this scorecard provides the structure you need.
Because it is Excel-based, it is cost-effective and accessible. You do not need expensive software subscriptions. Moreover, it is fully customizable and scalable.
By using this scorecard consistently, you can:
✔ Reduce response time
✔ Improve resolution efficiency
✔ Increase customer satisfaction
✔ Strengthen retention
✔ Enhance brand reputation
✔ Make data-driven decisions
Stop guessing your customer performance. Start measuring it with clarity.
Click hare to read the Detailed blog post
Visit our YouTube channel to learn step-by-step video tutorials:
👉 https://www.youtube.com/@PKAnExcelExpert