

Ceramic manufacturing demands precision at every stage. From raw material preparation to kiln firing and final inspection, every process must operate efficiently. Ceramic Manufacturing KPI Dashboard in Excel A small delay or quality issue can increase rejection rates, fuel costs, and operational expenses.
Yet many ceramic factories still rely on scattered spreadsheets to monitor production, cost, and financial data. This leads to missed performance gaps, weak comparisons, and poor trend visibility.
Ceramic Manufacturing KPI Dashboard in Excel If you want complete control over production efficiency, cost management, and profitability, you need one structured solution.
Introducing the Ceramic Manufacturing KPI Dashboard in Excel — a powerful, ready-to-use performance monitoring system designed specifically for ceramic production businesses.
This interactive Excel dashboard helps you track production volume, rejection rate, machine utilization, fuel cost, revenue, and profit margin — all in one organized file.
Stop juggling reports. Start making data-driven decisions. 🏭📊
🚀 Key Feature of Ceramic Manufacturing KPI Dashboard in Excel
This dashboard is built to give plant managers and operations teams instant performance visibility.
📊 Interactive Main Dashboard
Monitor all KPIs in one centralized sheet with automatic updates.
📅 Month Selection (Cell D3)
Choose any month from the dropdown, and the entire dashboard refreshes instantly.
📈 MTD & YTD Analysis
Track both Month-to-Date and Year-to-Date performance.
🎯 Actual vs Target vs Previous Year Comparison
Identify performance gaps quickly with side-by-side comparisons.
🚦 Conditional Formatting Indicators
Up and down arrows highlight performance improvement or decline instantly.
📉 KPI Trend Analysis Sheet
Analyze individual KPI trends with dynamic charts.
📝 Separate Input Sheets
Enter Actual, Target, and Previous Year data in dedicated worksheets.
📘 Standardized KPI Definition Sheet
Maintain clear KPI formulas and definitions for consistency.
This is not just a dashboard — it is your manufacturing performance command center.
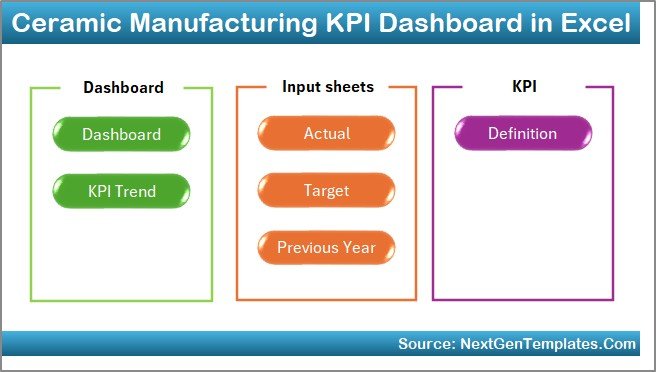
📦 What’s Inside the Ceramic Manufacturing KPI Dashboard in Excel
This ready-to-use Excel file includes 7 structured worksheets:
🏠 1. Home Sheet
Acts as a navigation hub with 6 buttons to access other worksheets quickly.
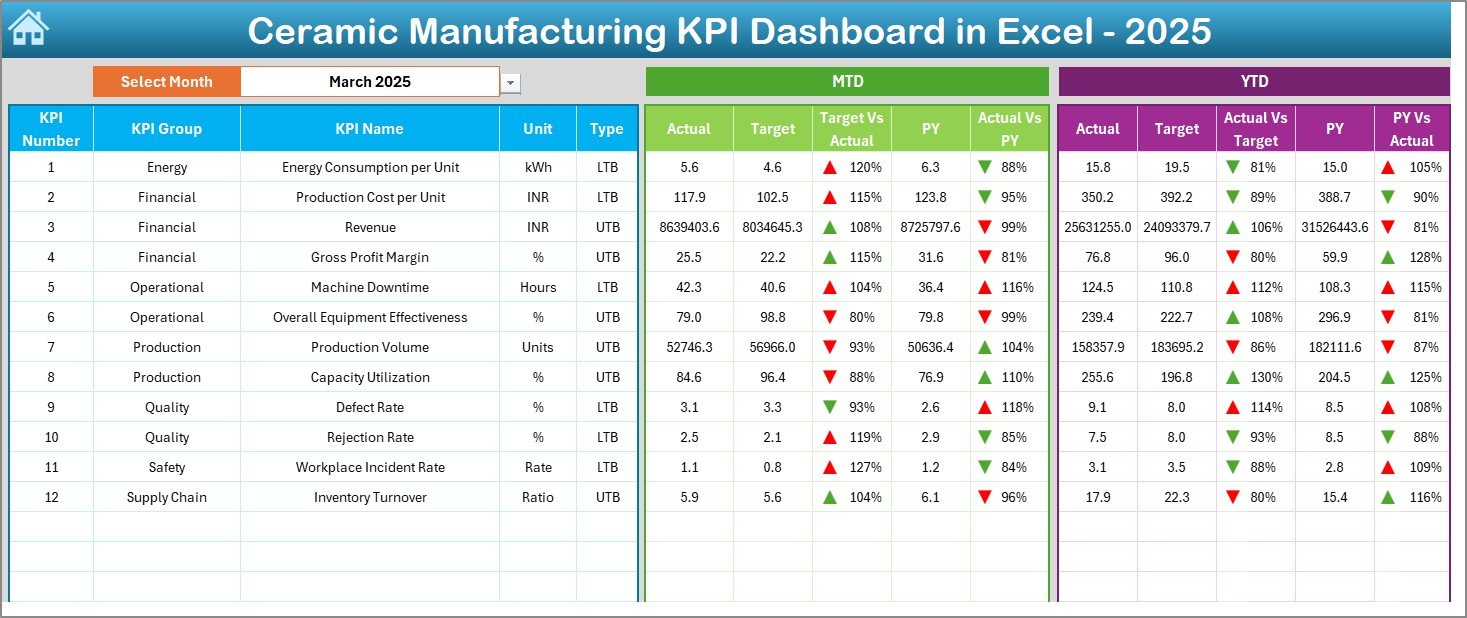
📊 2. Dashboard Sheet
The main performance interface. Displays:
-
MTD Actual, Target, Previous Year
-
YTD Actual, Target, Previous Year
-
Target vs Actual comparison
-
Previous Year vs Actual comparison
All values update automatically when you change the month in D3.
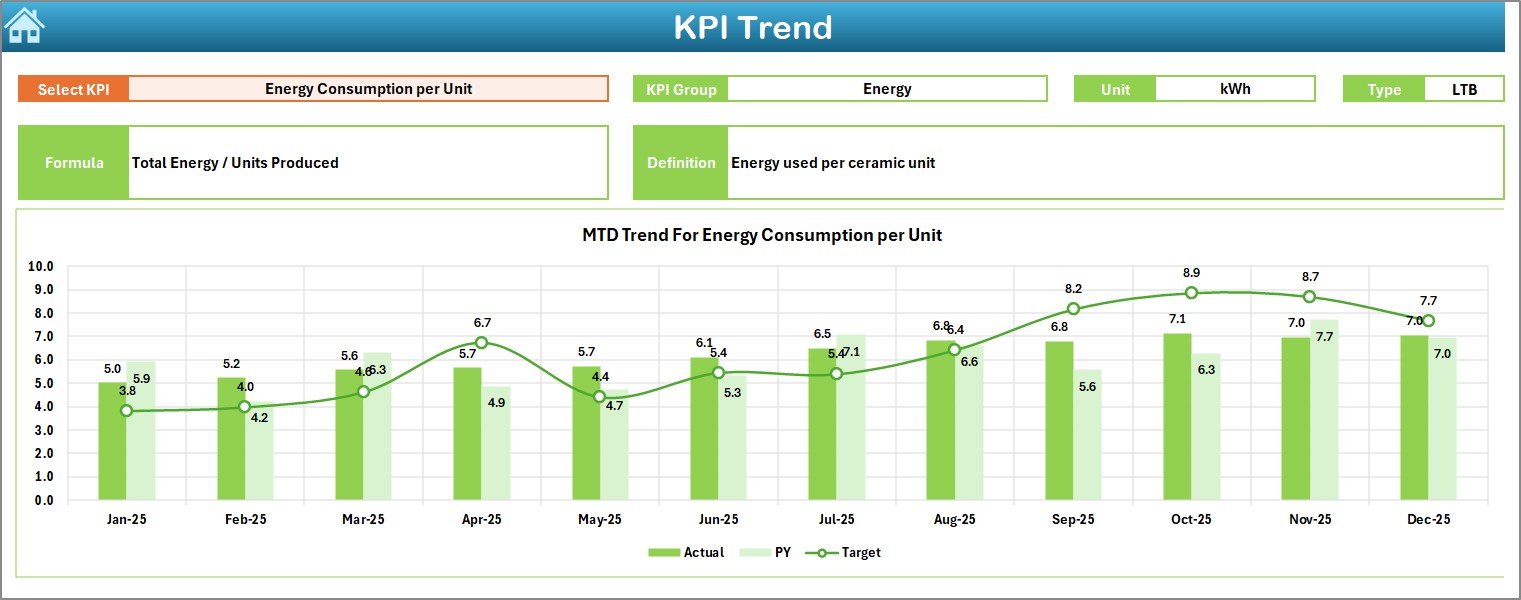
📈 3. KPI Trend Sheet
Select any KPI from the dropdown in Cell C3. View KPI group, unit, type (LTB/UTB), formula, and definition along with dynamic MTD & YTD charts.
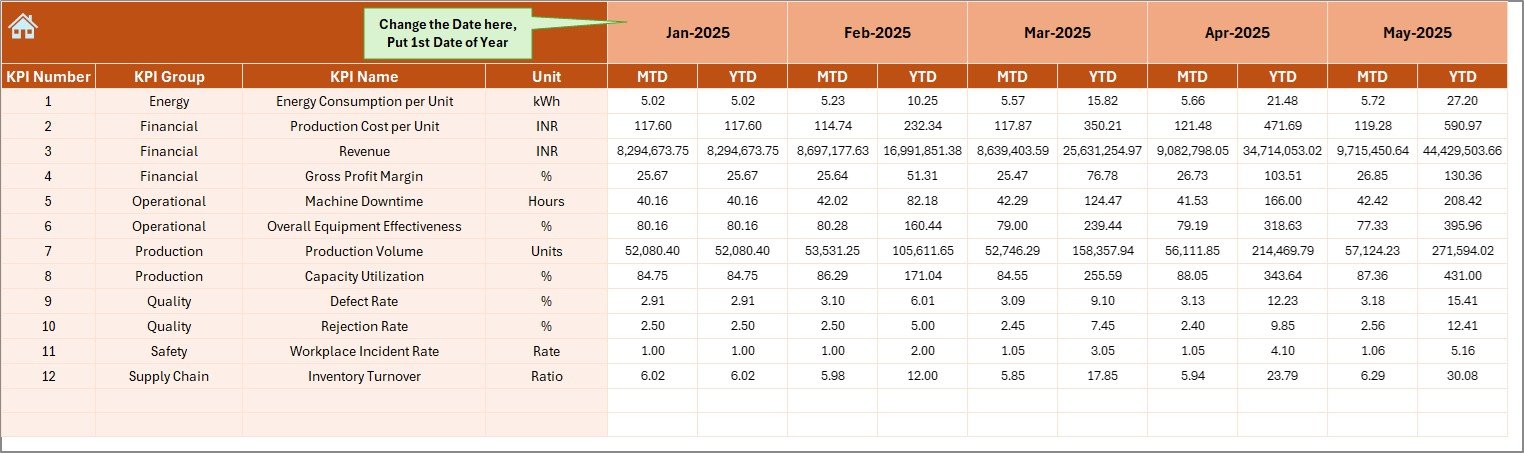
📝 4. Actual Numbers Input Sheet
Enter monthly MTD and YTD actual data. The dashboard updates automatically.
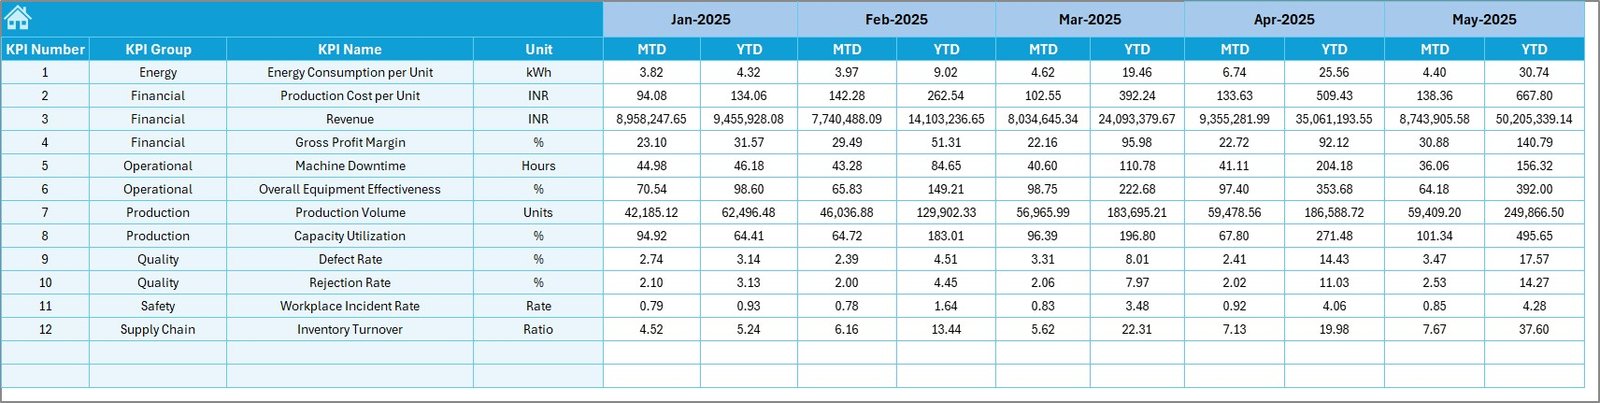
🎯 5. Target Sheet
Input monthly and yearly target values to compare planned vs actual performance.
📅 6. Previous Year Numbers Sheet
Store last year’s data for year-over-year comparison.
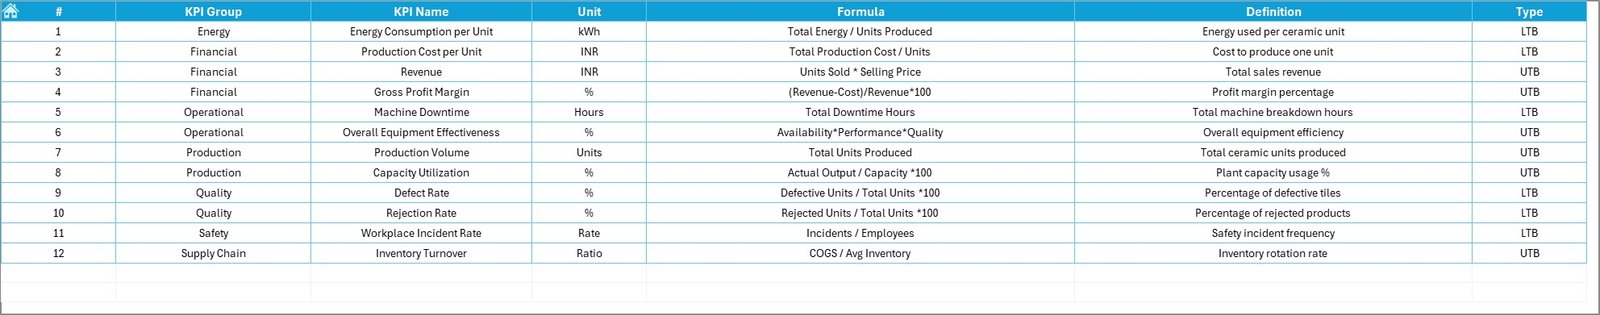
📘 7. KPI Definition Sheet
Standardize KPI name, group, unit, formula, and explanation.
Everything is structured. Everything is automated. Everything is measurable.
⚙️ How to Use the Ceramic Manufacturing KPI Dashboard in Excel
Using this dashboard is simple:
1️⃣ Enter Actual numbers in the Actual Sheet.
2️⃣ Enter monthly targets in the Target Sheet.
3️⃣ Input previous year data for comparison.
4️⃣ Select the desired month in Cell D3 on the Dashboard.
5️⃣ Review MTD and YTD performance insights.
6️⃣ Analyze detailed trends in the KPI Trend Sheet.
No advanced Excel skills required. Basic knowledge is enough.
You can monitor:
-
Total Production Volume
-
Production Efficiency
-
Machine Utilization Rate
-
Downtime Percentage
-
Rejection Rate
-
Fuel Cost per Unit
-
Revenue
-
Gross Profit Margin
-
Inventory Turnover
Make faster decisions. Reduce waste. Increase profitability.
🏭 Who Can Benefit from This Ceramic Manufacturing KPI Dashboard in Excel
This dashboard is ideal for:
🏢 Ceramic Tile Manufacturers
🏭 Sanitary Ware Manufacturers
🏺 Pottery & Ceramic Product Factories
📊 Plant Managers
🛠️ Production Supervisors
💼 Operations & Finance Teams
📈 Business Owners
Whether you operate a small unit or a large ceramic production facility, this dashboard scales with your business needs.
Ceramic manufacturing requires continuous monitoring. Without structured tracking, inefficiencies grow silently.
When you use this KPI dashboard consistently, you:
✔ Reduce rejection rates
✔ Improve kiln efficiency
✔ Control fuel consumption
✔ Monitor cost per unit
✔ Strengthen quality control
✔ Improve profit margins
Instead of reacting to problems, you proactively manage performance.
If you want to improve productivity, control operational costs, and build a competitive ceramic manufacturing business, this Ceramic Manufacturing KPI Dashboard in Excel is your practical solution.
Click hare to read the Detailed blog post
Visit our YouTube channel to learn step-by-step video tutorials
👉 https://www.youtube.com/@PKAnExcelExpert


