Are you still managing your sporting goods business with scattered spreadsheets and manual reports? Stop guessing. Start tracking.
The Sporting Goods KPI Dashboard in Excel is your complete performance control system designed specifically for sporting goods retailers, wholesalers, and manufacturers. Whether you sell cricket gear, gym equipment, football kits, or seasonal sports products, this dashboard helps you track everything in one structured and automated Excel file.
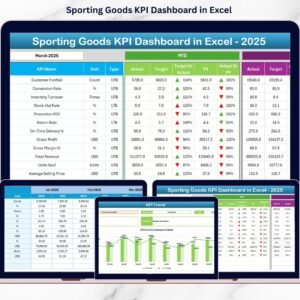
This ready-to-use dashboard allows you to monitor Sales, Profitability, Inventory, Customer Metrics, and Operational Performance with MTD (Month-To-Date) and YTD (Year-To-Date) comparisons — all without using any external software.
If you want clarity, control, and smarter decision-making, this dashboard is built for you.
🚀 Key Features of Sporting Goods KPI Dashboard in Excel
📊 7 Structured Worksheets for complete performance management
📅 Month Selection Drop-Down (Cell D3) for instant monthly analysis
📈 MTD & YTD Tracking with Actual vs Target vs Previous Year comparison
🔺 Conditional Formatting Arrows for quick performance signals
📉 Trend Analysis Sheet with dynamic KPI selection (Cell C3)
🎯 Separate Sheets for Actual Data, Target Data, and Previous Year Data
📘 KPI Definition Sheet with formula, unit, and KPI type clarity
🔄 Fully customizable and scalable structure
Every worksheet has a defined purpose. The Summary Page allows easy navigation. The Dashboard Sheet gives a complete overview. The Trend Sheet shows KPI growth patterns. Input sheets keep your data structured and clean.
This is not just a dashboard. It is a performance engine.

📦 What’s Inside the Sporting Goods KPI Dashboard in Excel
When you purchase this product, you get:
✅ Ready-to-use Excel dashboard file
✅ Pre-designed KPI structure for sporting goods industry
✅ Automated calculations for MTD & YTD
✅ Target vs Actual vs Previous Year comparison
✅ Built-in conditional formatting indicators
✅ Organized input sheets for data entry
✅ Clear KPI definitions to avoid confusion
You can track important KPIs like:
Total Sales Revenue
Gross Profit Margin (%)
Inventory Turnover Ratio
Stock Holding Days
Customer Retention Rate (%)
Average Order Value
Order Fulfillment Time
Return Rate (%)
Everything is structured to help you monitor sales spikes during tournaments, track seasonal demand shifts, and manage inventory efficiently.
🛠️ How to Use the Sporting Goods KPI Dashboard in Excel
Using this dashboard is simple and practical.
1️⃣ Enter your starting month in the Actual Input Sheet.
2️⃣ Update MTD and YTD actual values monthly.
3️⃣ Enter target values in the Target Sheet.
4️⃣ Fill previous year data for year-over-year comparison.
5️⃣ Select any month from cell D3 in the Dashboard sheet.
Once selected, all numbers, charts, and indicators update automatically.
Green arrows indicate growth. Red arrows indicate performance decline. You instantly know where action is needed.
No advanced Excel knowledge required. Basic understanding is enough.
👥 Who Can Benefit from This Sporting Goods KPI Dashboard?
This dashboard is ideal for:
🏬 Sporting Goods Retailers
🏭 Sporting Goods Manufacturers
📦 Distributors & Wholesalers
🏢 Multi-store Business Owners
📊 Business Analysts & Managers
📈 Sales & Operations Teams
Whether you run a small local sports shop or manage a large distribution network, this dashboard provides structured visibility.
Retailers can monitor category-wise sales and seasonal demand.
Manufacturers can track supplier performance and production efficiency.
Managers can compare targets and adjust strategies quickly.
It supports better inventory planning, marketing decisions, and profitability control.
The Sporting Goods KPI Dashboard in Excel gives you:
✔ Organized reporting
✔ Faster analysis
✔ Clear performance comparison
✔ Strategic growth insights
If you want to increase profitability, control inventory, and make faster business decisions, this is the tool you need.
Click here to read the Detailed Blog Post
Watch the step-by-step video tutorial:
Visit our YouTube channel to learn step-by-step video tutorials
Compatibility and Requirements
- Works in Microsoft Excel desktop (Excel 2016 or later, or Microsoft 365).
- Green and red arrows on the Dashboard sheet come from conditional formatting. Microsoft explains it in Use conditional formatting to highlight information in Excel.
Frequently Asked Questions
How many worksheets does the dashboard have?
Seven worksheets, including a Summary page for navigation, the Dashboard sheet, a Trend sheet, separate input sheets for Actual, Target and Previous Year data, and a KPI Definition sheet.
How do I change the month shown on the dashboard?
Select a month from the drop-down in cell D3 on the Dashboard sheet. The numbers, charts and indicators update automatically.
Can I compare results with targets and last year?
Yes. The dashboard shows MTD and YTD results as Actual vs Target vs Previous Year. Enter your targets in the Target sheet and last year’s figures in the Previous Year sheet.
How do I see the trend of a single KPI?
Open the Trend sheet and choose the KPI in cell C3. It shows how that KPI has moved over time.
Is there a Power BI version?
Yes. See the Sporting Goods KPI Dashboard in Power BI.
Related KPI Dashboard Templates
- Sporting Goods KPI Dashboard in Power BI: the same KPIs in Power BI
- Sporting Goods Dashboard in Power BI: another Power BI dashboard for sporting goods
- Luxury Goods KPI Dashboard in Excel: a retail KPI dashboard in Excel
- Luxury Goods Dashboard in Excel: a retail dashboard in Excel
- KPI Dashboard Library (Excel): 15 KPI dashboards in one download
Browse all Excel KPI dashboards.