The media and entertainment industry runs on performance, speed, and audience engagement 🎥. Whether you manage television networks, OTT platforms, film production houses, digital media channels, or advertising revenue, tracking the right KPIs is critical for success. However, when teams rely on manual reports or disconnected spreadsheets, performance visibility drops, insights arrive late, and decision-making slows down. That is exactly why a Media & Entertainment KPI Scorecard in Google Sheets becomes an essential performance management tool.
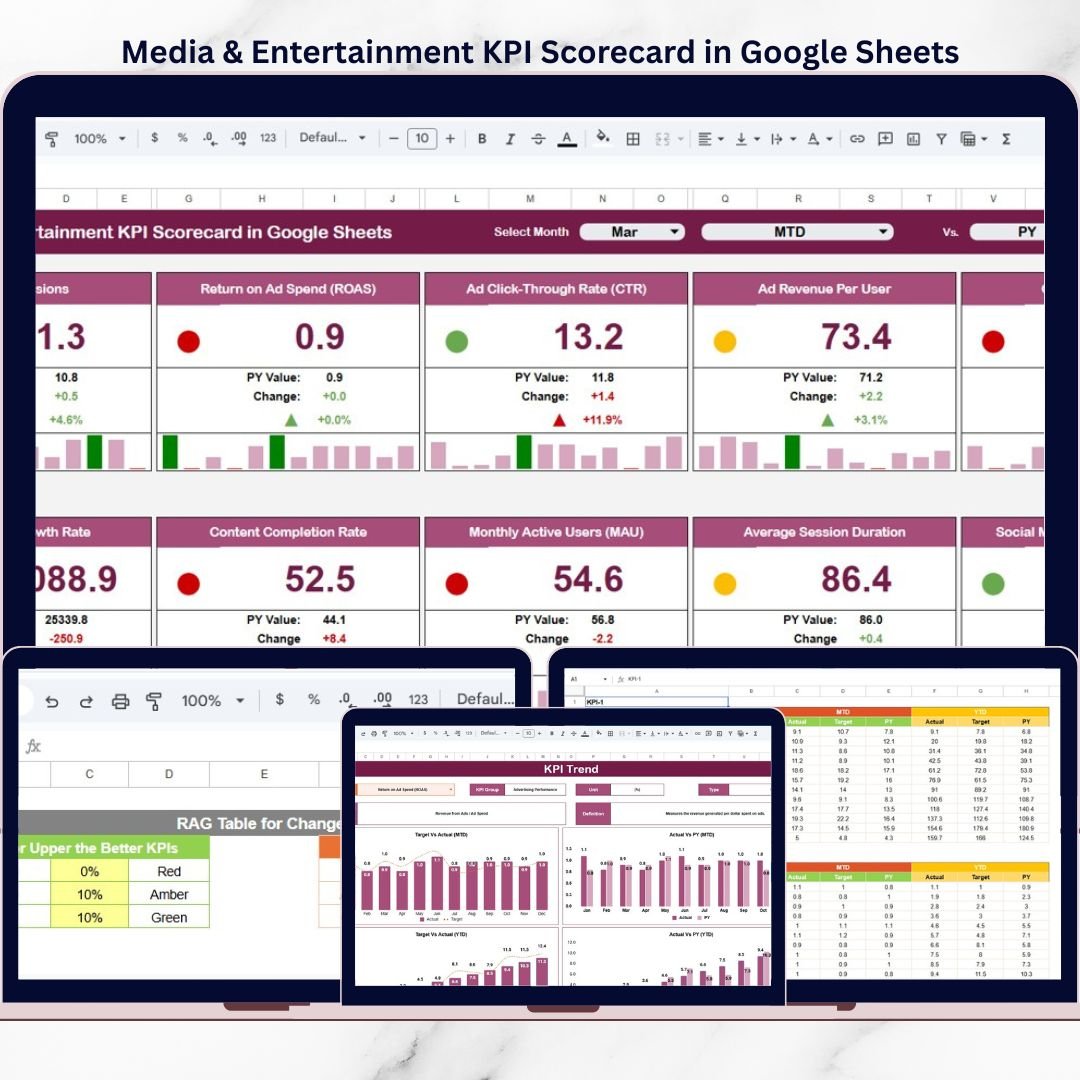
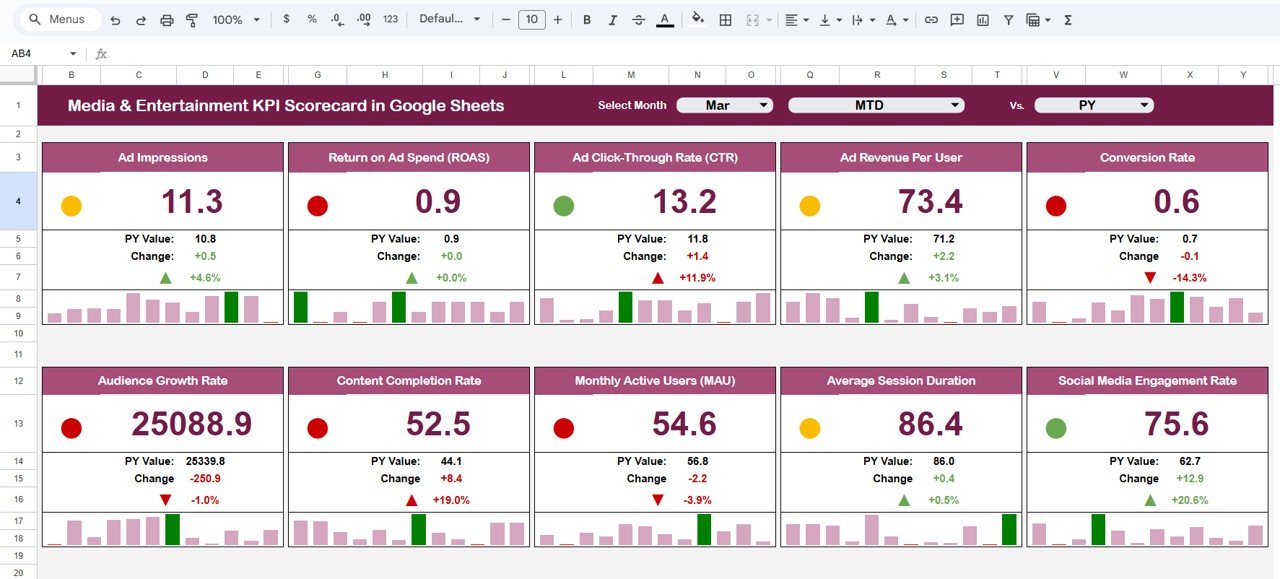
The Media & Entertainment KPI Scorecard in Google Sheets is a ready-to-use, interactive, and visual scorecard designed to monitor key performance indicators across media operations. Instead of switching between multiple tools, teams use one centralized Google Sheets scorecard to track monthly (MTD) and yearly (YTD) performance, identify improvement or decline instantly, and support management reporting 📊.
Because the scorecard is built in Google Sheets, it combines simplicity, automation, and real-time collaboration, making it ideal for fast-moving media environments. As a result, organizations move from reactive reporting to proactive performance management.
✅ Key Features of Media & Entertainment KPI Scorecard in Google Sheets
The Media & Entertainment KPI Scorecard in Google Sheets is designed to provide instant performance clarity 🔍.
It tracks 10 key KPIs using dynamic calculations, traffic lights, and up/down arrows. Users select the month, and the entire scorecard updates automatically.
Key highlights include:
-
Monthly (MTD) and Yearly (YTD) KPI tracking
-
Traffic light indicators for quick status checks
-
Up and down arrows showing percentage movement
-
KPI-level trend analysis
-
Centralized KPI definitions and logic
Because all calculations run automatically, teams reduce manual effort and focus on insights and decisions.
📦 What’s Inside the Media & Entertainment KPI Scorecard in Google Sheets
This product includes multiple well-structured Google Sheets worksheets, each serving a specific role in performance tracking:
1️⃣ Main KPI Scorecard Sheet
This is the core performance view 🧭.
It includes:
-
Month drop-down selection at the top
-
Default monthly scorecard view
-
Dynamic KPI values
-
Traffic light indicators based on KPI logic
-
Up/down arrows showing KPI movement
As soon as users select a month, all KPI values, colors, and arrows update automatically.
2️⃣ MTD and YTD Switch
The scorecard allows users to toggle between MTD and YTD views.
This helps:
-
Review short-term monthly performance
-
Analyze long-term yearly trends
-
Compare operational vs strategic results
Because both views are available in one scorecard, management reviews become more effective.
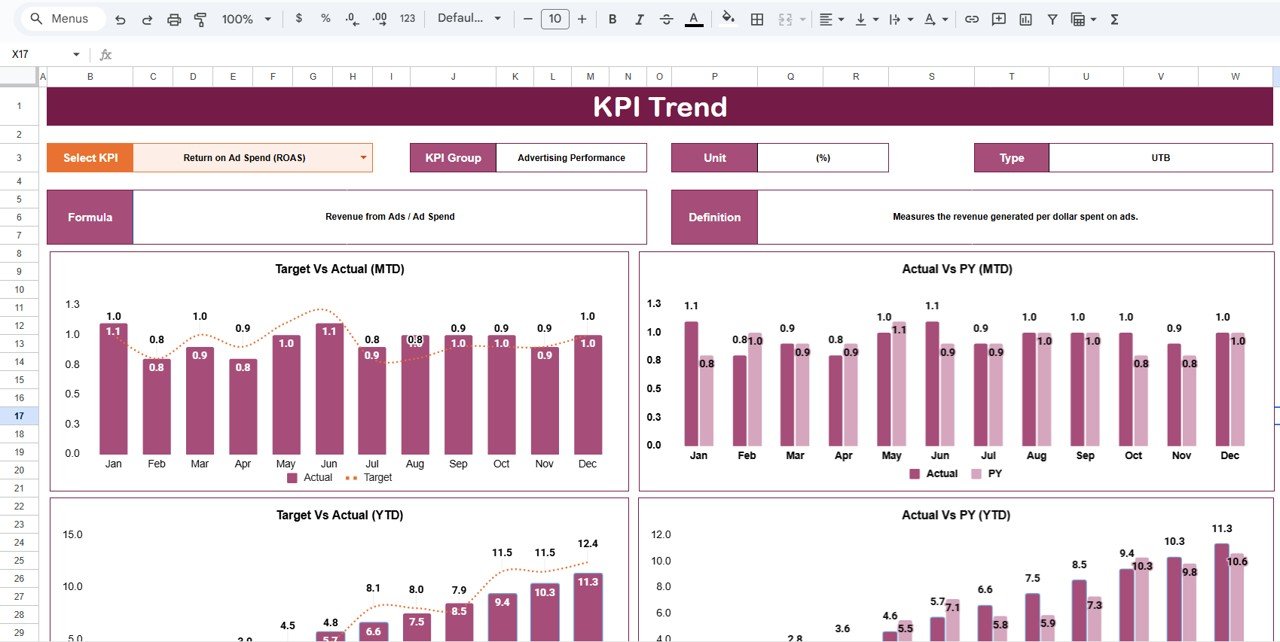
3️⃣ KPI Trend Sheet
The KPI Trend Sheet supports deeper KPI analysis 📈.
Key features include:
-
KPI selection drop-down in cell C3
-
Display of KPI Group
-
Display of KPI Unit
-
KPI Type (Lower the Better / Upper the Better)
This sheet helps teams understand how each KPI behaves over time before taking action.
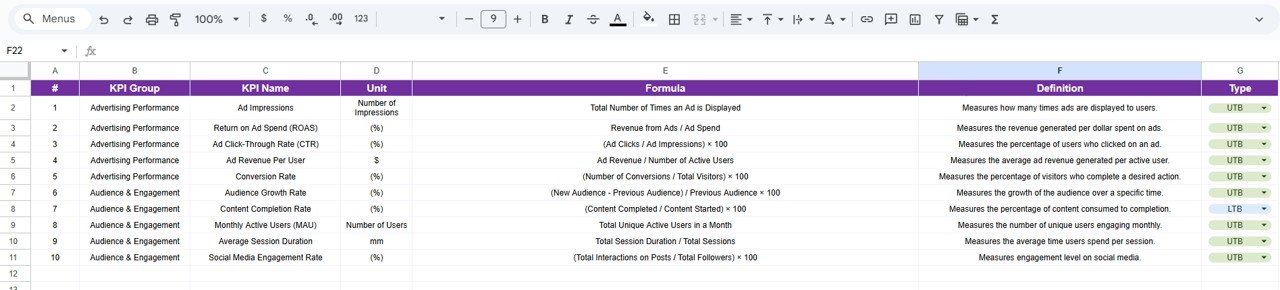
4️⃣ KPI Definition Sheet
The KPI Definition Sheet ensures clarity and transparency.
It stores:
-
KPI Name
-
KPI Group
-
Unit of Measurement
-
Formula to aggregate KPI
-
KPI Definition
Because KPI logic is documented, the scorecard remains easy to understand and audit-friendly.
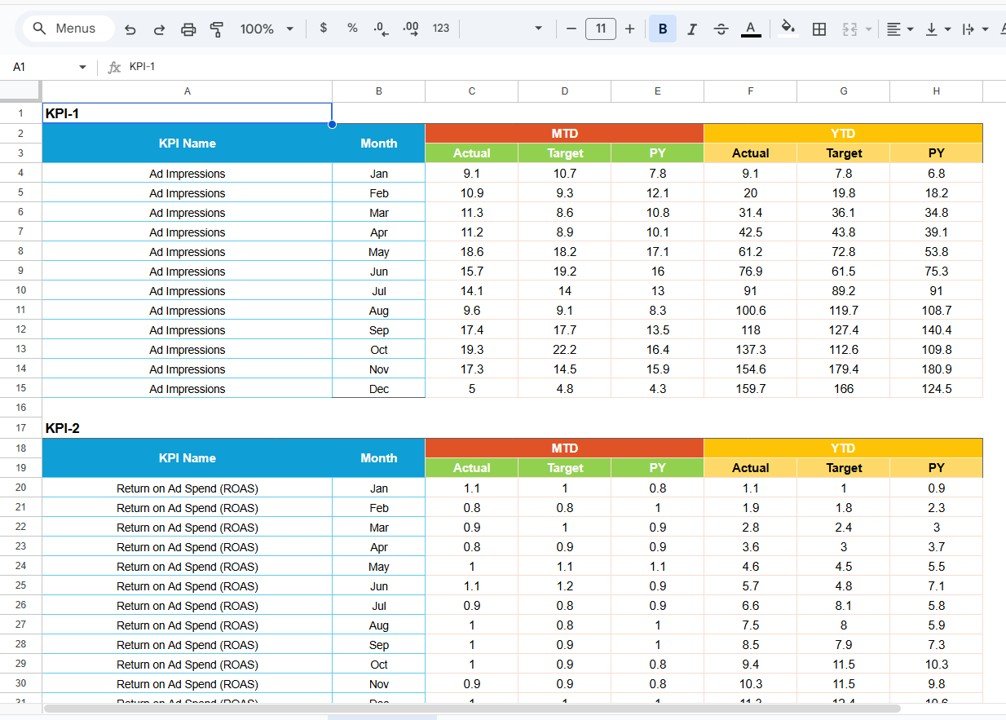
5️⃣ Data Input Sheet
This sheet captures raw KPI data.
Users:
-
Enter KPI values by month
-
Maintain a clean, structured data table
All scorecard calculations depend on this sheet, ensuring consistency and accuracy.
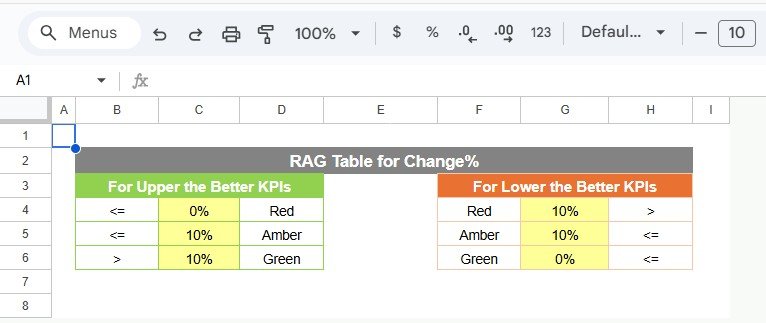
6️⃣ Colour Settings Sheet
The Colour Settings sheet controls visual logic 🎨.
It allows users to:
-
Define traffic light colors
-
Control arrow logic
-
Align colors with KPI Type (LTB or UTB)
As a result, KPI status becomes visually clear at a glance.
🛠️ How to Use the Media & Entertainment KPI Scorecard in Google Sheets
Using the scorecard is simple and intuitive 👍.
First, update KPI values in the Data Input Sheet.
Next, select the required month in the scorecard.
Then, switch between MTD and YTD views as needed.
Finally, review traffic lights, arrows, and trends to assess performance.
Because everything updates automatically, teams get real-time insights without manual calculations.
👥 Who Can Benefit from This Media & Entertainment KPI Scorecard
This scorecard is ideal for:
-
Media Operations Teams
-
Content & Programming Managers
-
Finance and Revenue Teams
-
Strategy and Planning Teams
-
Senior Management
It works perfectly for TV networks, OTT platforms, digital media companies, film studios, and advertising-driven businesses.
🔗 Click here to read the Detailed blog post
Watch the step-by-step video tutorial:


