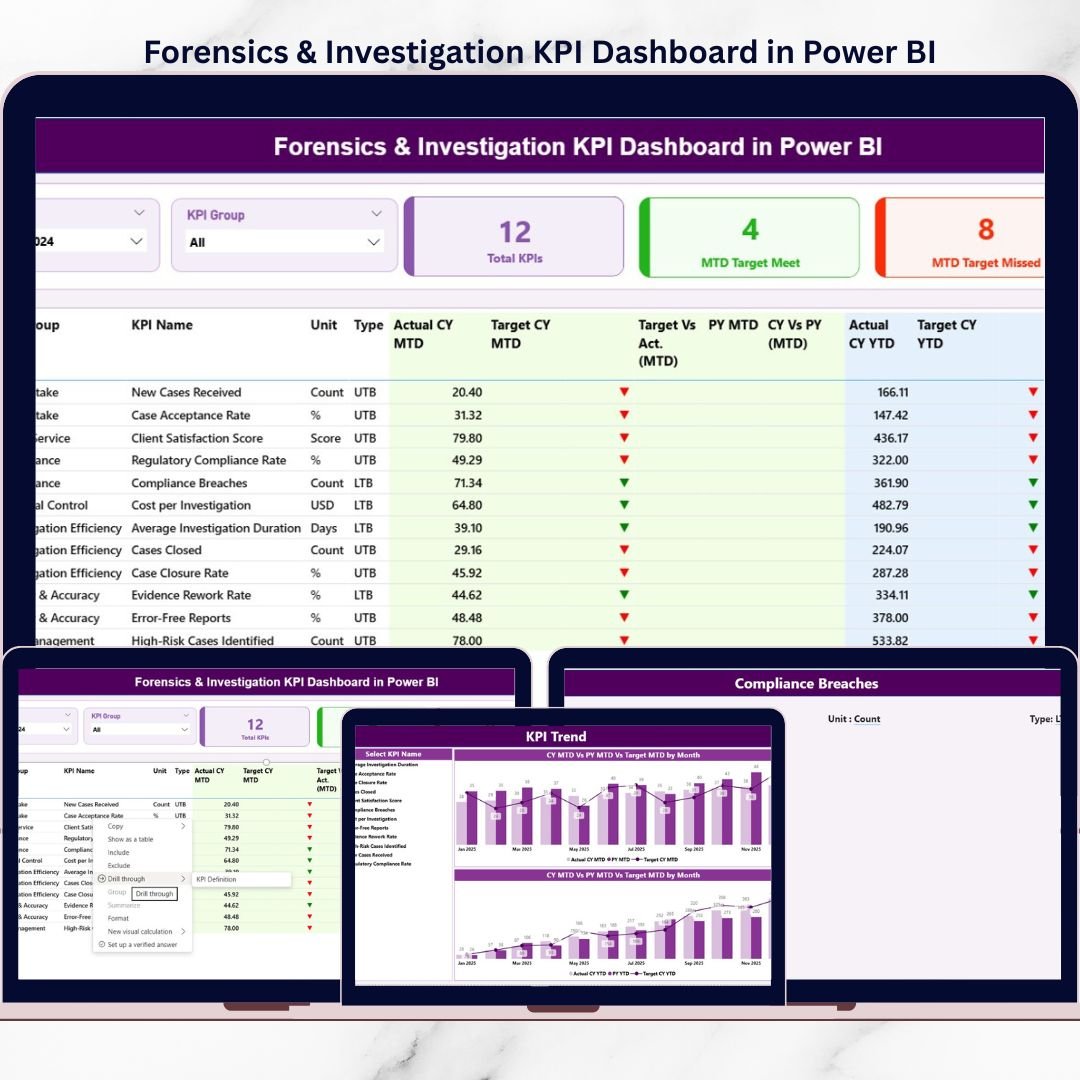
Managing forensic and investigation activities without structured performance tracking leads to delays, blind spots, and compliance risks. That is exactly where the Forensics & Investigation KPI Dashboard in Power BI becomes a game-changer. This professionally designed dashboard helps organizations monitor investigation performance, track targets, and analyze trends—all from a single interactive Power BI report.
Built for forensic teams, audit departments, legal professionals, and compliance officers, this dashboard converts raw investigation data into clear, actionable insights. Instead of working with scattered Excel sheets or static reports, teams gain real-time visibility into critical KPIs, enabling faster decisions and stronger accountability.
This ready-to-use Power BI solution is designed for clarity, speed, and accuracy. It supports Month-to-Date (MTD), Year-to-Date (YTD), target vs actual comparisons, previous year analysis, and trend monitoring—making it an essential analytics tool for investigation-driven environments.
🚀 Key Features of the Forensics & Investigation KPI Dashboard
📊 Interactive KPI Tracking – Monitor investigation KPIs dynamically using Power BI visuals and slicers.
🎯 Target vs Actual Analysis – Instantly identify missed or achieved targets with visual indicators.
📅 MTD & YTD Performance View – Analyze both short-term and cumulative performance in one dashboard.
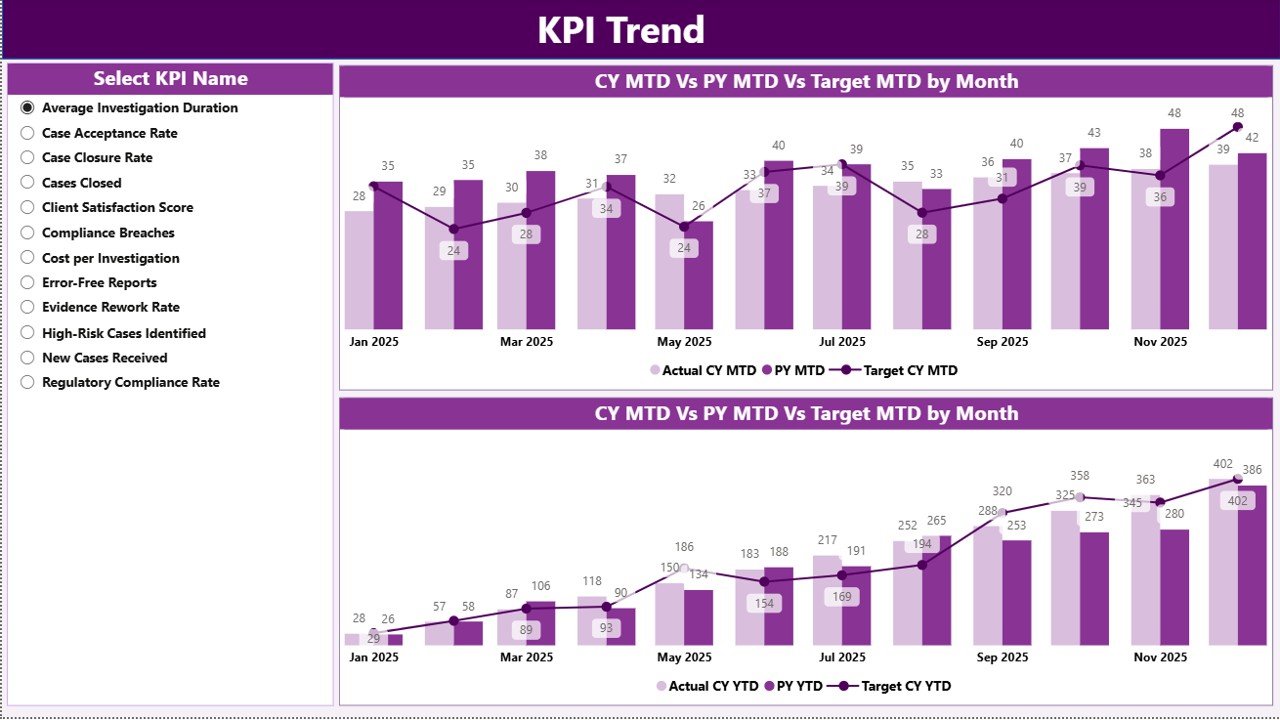
📈 Trend Analysis Charts – Understand monthly and yearly KPI behavior through intuitive combo charts.
🔎 Smart Filters & Slicers – Filter data by Month, KPI Group, and KPI Name for quick insights.
🟢 Performance Status Icons – Visual arrows and indicators highlight performance gaps instantly.
📂 Excel-Based Data Source – Simple and flexible data entry using structured Excel sheets.
🔁 Automatic Refresh – Update Excel inputs and refresh Power BI to see instant results.
📦 What’s Inside the Forensics & Investigation KPI Dashboard
This digital product includes a well-structured Power BI file with three powerful pages:
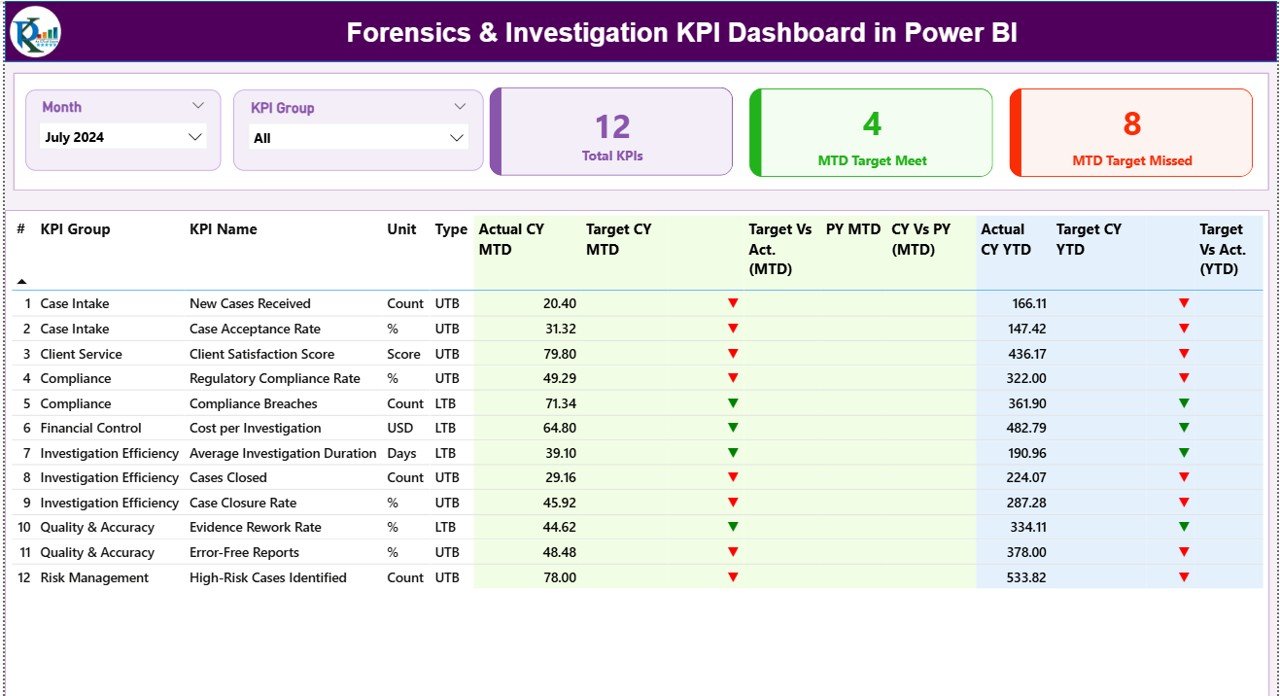
📌 Summary Page
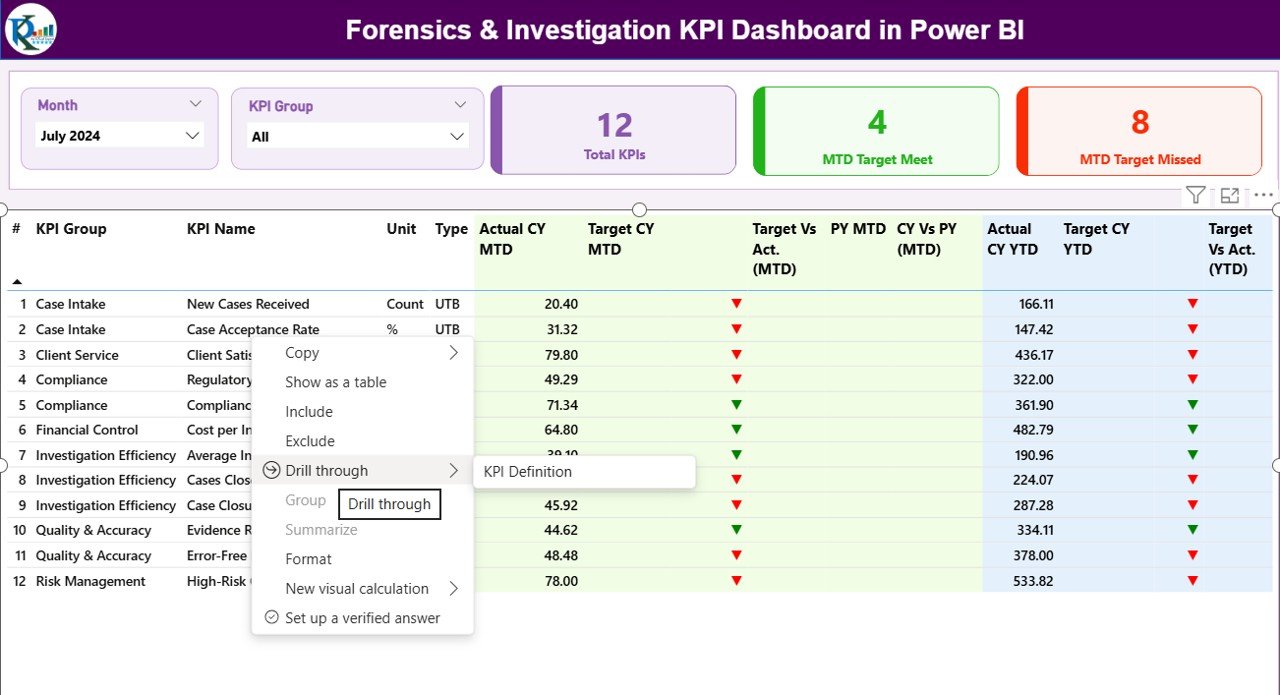
Provides a complete performance overview with KPI cards, slicers, and a detailed KPI table showing MTD, YTD, targets, previous year comparisons, and performance indicators.
📌 KPI Trend Page
Displays MTD and YTD trends using combo charts, allowing users to compare current year, previous year, and target values over time.
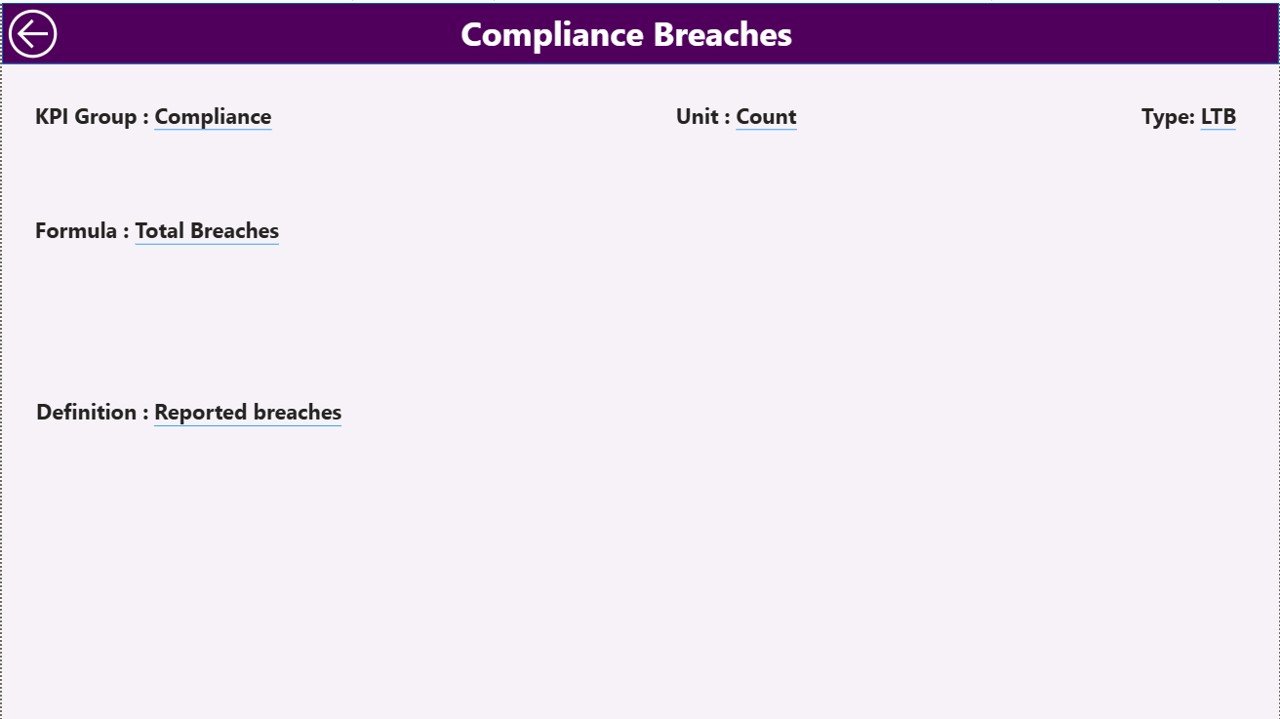
📌 KPI Definition Page
Acts as a drill-through reference page showing KPI formulas, definitions, units, and KPI type (LTB / UTB), ensuring transparency and clarity.
Additionally, the product uses a structured Excel data source with:
-
Input_Actual sheet
-
Input_Target sheet
-
KPI Definition sheet
This setup keeps maintenance easy and user-friendly.
🛠️ How to Use the Forensics & Investigation KPI Dashboard
Using this dashboard is simple—even for non-technical users:
1️⃣ Enter actual and target KPI values in the provided Excel sheets
2️⃣ Maintain KPI definitions in the KPI Definition sheet
3️⃣ Refresh the Power BI file
4️⃣ Use slicers to filter by month, KPI group, or KPI name
5️⃣ Analyze performance, trends, and gaps instantly
No complex setup, no coding, and no advanced Power BI knowledge required.
👥 Who Can Benefit from This Dashboard
✅ Forensic Investigation Teams
✅ Internal Audit Departments
Watch the step-by-step video tutorial:
✅ Legal & Compliance Teams
✅ Risk Management Units
✅ Senior Management & Executives
✅ Organizations handling sensitive investigations
Whether you are managing a few KPIs or a large investigation portfolio, this dashboard adapts easily to your needs.
Click here to read the Detailed blog post


