The Cosmetics and Skincare Dashboard industry evolves at lightning speed. New brands launch every year, customer preferences shift rapidly, and competition intensifies across online and offline channels. Therefore, businesses must closely track sales, costs, profit margins, discounts, brands, stores, and product categories. However, when data remains scattered across multiple Excel files or manual reports, decision-making becomes slow, risky, and reactive.
That is exactly where the Cosmetics and Skincare Dashboard in Excel becomes an essential business tool 💄🧴📊.
This ready-to-use Excel dashboard converts raw transactional data into clear KPIs, interactive charts, and actionable insights. Instead of spending hours preparing reports, business owners and managers gain instant visibility into performance—all from a single, professionally designed Excel file.
Built for simplicity, flexibility, and impact, this dashboard helps cosmetics and skincare businesses move from guesswork to data-driven growth.
## Key Features of Cosmetics and Skincare Dashboard in Excel 🚀
This dashboard is designed to simplify complex performance analysis.
📊 Centralized Performance Tracking
Monitor sales, cost, profit, discounts, brands, stores, and regions in one Excel dashboard.
🎛️ Interactive Right-Side Slicers
Filter insights instantly by region, brand, store, product category, or month.
📈 Executive KPI Cards
Get a quick snapshot of critical business metrics without deep analysis.
📉 Profit & Cost Control Insights
Identify high-cost categories, low-margin brands, and underperforming stores.
🏷️ Brand & Category Performance Analysis
Understand which brands and product categories drive revenue and profitability.
🏬 Store-Wise Performance Visibility
Compare store performance easily to optimize retail strategy.
📅 Monthly Trend Tracking
Analyze seasonality, campaign impact, and month-to-month performance.
💡 100% Excel-Based Solution
No BI tools required—easy to update, customize, and maintain.
## What’s Inside the Cosmetics and Skincare Dashboard in Excel 📂
This dashboard includes five professionally designed analytical pages, each focused on a specific business dimension.
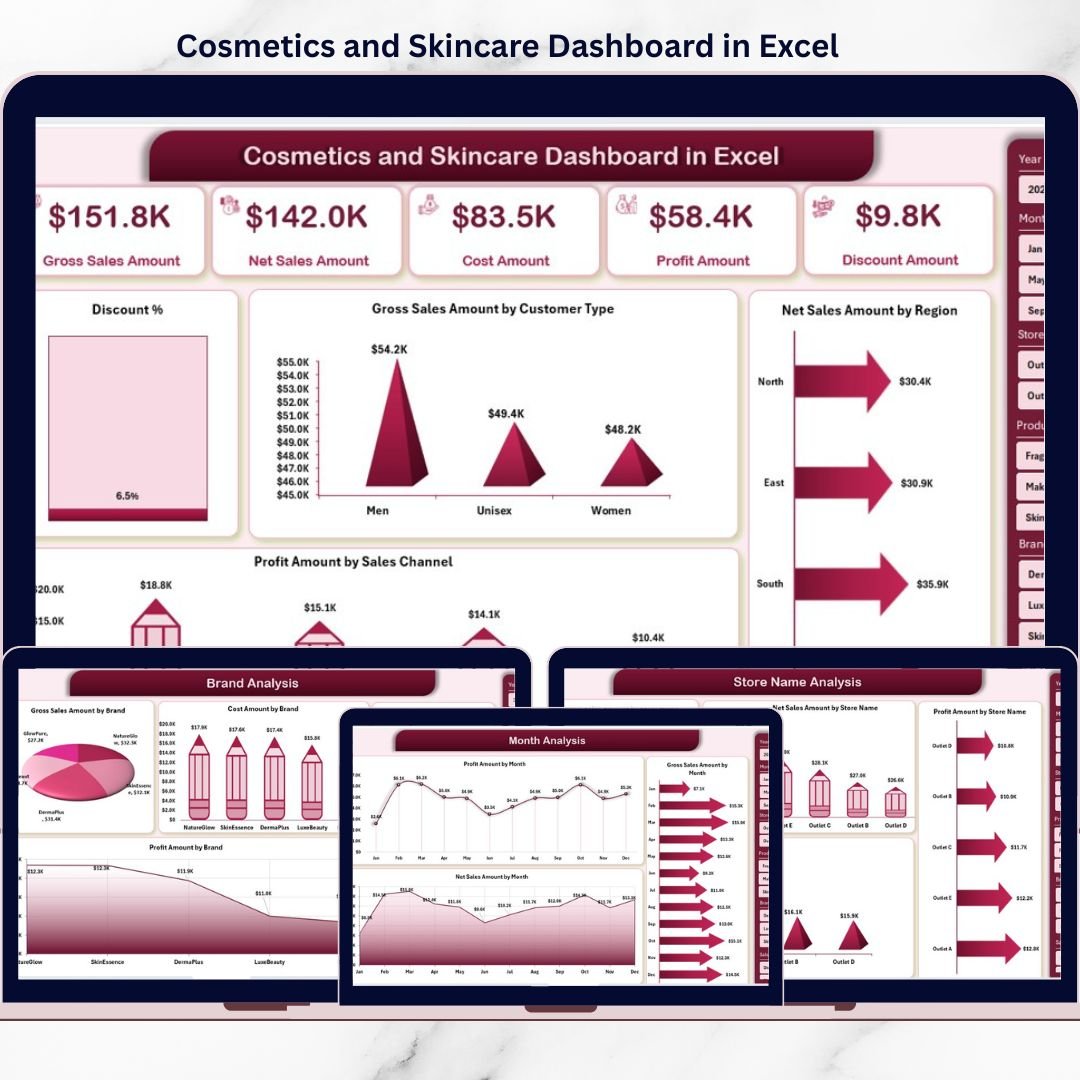
🟦 Overview Page
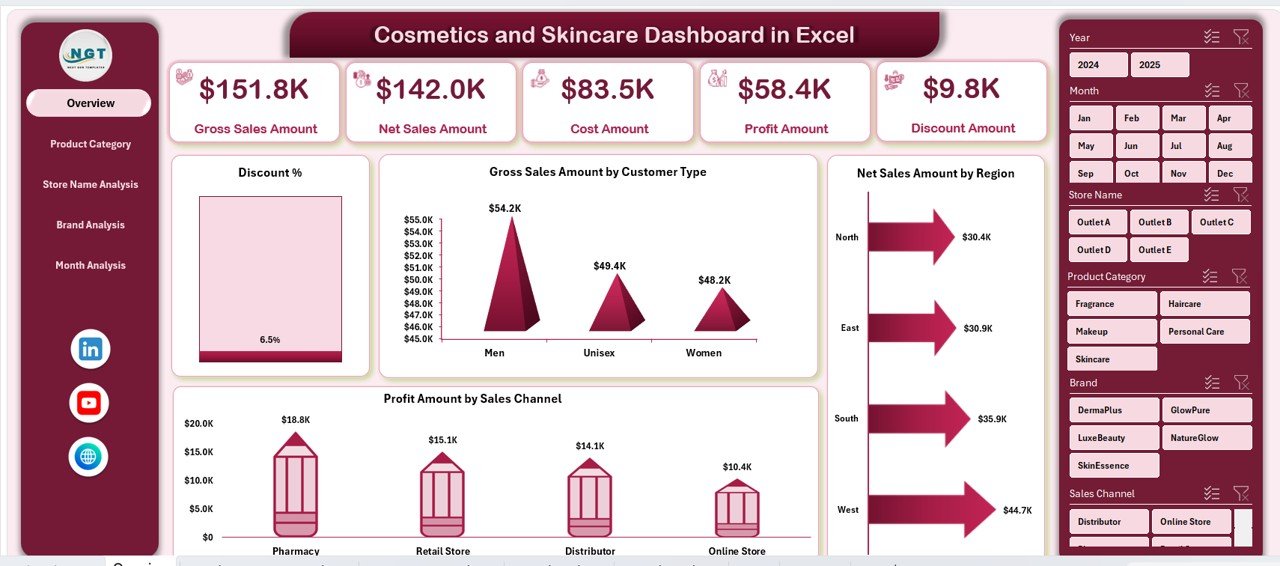
Acts as the command center with KPI cards and charts such as Discount %, Gross Sales by Customer Type, Net Sales by Region, and Profit by Sales Channel.
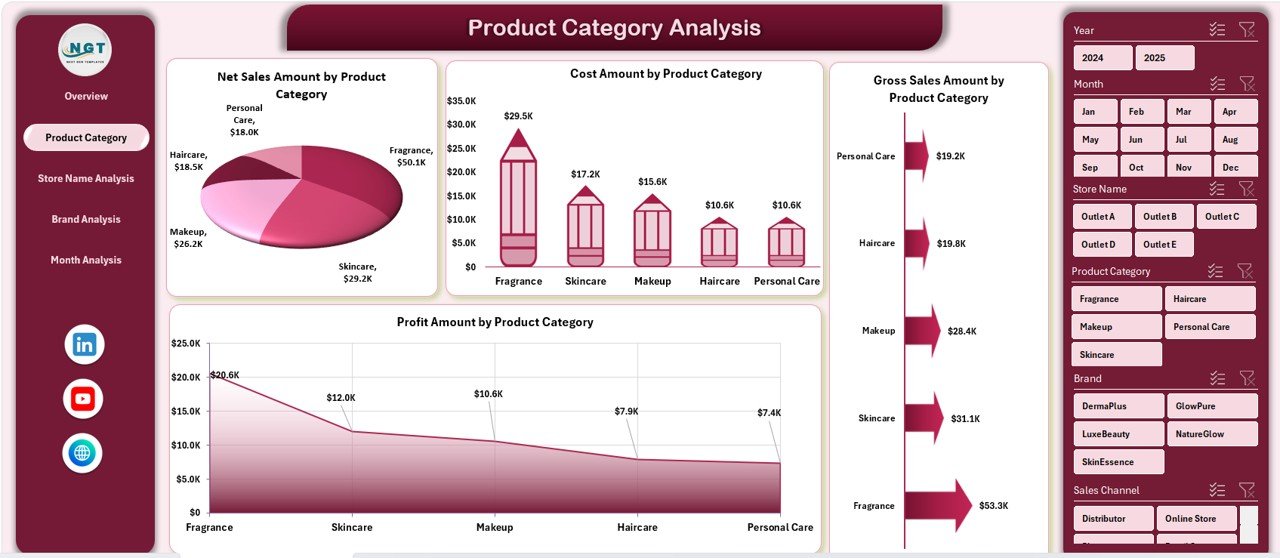
🟦 Product Category Analysis Page
Displays net sales, gross sales, cost, and profit by product category to optimize product mix.
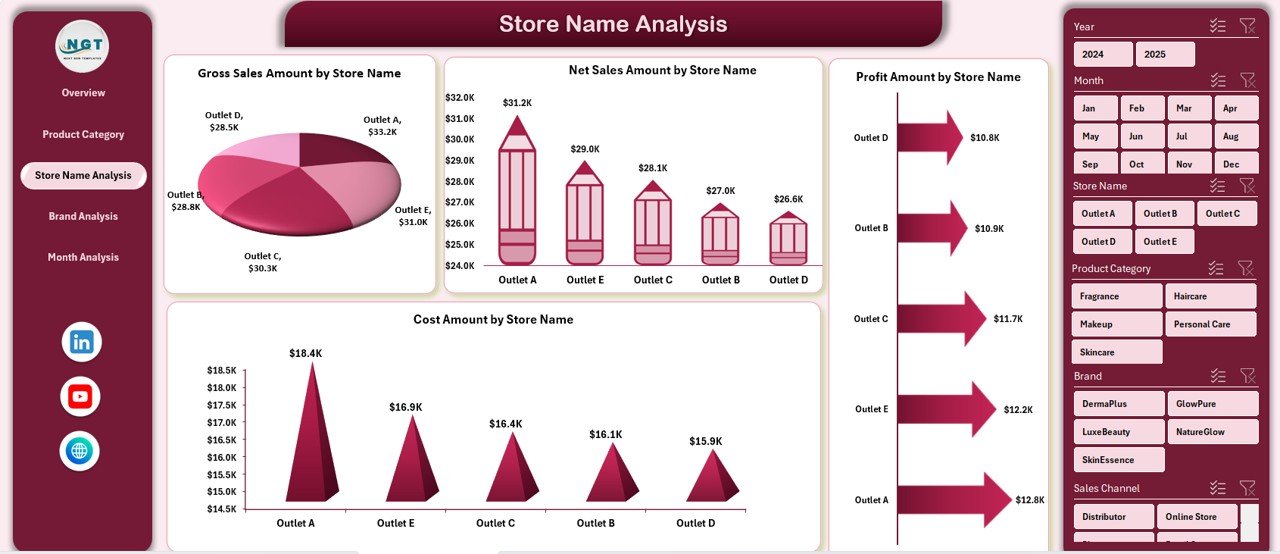
🟦 Store Name Analysis Page
Analyzes store-wise net sales, gross sales, cost, and profit to identify top and weak stores.
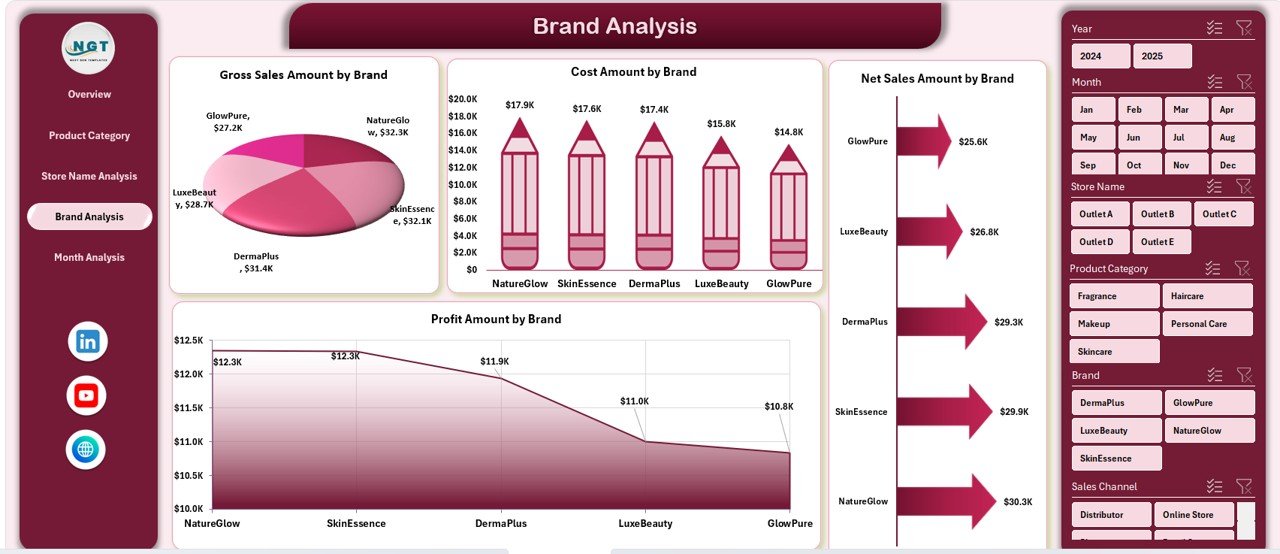
🟦 Brand Analysis Page
Evaluates brand-level performance for sales, cost, and profit to support brand strategy decisions.
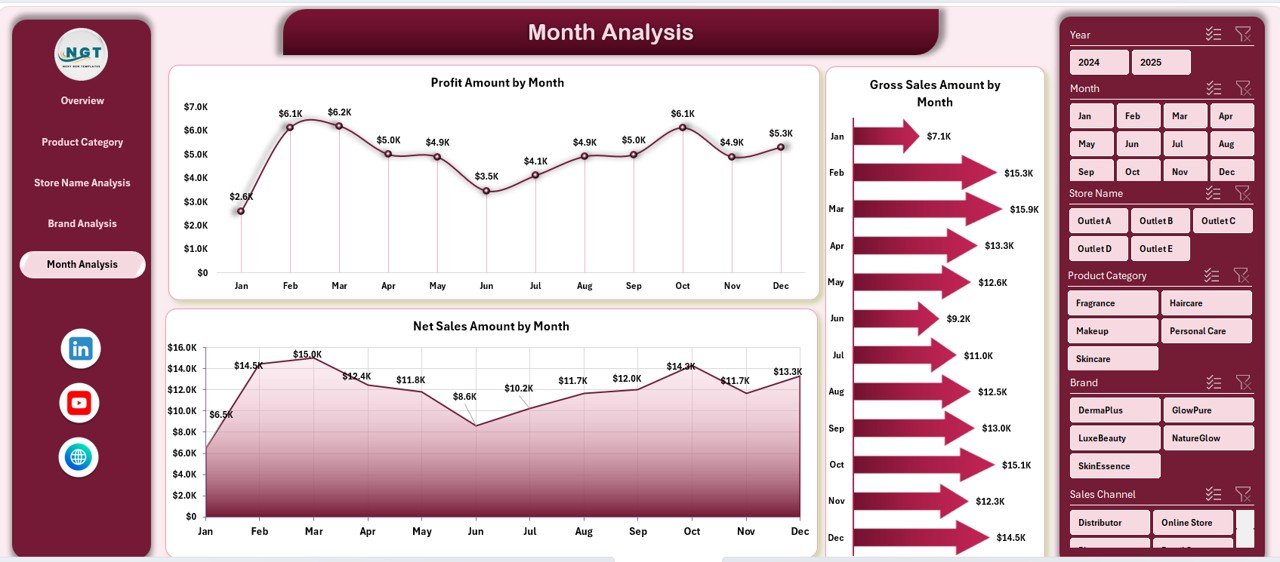
🟦 Month Analysis Page
Tracks monthly trends for net sales, gross sales, and profit to understand seasonality.
🟦 Data Sheet
Stores raw transactional data such as brand, category, store, region, sales, cost, and discounts.
🟦 Support Sheet
Manages calculations, mappings, and helper logic to keep the dashboard accurate and scalable.
Together, these sheets form a complete analytics system for cosmetics and skincare businesses.
## How to Use the Cosmetics and Skincare Dashboard in Excel 🧩
Using the dashboard is simple and business-friendly:
1️⃣ Update your transactional data in the Data Sheet
2️⃣ Refresh Pivot Tables if required
3️⃣ Use slicers to filter by brand, store, category, region, or month
4️⃣ Review KPI cards and charts instantly
5️⃣ Use insights to optimize pricing, promotions, and inventory
Excel updates all visuals automatically—so teams focus on strategy, not reporting.
## Who Can Benefit from This Cosmetics and Skincare Dashboard in Excel 👥
This dashboard is ideal for:
✔️ Cosmetics & Skincare Brand Owners
✔️ Retail & Store Managers
✔️ Sales & Marketing Teams
✔️ Finance & Profitability Analysts
✔️ Business Owners
✔️ Analysts & Consultants
Both small businesses and large enterprises can use this dashboard effectively.
### Click here to read the Detailed blog post
Visit our YouTube channel to learn step-by-step video tutorials
👉 YouTube.com/@PKAnExcelExpert


Reviews
There are no reviews yet.