Artificial Intelligence is rapidly shaping how organizations innovate, automate, and make decisions. However, as AI systems influence hiring, finance, healthcare, customer experience, and compliance, governance, transparency, and accountability become non-negotiable. Without structured oversight, organizations face regulatory risks, ethical challenges, and loss of stakeholder trust.
That is exactly where the AI Governance KPI Dashboard in Power BI becomes a game-changing solution 📊🤖.
This ready-to-use Power BI dashboard helps organizations monitor AI governance performance using clearly defined KPIs. Instead of juggling spreadsheets, emails, and manual reports, teams get a single, interactive, and real-time view of AI governance metrics—all in one Power BI file powered by an Excel data source.
Built for clarity and action, this dashboard transforms AI governance from a policy discussion into measurable, trackable performance.
## Key Features of AI Governance KPI Dashboard in Power BI 🚀
This dashboard is designed to support ethical, compliant, and responsible AI operations.
📊 Centralized AI Governance Reporting
Track all AI governance KPIs—ethics, risk, compliance, and transparency—in one place.
🎛️ Interactive Slicers
Filter insights instantly using Month and KPI Group slicers.
📈 MTD & YTD Performance Tracking
Monitor Month-to-Date and Year-to-Date actuals, targets, and previous-year comparisons.
🚦 Visual Status Indicators
Red ▼ and green ▲ icons instantly highlight KPIs that meet or miss targets.
📉 Trend Analysis with Combo Charts
Analyze MTD and YTD trends using interactive charts for deeper insights.
📂 Excel-Based Data Input
Update actuals and targets easily using a simple Excel file—no technical complexity.
⚡ Power BI Interactivity
Drill down, filter, and explore governance insights dynamically.
## What’s Inside the AI Governance KPI Dashboard in Power BI 📁
This dashboard includes 3 professionally designed Power BI pages, supported by a structured Excel data source.
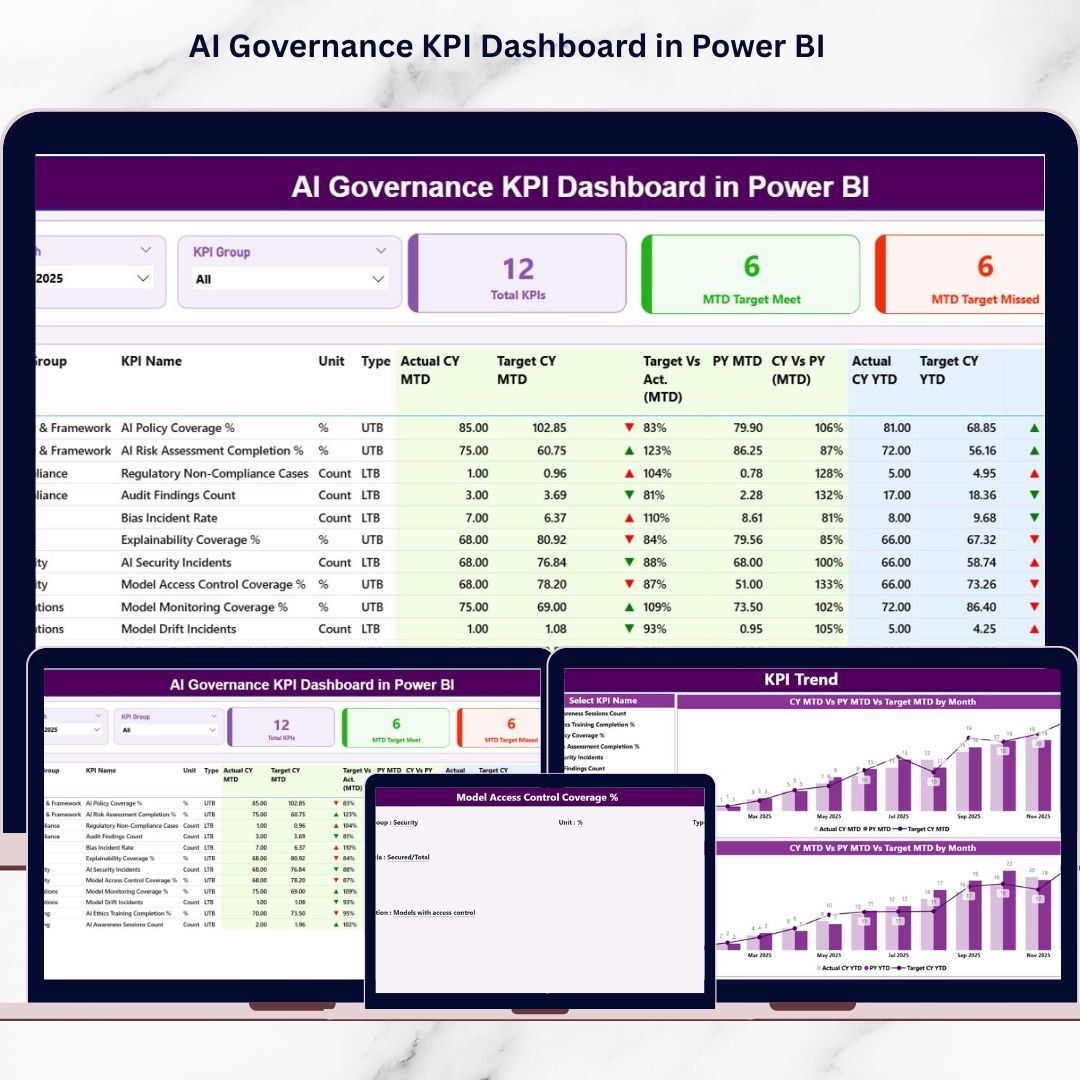
🟦 Summary Page
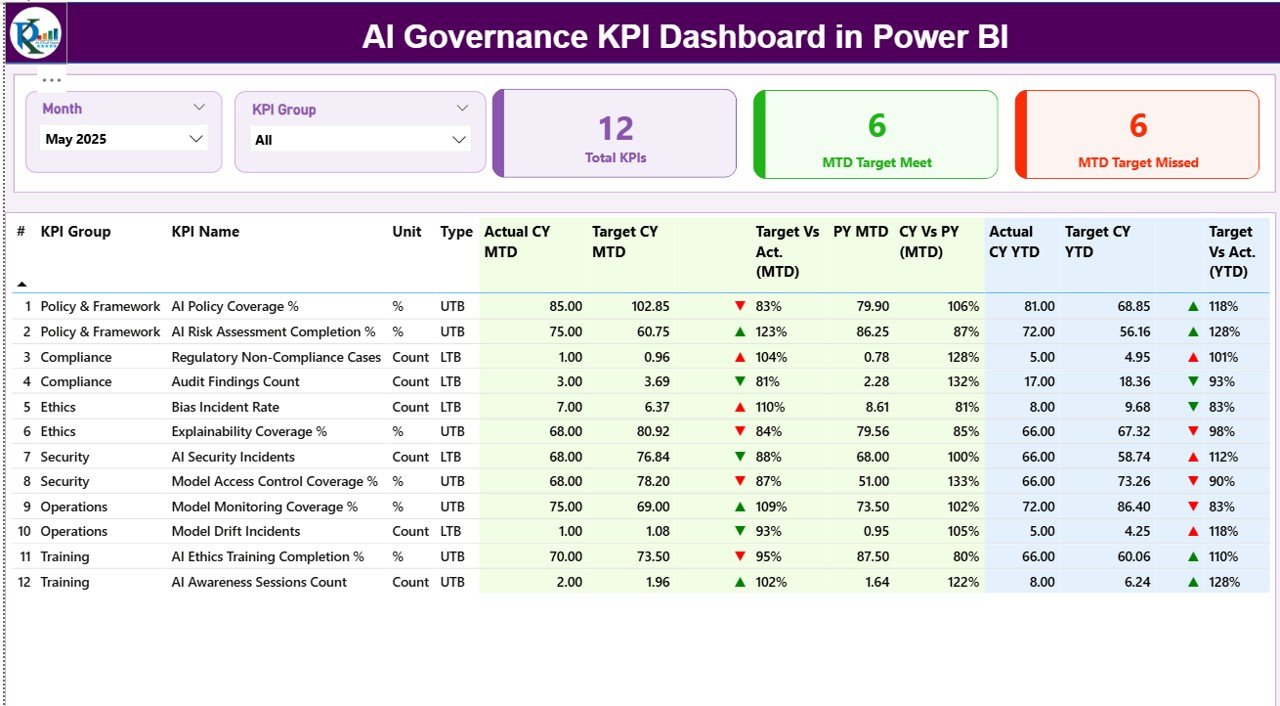
Provides a high-level view of AI governance performance with slicers, KPI cards, and a detailed KPI table showing MTD and YTD metrics.
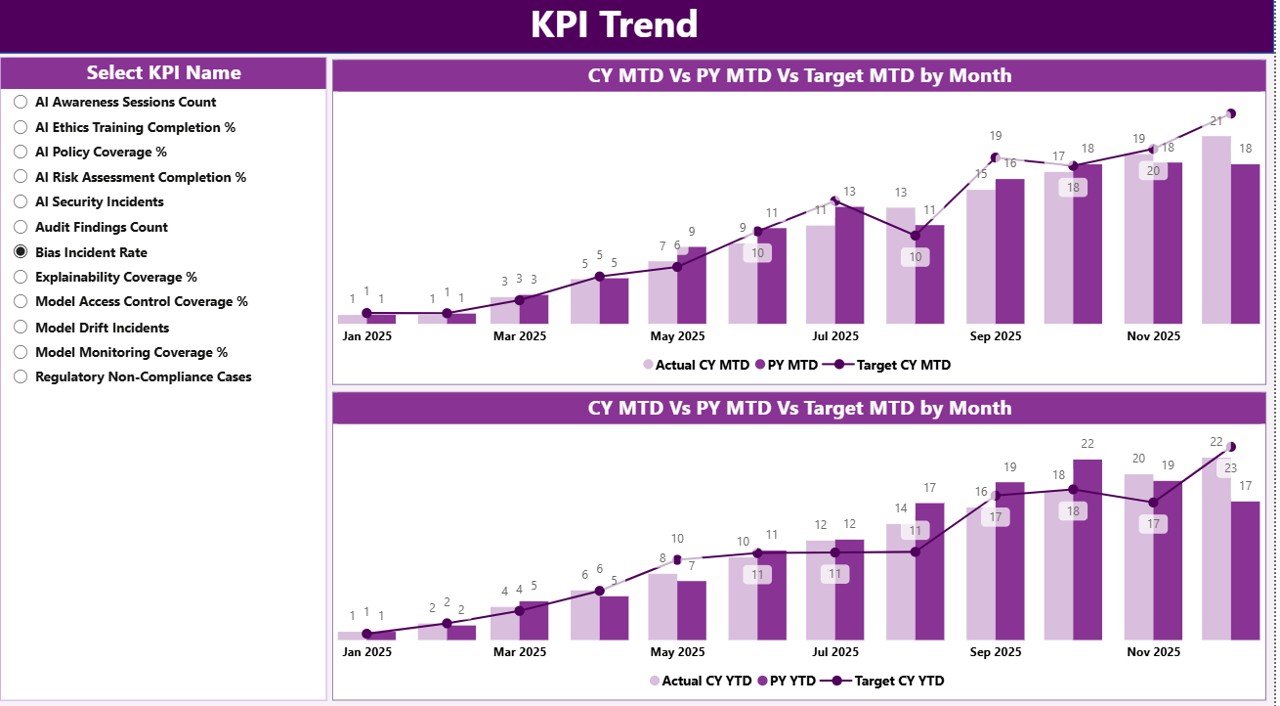
🟦 KPI Trend Page
Allows users to analyze performance trends for a selected KPI using MTD and YTD combo charts.
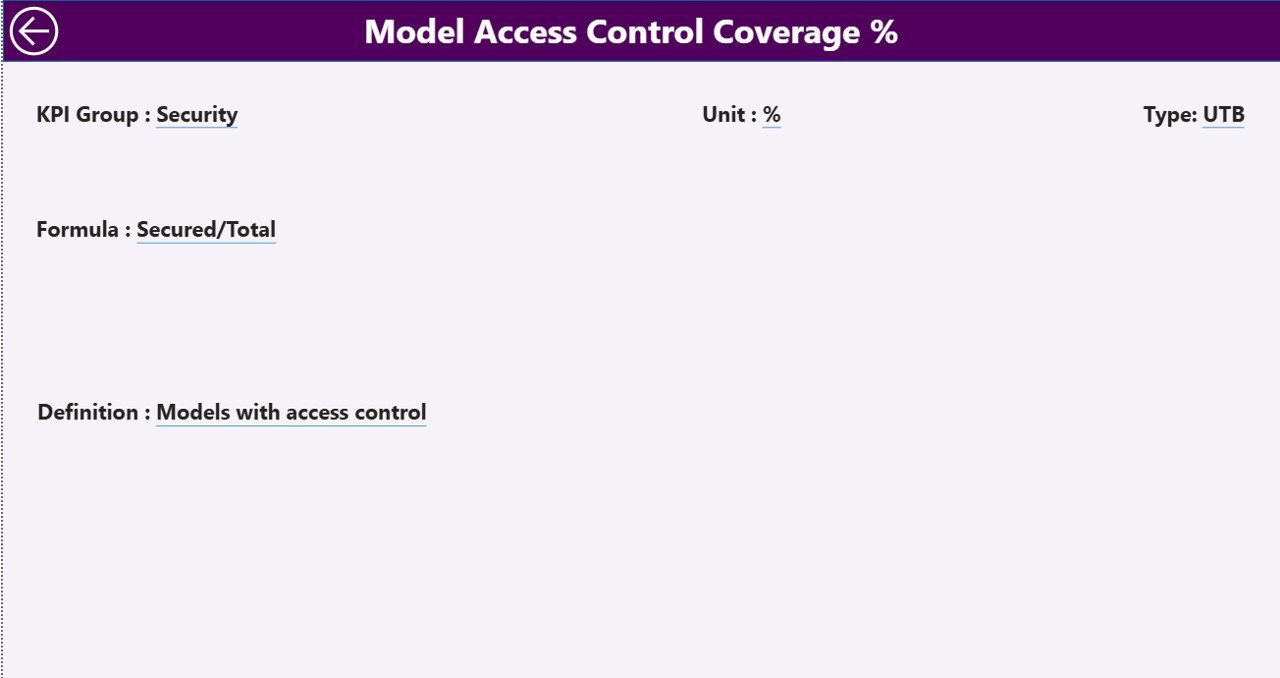
🟦 KPI Definition Page
Acts as a drill-through reference page showing KPI formula, definition, unit, and type (LTB or UTB).
Behind the scenes, the Excel data source includes:
-
Input_Actual Sheet – Stores actual MTD and YTD values
-
Input_Target Sheet – Stores target MTD and YTD values
-
KPI Definition Sheet – Documents KPI structure and logic
Together, these components create a robust AI governance analytics framework.
## How to Use the AI Governance KPI Dashboard in Power BI 🧩
Using this dashboard is simple and business-friendly:
1️⃣ Update actual KPI values in the Excel Input_Actual sheet
2️⃣ Enter targets in the Input_Target sheet
3️⃣ Maintain KPI documentation in the KPI Definition sheet
4️⃣ Refresh the Power BI file
5️⃣ Use slicers and visuals to analyze governance performance
Power BI automatically handles calculations, comparisons, and visuals—allowing teams to focus on governance decisions, not manual reporting.
## Who Can Benefit from This AI Governance KPI Dashboard in Power BI 👥
This dashboard is ideal for:
✔️ AI Governance & Ethics Teams
✔️ Risk and Compliance Officers
✔️ Data Science & AI Leaders
✔️ Internal Audit Teams
✔️ Legal & Regulatory Teams
✔️ CIOs, CTOs, and Executives
Whether you are starting AI governance or strengthening an existing framework, this dashboard adapts to your needs.
### Click here to read the Detailed blog post
Visit our YouTube channel to learn step-by-step video tutorials
👉 YouTube.com/@PKAnExcelExpert


Reviews
There are no reviews yet.