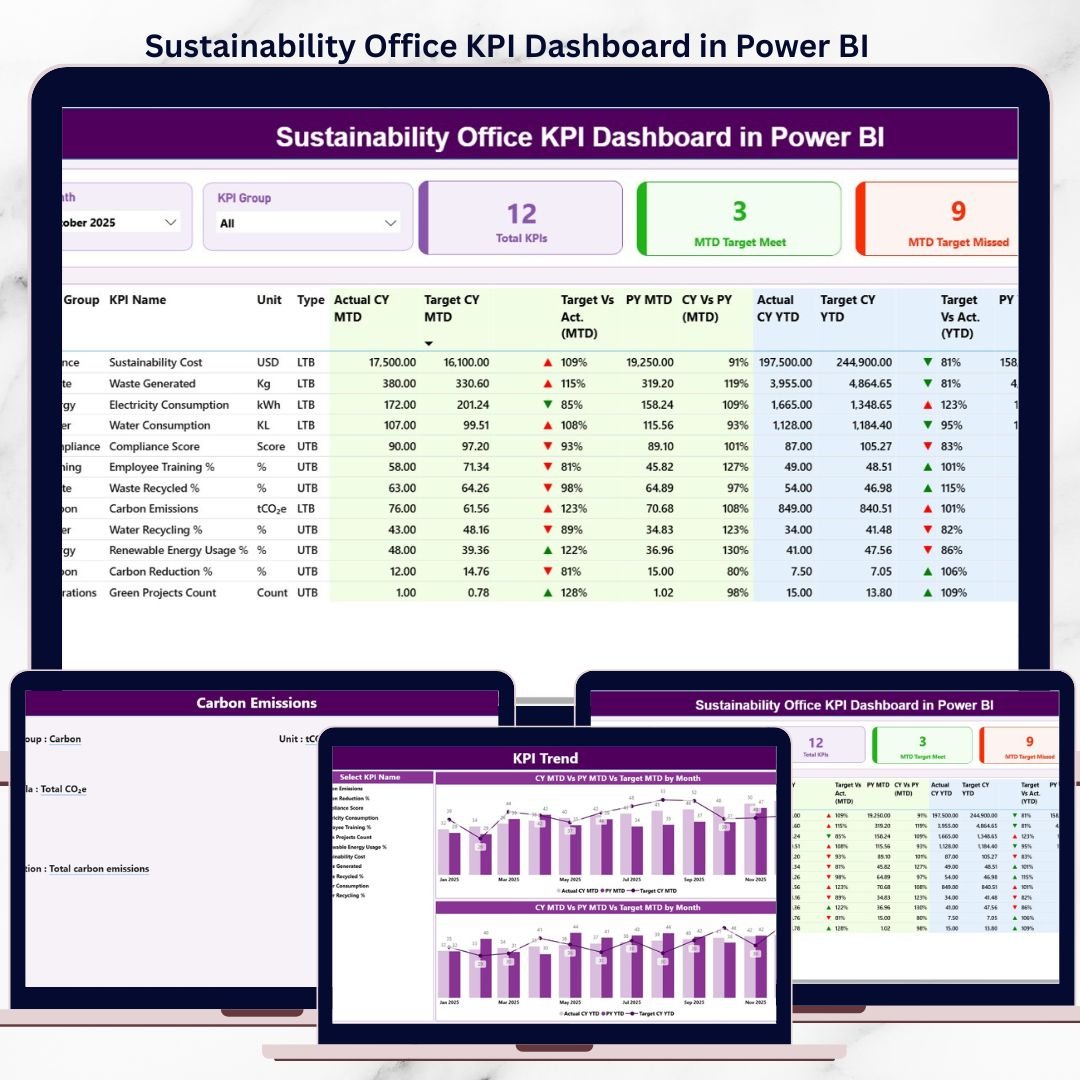
Sustainability Office KPI Dashboard has become a core responsibility, not just a reporting requirement. Organizations today must track environmental impact, social responsibility, and governance (ESG) performance accurately and consistently. However, many sustainability offices still depend on manual Excel reports, delayed updates, and fragmented data sources. As a result, insights arrive late and decision-making suffers.
The Sustainability Office KPI Dashboard in Power BI solves this challenge by converting raw sustainability data into clear, interactive, and real-time insights.
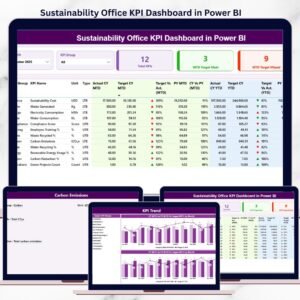
This ready-to-use Power BI dashboard, powered by structured Excel inputs, helps sustainability teams track MTD, YTD, target vs actual, and year-over-year performance using professional visuals, icons, and trend analysis. It is designed for clarity, accountability, and scalability—without complex system dependencies.
🚀 Key Features of Sustainability Office KPI Dashboard in Power BI
🌱 Centralized ESG KPI Monitoring
Track all sustainability KPIs in one interactive Power BI dashboard.
📊 MTD & YTD Performance Tracking
Monitor short-term execution and long-term sustainability progress together.
🎯 Target vs Actual Comparison
Instantly identify which sustainability KPIs meet or miss targets.
📉📈 Previous Year Performance Benchmarking
Analyze improvements or declines using year-over-year comparisons.
🔺🔻 Visual KPI Status Indicators
Green and red arrows highlight KPI performance clearly.
📈 KPI Trend Analysis Page
Identify sustainability patterns, risks, and improvement areas over time.
🧩 KPI Definition Drill-Through Page
Maintain clarity with KPI formulas, definitions, and measurement logic.
⚡ Excel-Based Data Input + Power BI Visualization
Easy to maintain, scalable, and audit-friendly.
📦 What’s Inside the Sustainability Office KPI Dashboard
📄 Summary Page
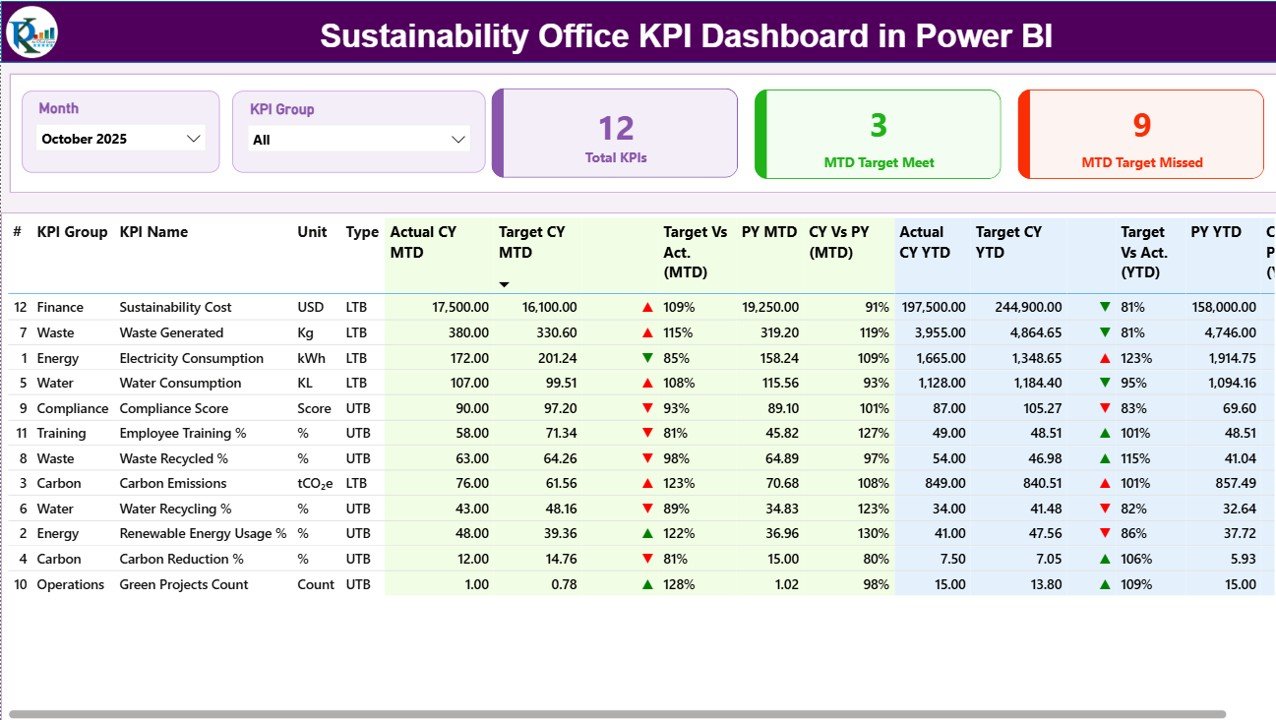
This is the main landing page of the dashboard.
Key elements include:
-
Month slicer
-
KPI Group slicer
-
KPI cards showing:
-
Total KPIs Count
-
MTD Target Met Count
-
MTD Target Missed Count
-
-
A detailed KPI performance table with:
-
KPI Number
-
KPI Group
-
KPI Name
-
Unit
-
KPI Type (LTB / UTB)
-
Actual, Target, and Previous Year values (MTD & YTD)
-
Target vs Actual %
-
CY vs PY %
-
Visual performance icons
-
This page provides complete sustainability performance visibility in one screen.
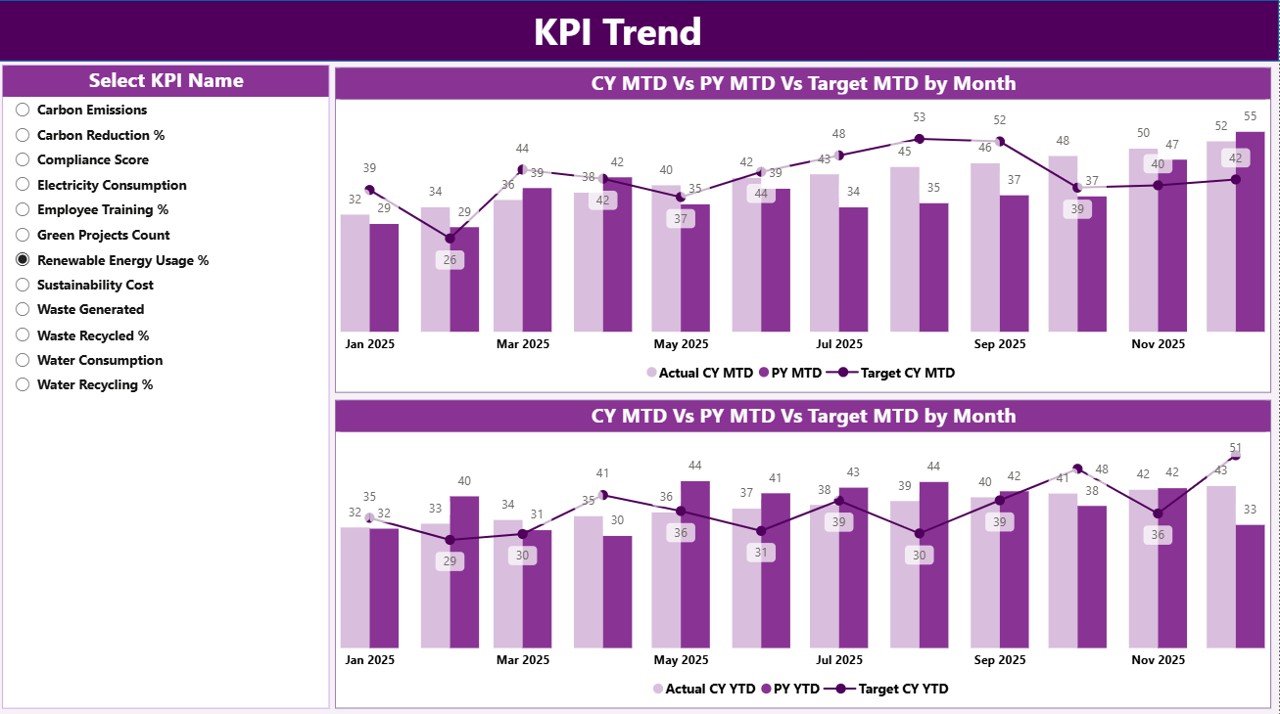
📄 KPI Trend Page
This page focuses on performance trends.
Includes:
-
KPI Name slicer
-
MTD trend chart (Actual vs Target vs Previous Year)
-
YTD trend chart (Actual vs Target vs Previous Year)
It helps sustainability teams move beyond numbers and understand performance behavior.
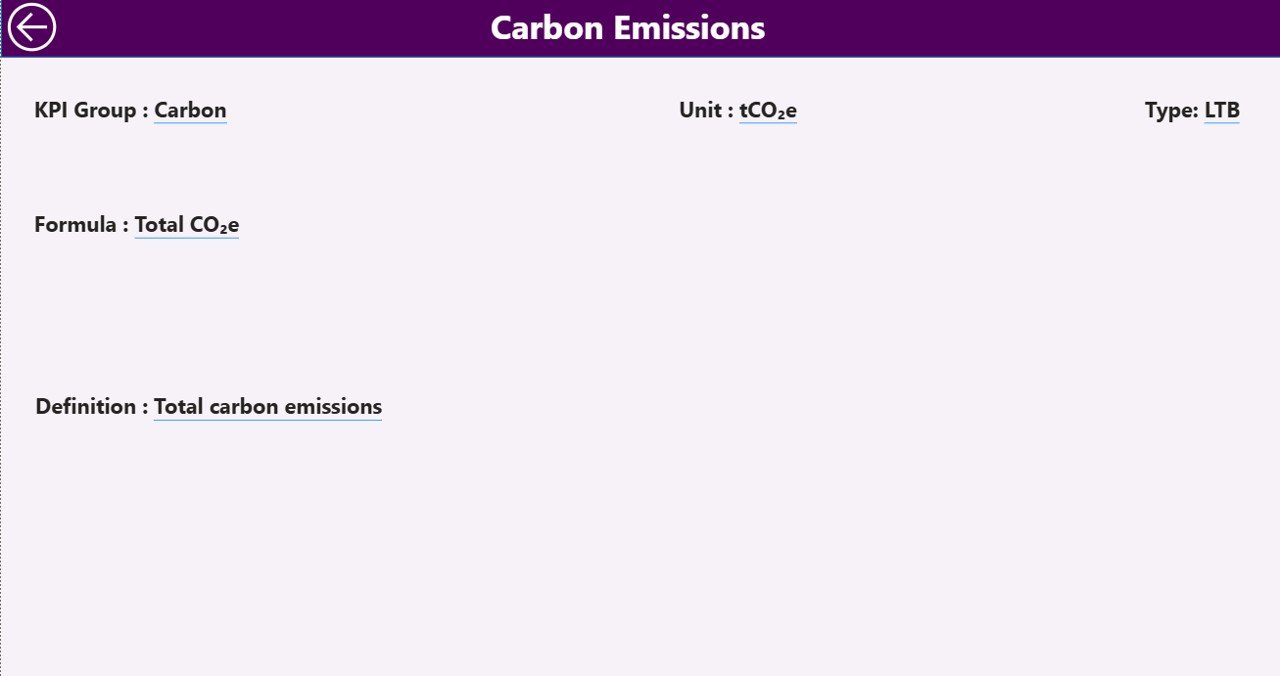
📄 KPI Definition Page (Drill-Through)
A clean drill-through page showing:
-
KPI Formula
-
KPI Definition
-
KPI Type and measurement logic
This ensures clarity during leadership reviews, audits, and ESG reporting.
🛠️ How to Use the Sustainability Office KPI Dashboard
1️⃣ Enter sustainability actual data in the Input_Actual Excel sheet
2️⃣ Define targets in the Input_Target Excel sheet
3️⃣ Maintain KPI structure in the KPI Definition sheet
4️⃣ Refresh Power BI data
5️⃣ Use slicers to analyze performance by month or KPI group
6️⃣ Review MTD, YTD, and year-over-year results
7️⃣ Drill through to KPI definitions when needed
No complex modeling. No manual reporting. Just structured inputs and instant insights.
👥 Who Can Benefit from This Sustainability Dashboard
🌱 Sustainability Managers & Officers – Monitor ESG performance clearly
📊 ESG & Compliance Teams – Support audits and regulatory reporting
🏭 Operations & Facility Teams – Track energy, waste, and efficiency KPIs
📈 Corporate Strategy Teams – Align sustainability with business goals
👔 Senior Leadership – Review sustainability performance at a glance
🏢 Organizations of Any Size – From SMEs to large enterprises
If sustainability performance matters to your organization, this dashboard is built for you.
📘 Click here to read the Detailed blog post
🎥 Visit our YouTube channel to learn step-by-step video tutorials
👉 Youtube.com/@PKAnExcelExpert


Reviews
There are no reviews yet.