Managing hedge fund performance without a structured dashboard often leads to delays, confusion, and missed opportunities. When portfolio managers and analysts rely on scattered spreadsheets, it becomes difficult to track AUM, NAV, returns, and active funds with clarity.
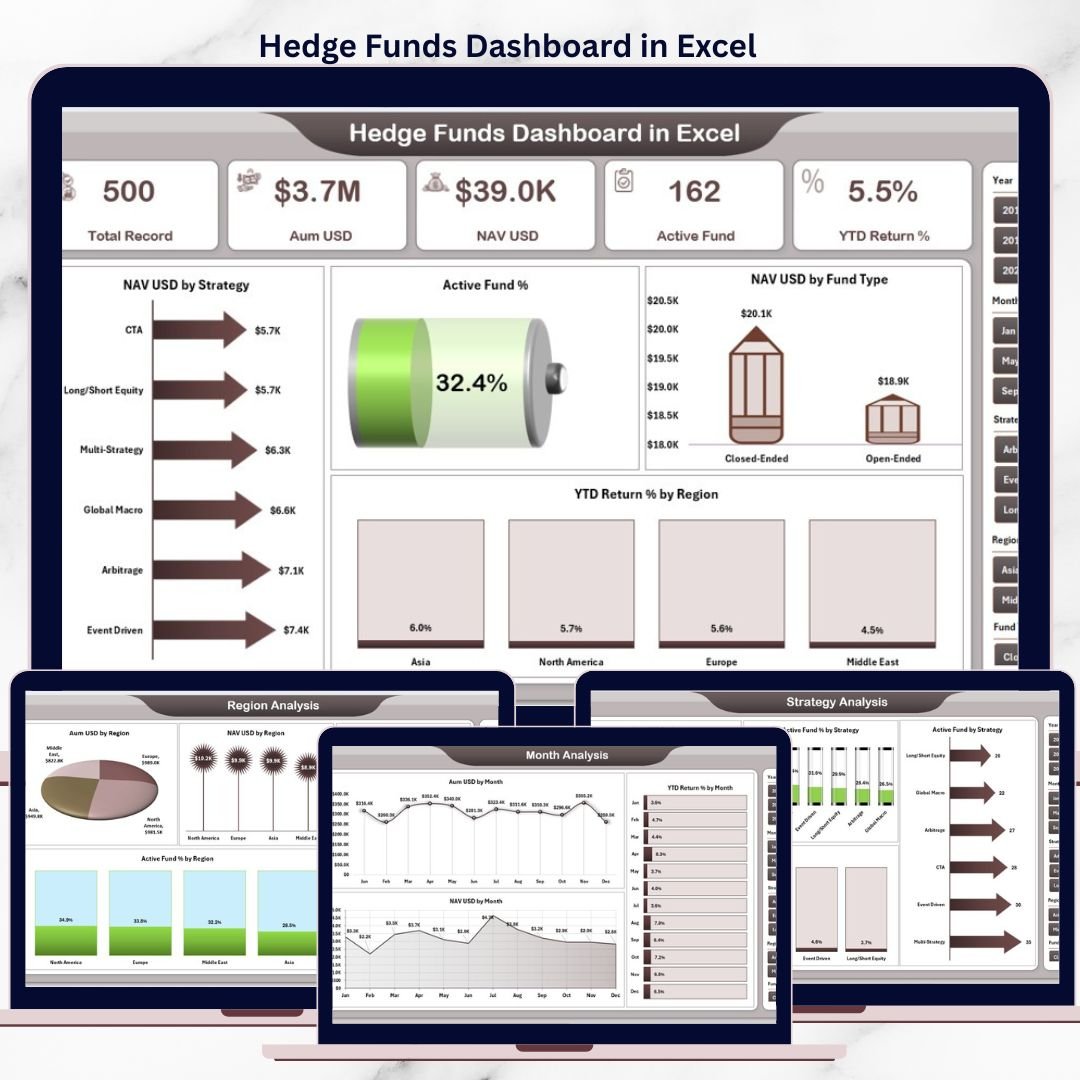
The Hedge Funds Dashboard in Excel is a ready-to-use, professionally designed Excel solution that transforms raw hedge fund data into clear KPIs, interactive charts, and actionable insights—all in one centralized dashboard.
Instead of manually compiling reports, this dashboard helps hedge fund teams monitor fund performance, compare strategies, analyze regions, and track trends over time using Excel’s native capabilities. It is powerful, flexible, and easy to use—without expensive BI tools.
🚀 Key Features of Hedge Funds Dashboard in Excel
📌 Centralized Hedge Fund Performance Tracking
Monitor AUM, NAV, active fund %, benchmark returns, and YTD returns in one place.
📊 Interactive Pivot Charts & KPI Cards
All visuals update instantly with slicers and data refresh.
🧭 Built-In Page Navigator
Move smoothly between analysis pages using the left-side navigator.
🎯 Dynamic Slicers
Filter data by strategy, region, country, and month in real time.
📈 Multi-Dimensional Analysis
Analyze hedge fund performance by strategy, geography, and time period.
⚙️ 100% Excel-Based Solution
No Power BI, no add-ins—just Excel pivot tables, charts, and formulas.
🎨 Professional & Executive-Ready Design
Clean layout suitable for investment reviews and leadership meetings.
📦 What’s Inside the Hedge Funds Dashboard in Excel
📁 Data Sheet
A structured table storing hedge fund data such as AUM, NAV, active fund status, fund type, strategy, region, country, benchmark return, YTD return, and month.
📁 Support Sheet
Handles backend calculations, lookup logic, and helper tables to keep the dashboard fast and accurate.
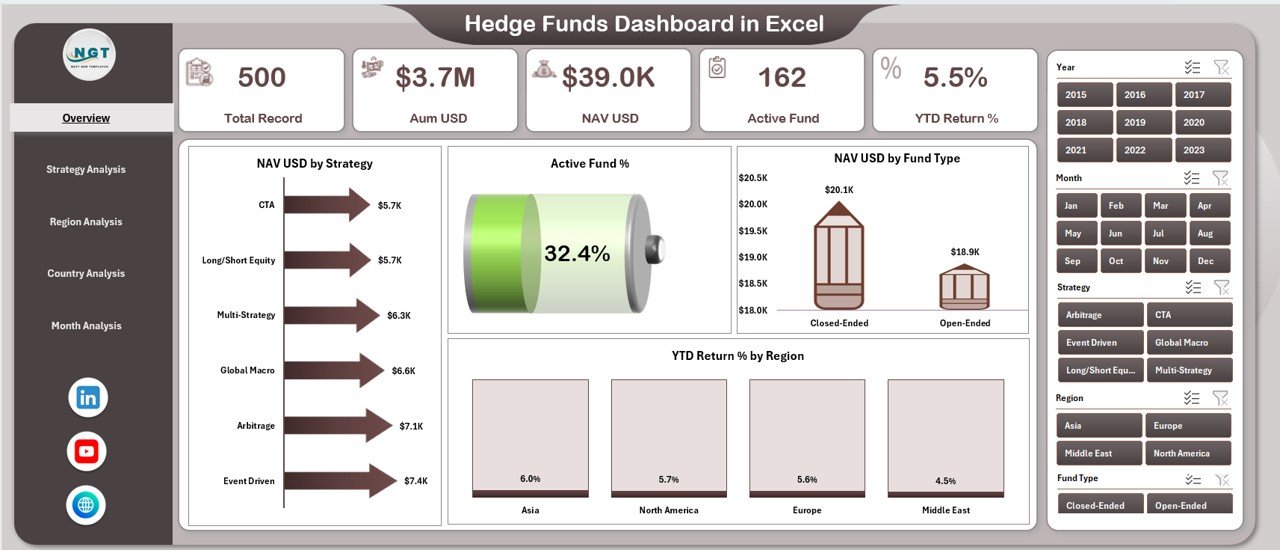
📁 Overview Page
High-level snapshot of hedge fund performance with:
-
KPI cards
-
NAV USD by Strategy
-
Active Fund %
-
NAV USD by Fund Type
-
YTD Return % by Region
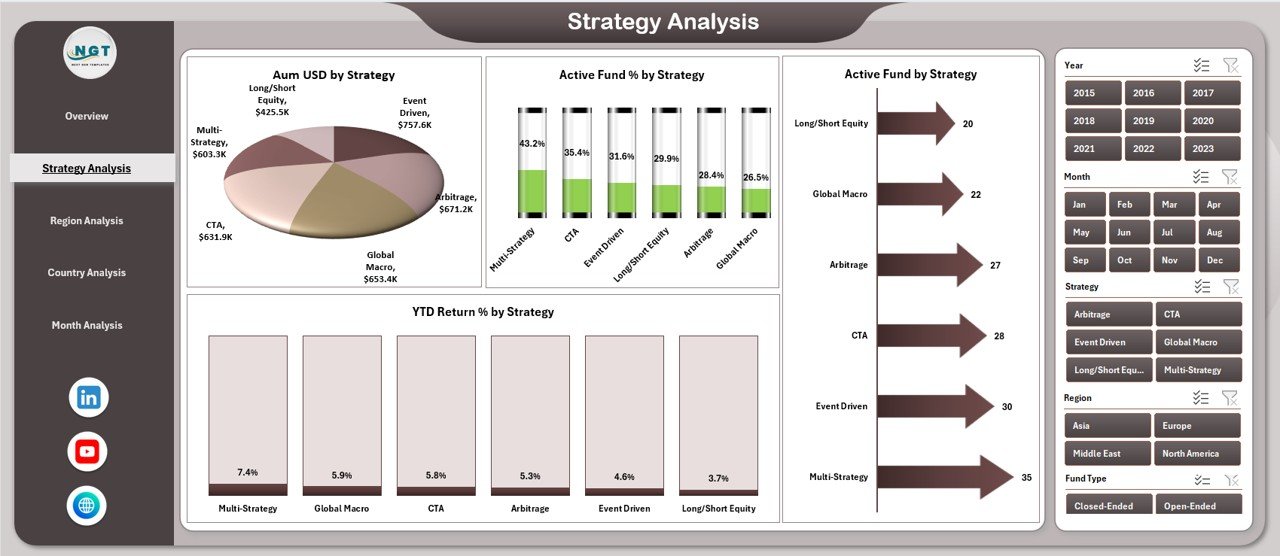
📁 Strategy Analysis Page
Compare AUM, active funds, and YTD returns across hedge fund strategies.
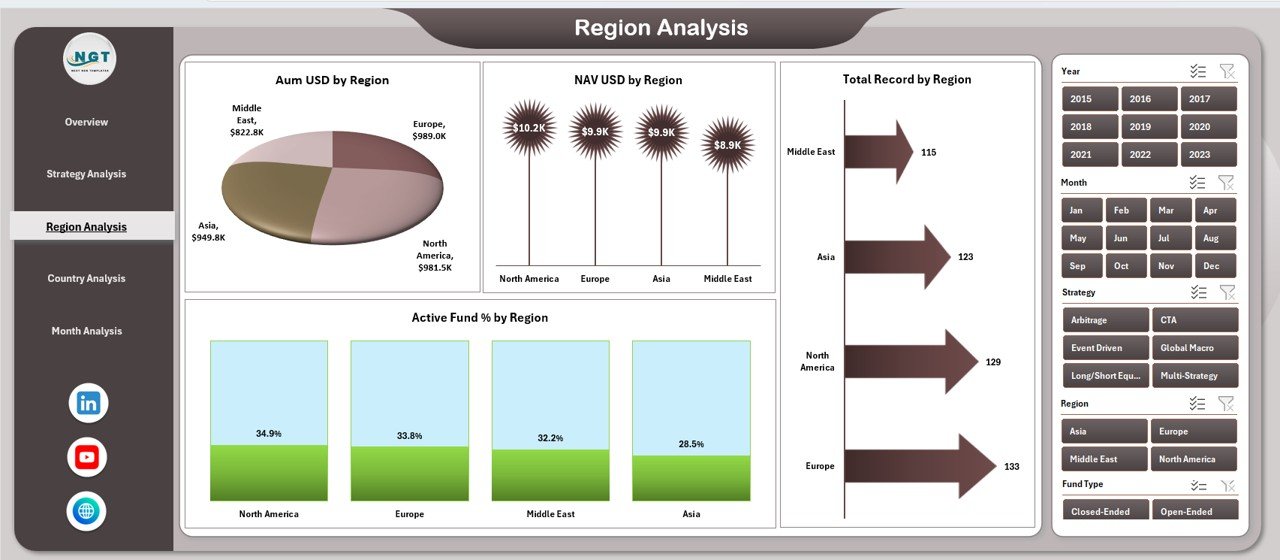
📁 Region Analysis Page
Analyze AUM, NAV, and active fund distribution by region.
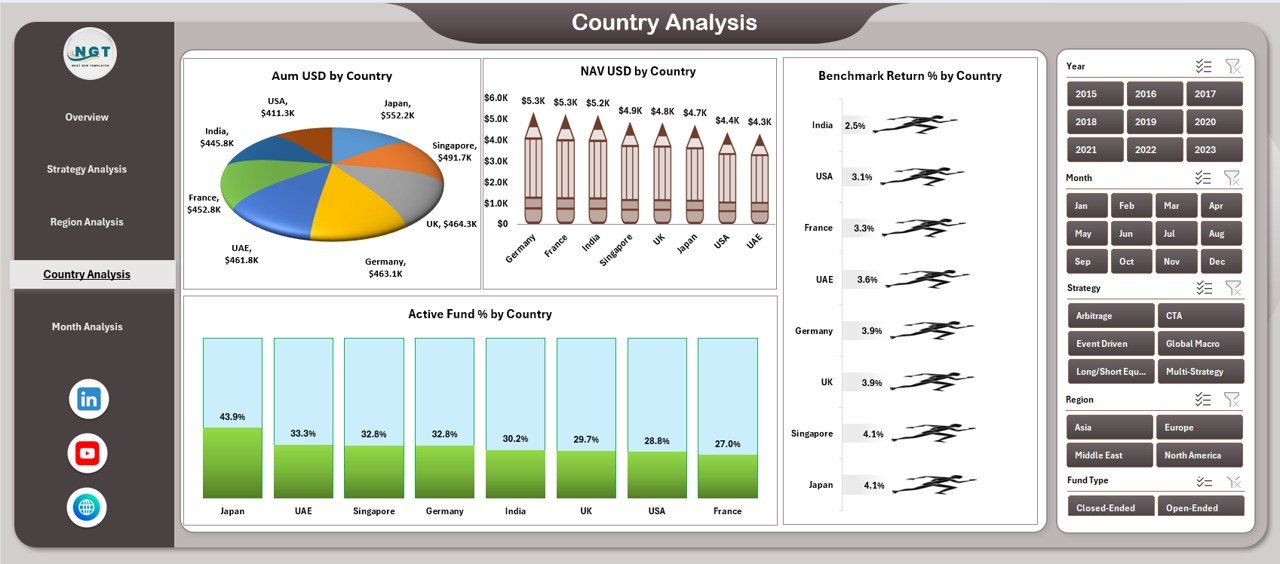
📁 Country Analysis Page
Evaluate country-level performance and benchmark returns.
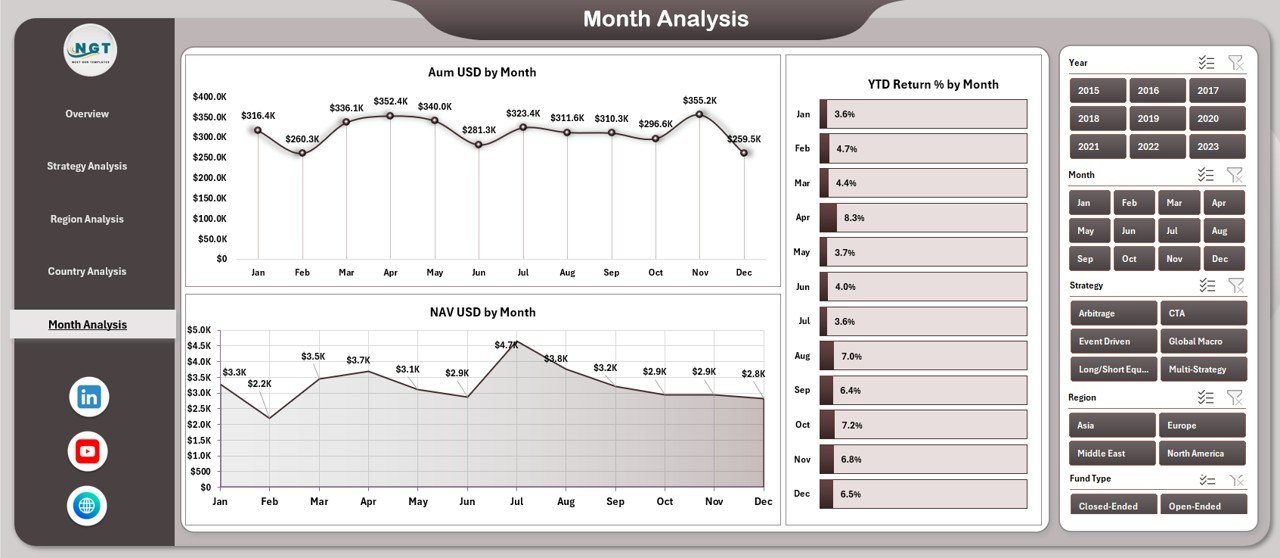
📁 Month Analysis Page
Track AUM, NAV, and YTD return trends over time.
📁 Page Navigator Panel
Quick access to all analytical pages without scrolling.
🛠️ How to Use the Hedge Funds Dashboard in Excel
1️⃣ Enter or paste hedge fund data into the Data Sheet
2️⃣ Refresh pivot tables with one click
3️⃣ Use slicers to filter by strategy, region, country, or month
4️⃣ Navigate pages using the Page Navigator
5️⃣ Review KPIs, trends, and comparisons instantly
6️⃣ Customize charts or metrics as needed
No advanced Excel skills required—the dashboard is built for everyday investment professionals.
👥 Who Can Benefit from This Hedge Funds Dashboard
📈 Hedge Fund Managers – Monitor fund performance and strategy impact
📊 Portfolio Managers – Compare NAV, AUM, and returns across funds
⚠️ Risk Management Teams – Track exposure by region and country
💼 Investment Analysts – Save time on reporting and analysis
🏦 Finance & Reporting Teams – Improve transparency and accuracy
👔 Executive Leadership – Review performance summaries confidently
If your role involves hedge fund analytics, this dashboard is built for you.
📘 Click here to read the Detailed blog post
🎥 Visit our YouTube channel to learn step-by-step video tutorials
👉 Youtube.com/@PKAnExcelExpert


Reviews
There are no reviews yet.