


Internal audit teams are expected to ensure compliance, reduce risk, meet targets, and clearly demonstrate value to senior management and audit committees. However, when audit KPIs are tracked using static reports, spreadsheets, or manual summaries, insights arrive late and decisions become reactive.
The Internal Audit KPI Dashboard in Power BI is a ready-to-use, interactive analytics solution designed to give internal audit teams real-time visibility into performance, targets, and trends—all in one centralized dashboard.
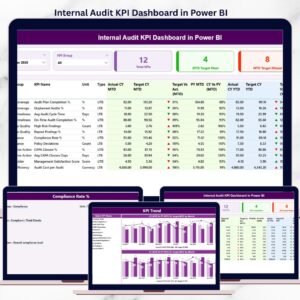
Instead of spending hours preparing reports, this dashboard automatically transforms structured Excel input data into clear KPI cards, detailed tables, trend charts, and visual performance indicators. Built on Power BI with Excel-based data entry, it combines simplicity, accuracy, and executive-level reporting without complexity.
🚀 Key Features of Internal Audit KPI Dashboard in Power BI
📊 Centralized Audit KPI Monitoring
Track all internal audit KPIs in one interactive Power BI dashboard.
🎯 MTD & YTD Performance Tracking
Monitor Month-to-Date and Year-to-Date actuals against targets effortlessly.
📈 Target vs Actual & PY Comparison
Instantly compare current performance with targets and previous year values.
🟢 Visual Performance Indicators
Green and red icons highlight KPIs that meet or miss targets instantly.
🔍 Interactive Filters & Drill-Through
Slice data by Month and KPI Group and drill into KPI definitions.
⚡ Automatic Refresh from Excel
Update Excel input files and refresh Power BI to see instant insights.
🔐 Professional & Executive-Ready Design
Perfect for audit committee meetings and management reviews.
📦 What’s Inside the Internal Audit KPI Dashboard in Power BI
📁 Summary Page
The central control panel of the dashboard featuring:
-
Month slicer and KPI Group slicer
-
KPI cards for Total KPIs, MTD Target Met, and MTD Target Missed
-
A detailed KPI table showing MTD & YTD Actual, Target, PY, and variance
-
Performance icons for instant status visibility
📁 KPI Trend Page
Deep-dive analysis for individual KPIs with:
-
KPI Name slicer
-
MTD trend chart (Actual, Target, PY)
-
YTD trend chart (Actual, Target, PY)
These charts help identify patterns, risks, and improvement opportunities.
📁 KPI Definition Page (Drill-Through)
A detailed reference page displaying:
-
KPI Formula
-
KPI Definition
-
KPI Type (UTB or LTB)
-
Measurement logic
Users can drill through directly from the Summary Page and return easily using the back button.
📁 Excel Input Structure
The dashboard connects to a structured Excel file with:
-
Input_Actual – MTD & YTD actual values
-
Input_Target – MTD & YTD target values
-
KPI Definition – KPI metadata and logic
🛠️ How to Use the Internal Audit KPI Dashboard in Power BI
1️⃣ Enter actual KPI values in the Input_Actual Excel sheet
2️⃣ Define targets in the Input_Target Excel sheet
3️⃣ Maintain KPI details in the KPI Definition sheet
4️⃣ Refresh the Power BI dataset
5️⃣ Use slicers to analyze MTD and YTD performance
6️⃣ Review KPI cards, tables, and trends instantly
7️⃣ Drill into KPI definitions when required
No coding required—Power BI handles all calculations and visuals automatically.
👥 Who Can Benefit from This Internal Audit KPI Dashboard
🧾 Internal Audit Managers – Track performance and accountability
🏢 Chief Audit Executives (CAE) – Gain strategic visibility into KPIs
⚠️ Risk & Compliance Teams – Identify gaps early
📊 Audit Analysts – Analyze trends and historical performance
💼 CFOs & Senior Management – Support governance and oversight
📋 Audit Committees – Review clear, data-driven audit insights
If your audit team uses Excel and needs stronger reporting, this dashboard is built for you.
📘 Click here to read the Detailed blog post
🎥 Visit our YouTube channel to learn step-by-step video tutorials
👉 Youtube.com/@PKAnExcelExpert


Reviews
There are no reviews yet.