Running a spa or wellness centre is about delivering premium experiences—but success behind the scenes depends on data. Managers must track KPIs, control costs, monitor service efficiency, and improve customer satisfaction. Spas and Wellness Centres KPI Dashboard in Power BI However, when performance data is spread across manual reports or disconnected Excel files, critical insights remain hidden.
Spas and Wellness Centres KPI Dashboard in Power BI That is exactly why the Spas and Wellness Centres KPI Dashboard in Power BI gives your business a powerful competitive edge 🚀.
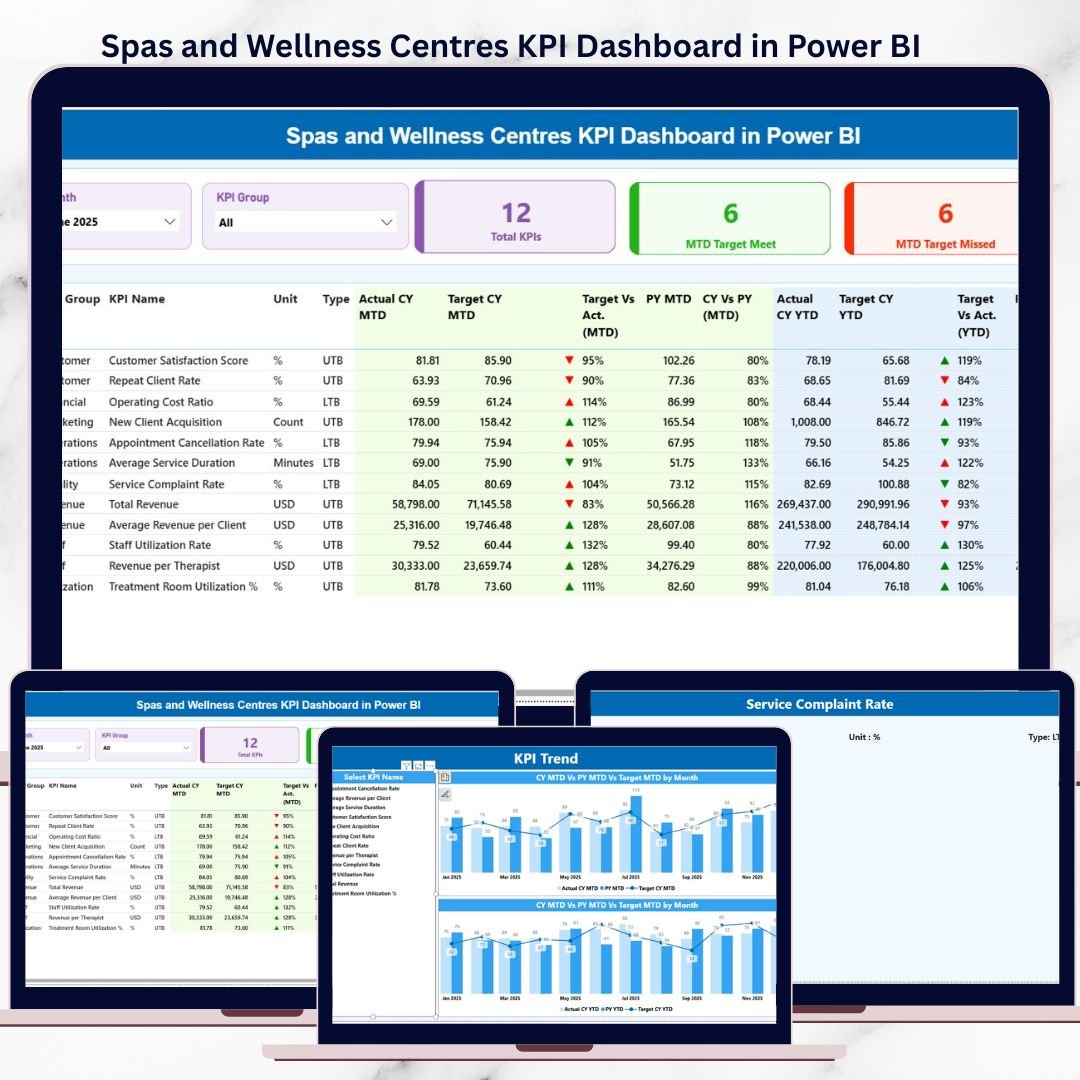
Spas and Wellness Centres KPI Dashboard in Power BI This ready-to-use Power BI dashboard transforms raw KPI data into interactive, visual insights. It helps spa owners and wellness managers monitor performance, compare targets, analyze trends, and make faster, smarter, data-driven decisions—without complex reporting or guesswork.
🚀 Key Features of Spas and Wellness Centres KPI Dashboard in Power BI
This dashboard is designed to deliver instant visibility and clarity.
✅ Centralized spa KPI monitoring in one dashboard
✅ MTD and YTD performance tracking
✅ Target vs Actual comparison with visual indicators
✅ Current Year vs Previous Year analysis
✅ Interactive slicers and filters for deep analysis
✅ Trend charts for performance patterns and seasonality
✅ Drill-through KPI definition page for clarity
✅ Excel-based data source with Power BI interactivity
With these features, performance gaps become obvious—before they impact revenue.
📦 What’s Inside the Spas and Wellness Centres KPI Dashboard in Power BI
This product includes three fully interactive Power BI pages, supported by structured Excel input sheets.
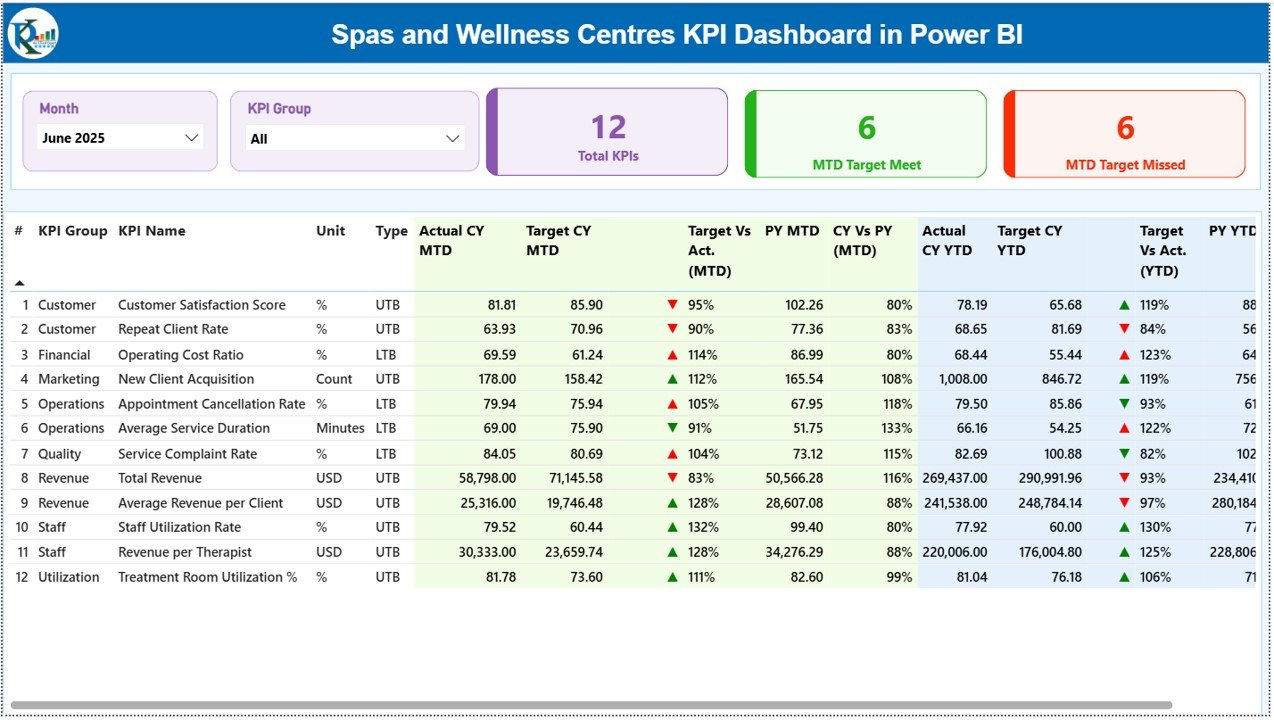
📊 Summary Page
The main dashboard that provides a complete overview of KPI performance. It includes KPI cards showing total KPIs, target-met count, and target-missed count, along with a detailed KPI table covering MTD and YTD metrics, targets, icons, and year-over-year comparisons.
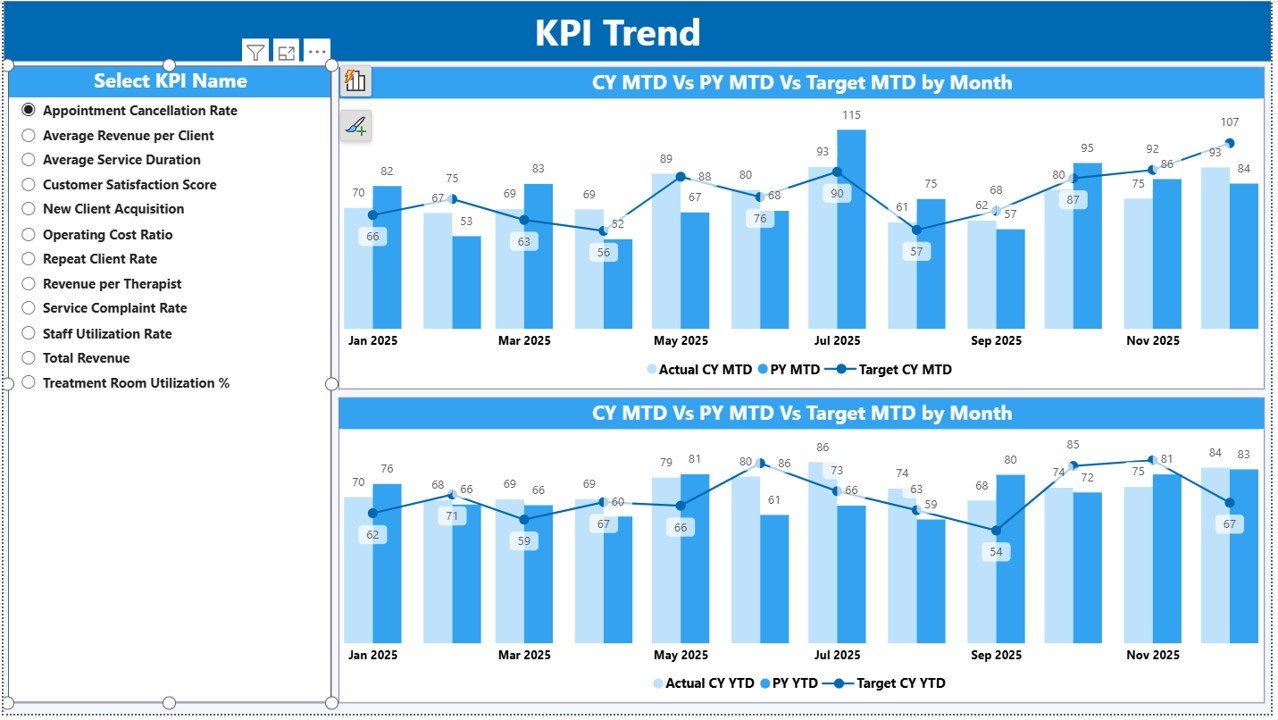
📈 KPI Trend Page
Designed for deep-dive analysis of individual KPIs. Select any KPI using the slicer and instantly view MTD and YTD combo charts showing Actual, Target, and Previous Year values.
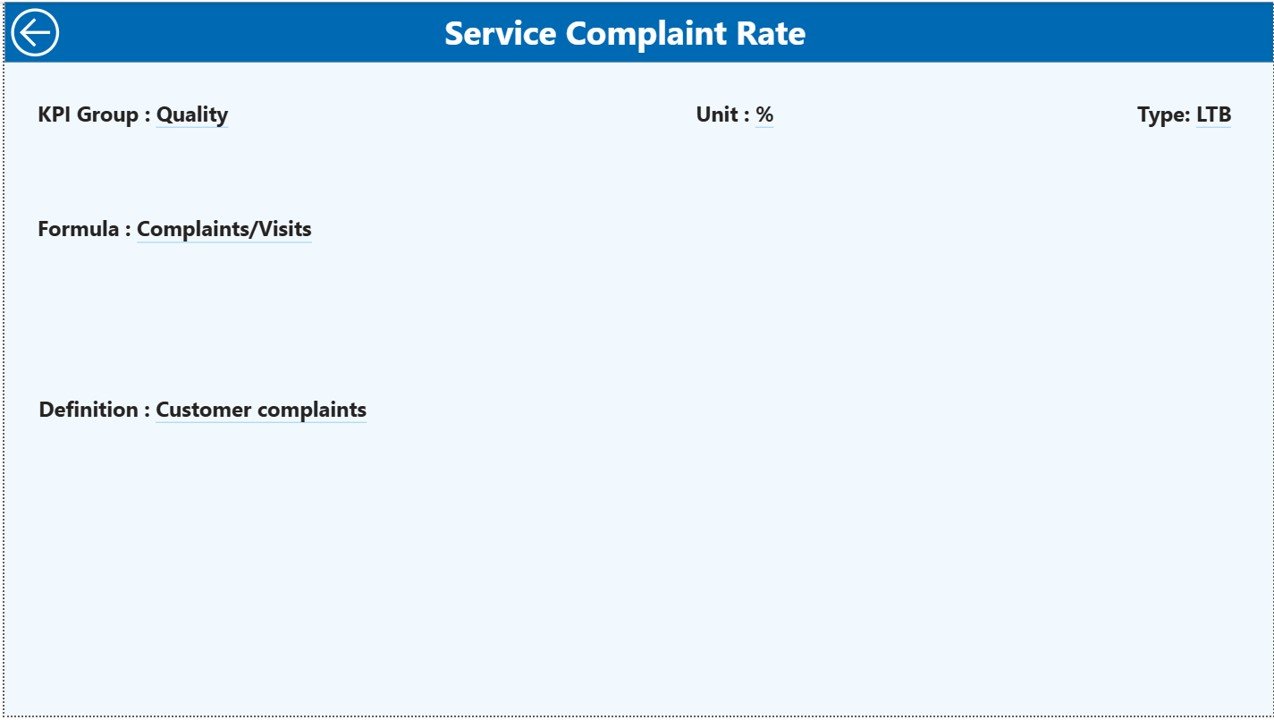
📘 KPI Definition Page
A drill-through page that explains KPI logic clearly. It displays KPI formula, definition, unit, and KPI type (LTB or UTB), ensuring complete transparency.
📂 Excel Data Source Sheets
-
Input Actual – Enter actual MTD and YTD values
-
Input Target – Define KPI targets
-
KPI Definition – Maintain standardized KPI logic
Together, these components create a robust and scalable KPI monitoring system.
🛠️ How to Use the Spas and Wellness Centres KPI Dashboard in Power BI
Using this dashboard is simple and business-friendly:
1️⃣ Enter actual KPI values in the Excel Input Actual sheet
2️⃣ Define targets in the Input Target sheet
3️⃣ Maintain KPI definitions in the KPI Definition sheet
4️⃣ Refresh the Power BI dashboard
5️⃣ Use slicers to filter by month or KPI group
6️⃣ Analyze performance using summary metrics and trend charts
No advanced Power BI skills required—just update data and explore insights.
🎯 Who Can Benefit from This Spas and Wellness Centres KPI Dashboard in Power BI
This dashboard is ideal for:
✔️ Spa owners
✔️ Wellness centre managers
✔️ Operations and performance managers
✔️ Finance and analytics teams
✔️ Franchise operators
✔️ multi-location spa businesses
If you track spa performance, this dashboard becomes an essential decision-making tool.
📈 How This Dashboard Improves Spa Business Performance
Because the dashboard highlights issues instantly:
-
Managers act before problems grow
-
Teams align with clear performance targets
-
Resources are allocated efficiently
-
Customer experience improves consistently
As a result, performance management becomes proactive, not reactive.
📖 Click here to read the Detailed Blog Post
🎥 Visit our YouTube channel to learn step-by-step video tutorials
👉 https://youtube.com/@PKAnExcelExpert


Reviews
There are no reviews yet.