Running a successful theme park is no longer just about exciting rides and smiling guests. Behind the scenes, managers must track attendance, monitor performance, control costs, and ensure operational efficiency every single day. However, relying on scattered Excel files and delayed reports often leads to missed insights and slow decisions.
That is exactly where the Theme Parks KPI Dashboard in Power BI becomes a game-changer.
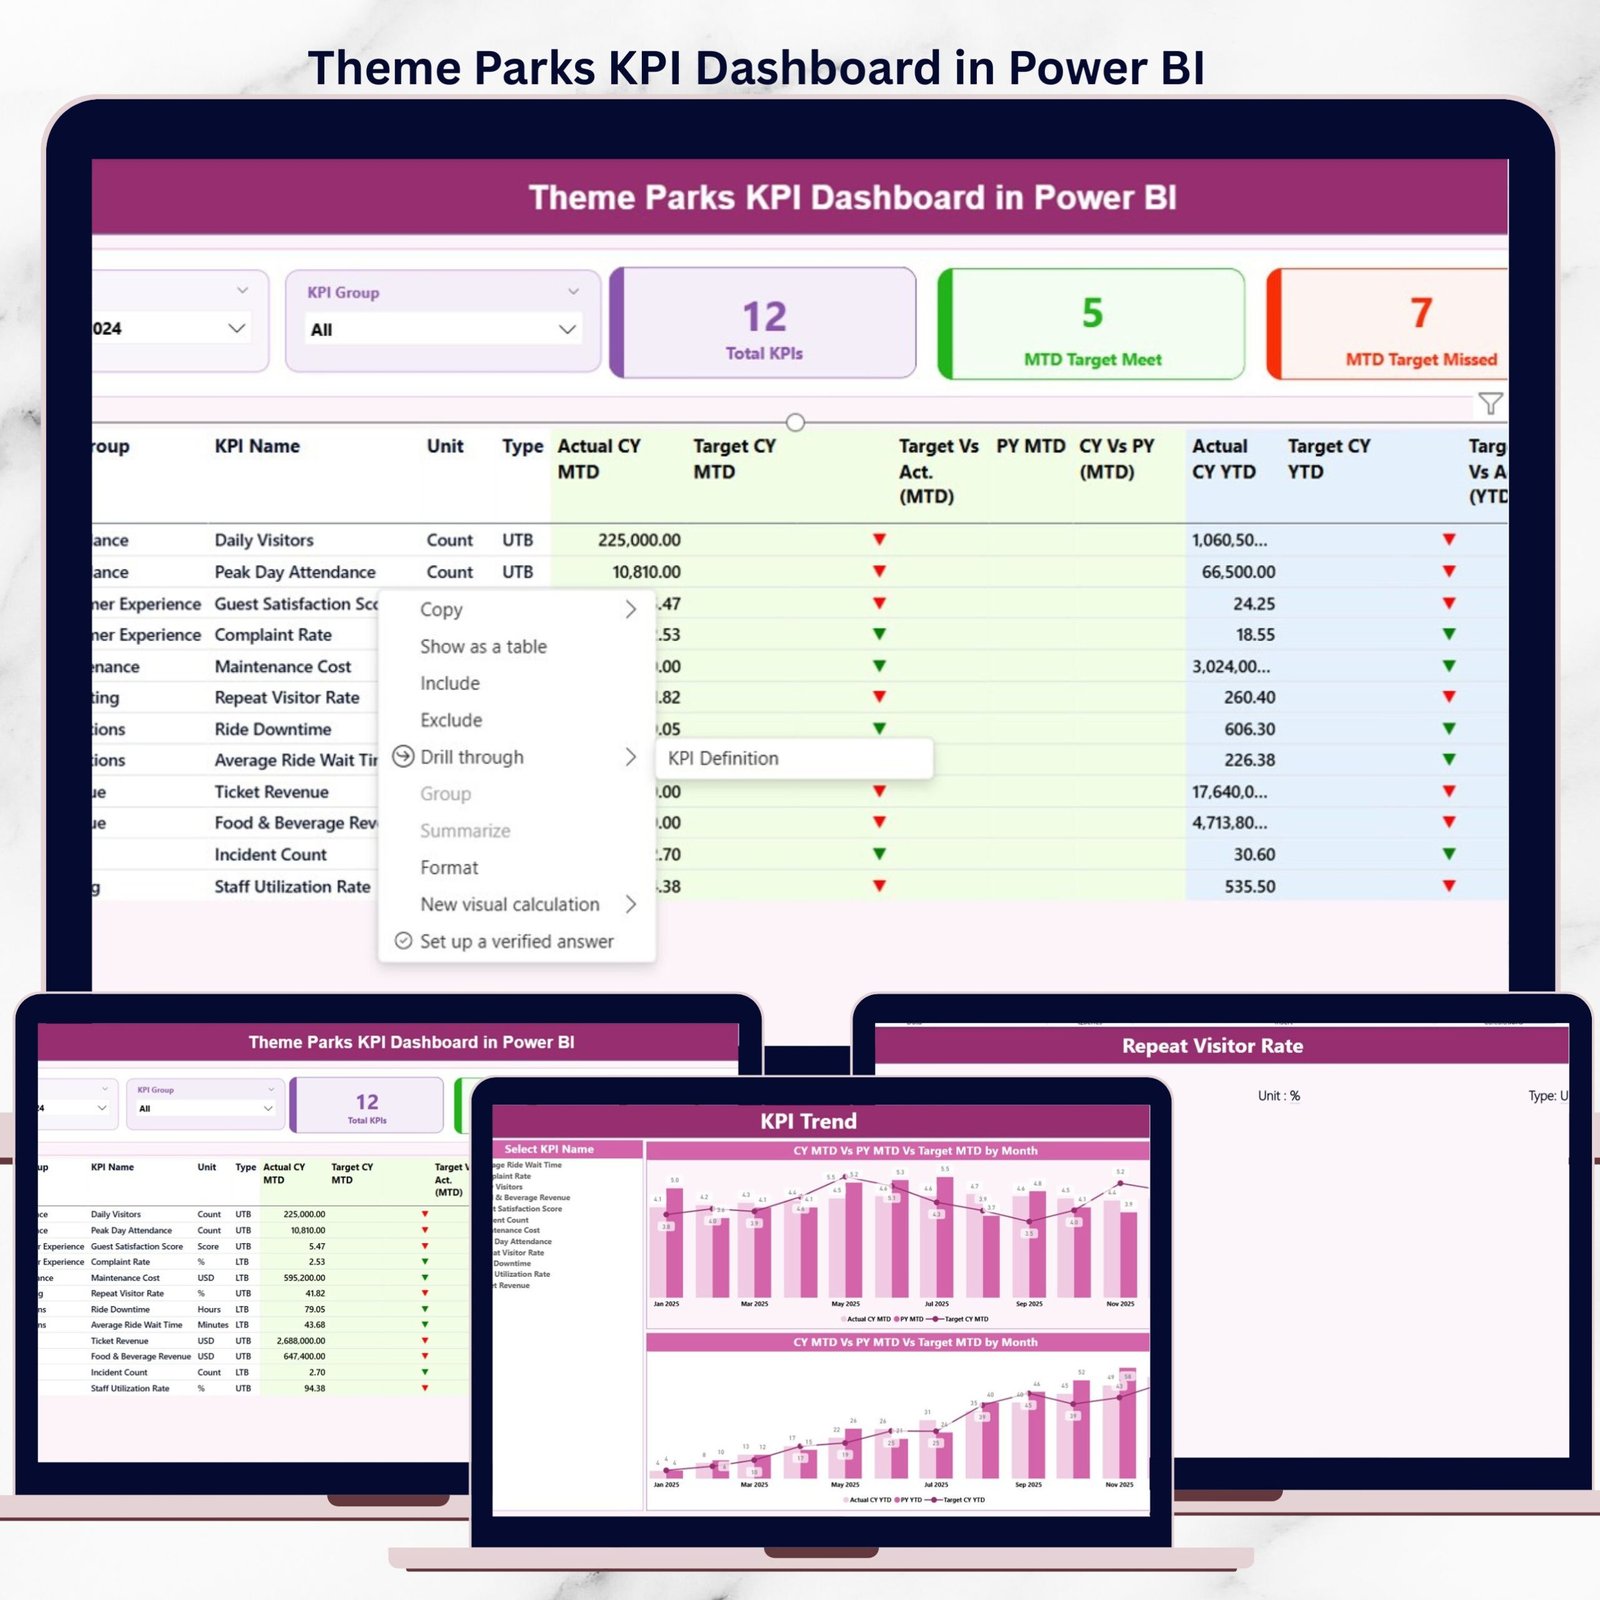
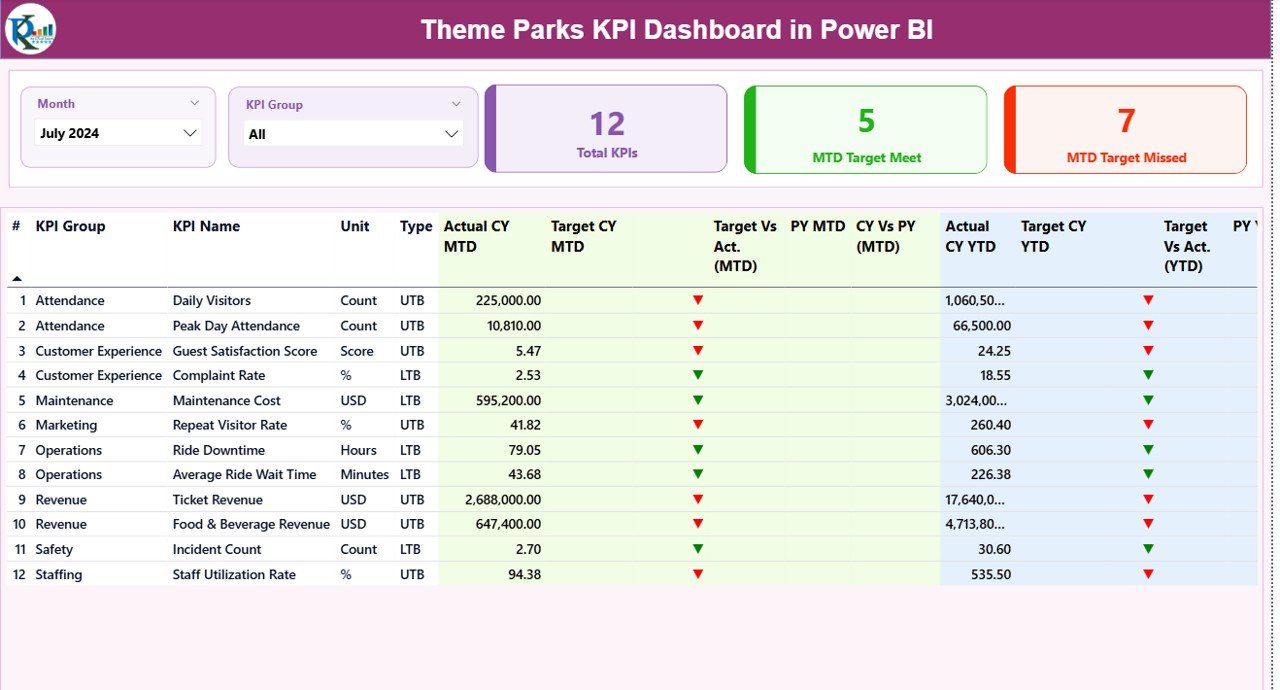
This ready-to-use Power BI dashboard converts raw Excel data into clear, interactive, and actionable insights. It helps theme park owners, operations managers, and analysts monitor KPIs in real time, compare targets vs actuals, and identify underperforming areas instantly—all from one centralized dashboard.
🚀 Key Features of Theme Parks KPI Dashboard in Power BI
🎯 Centralized KPI Monitoring
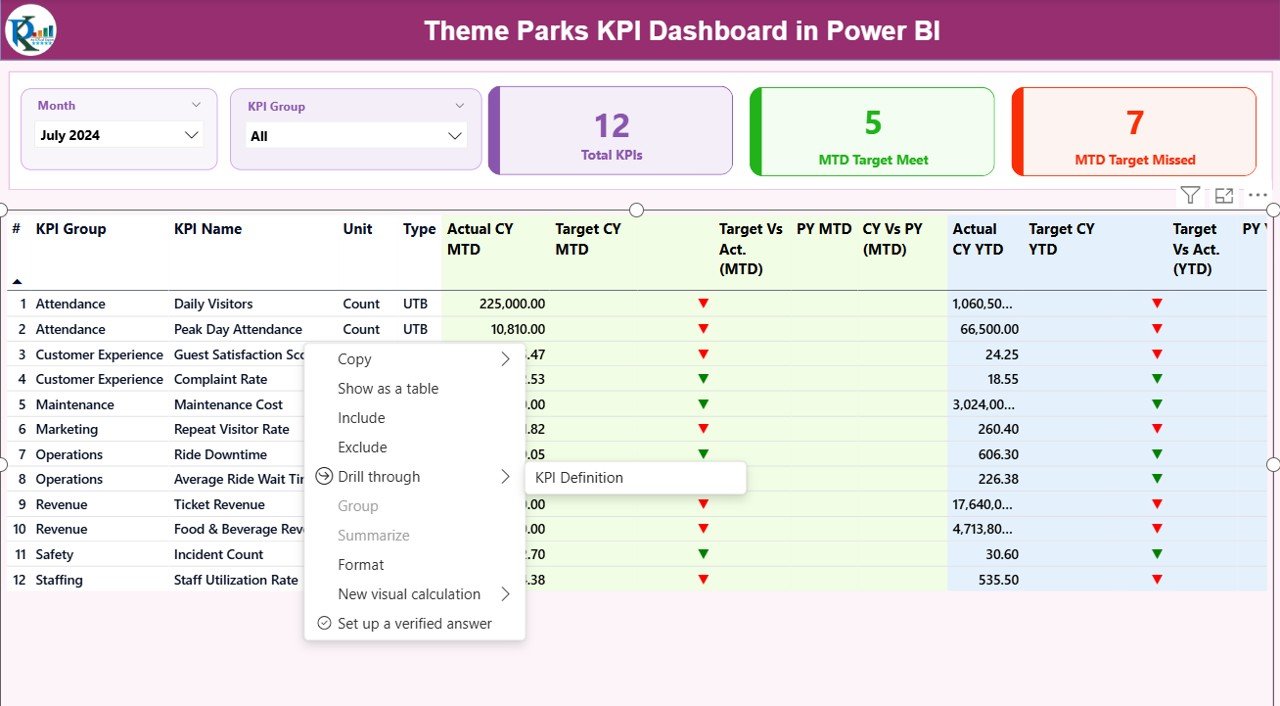
Track all critical theme park KPIs—attendance, operations, efficiency, and performance—from one powerful dashboard instead of multiple reports.
📊 MTD & YTD Performance Tracking
Monitor Month-to-Date and Year-to-Date actuals, targets, and previous year values with automatic variance calculations.
📈 Target vs Actual with Visual Indicators
Instantly identify performance gaps using green and red up/down icons for both MTD and YTD KPIs.
🗂️ KPI Group & Month Slicers
Filter KPIs by month or KPI group to focus on specific departments or time periods.
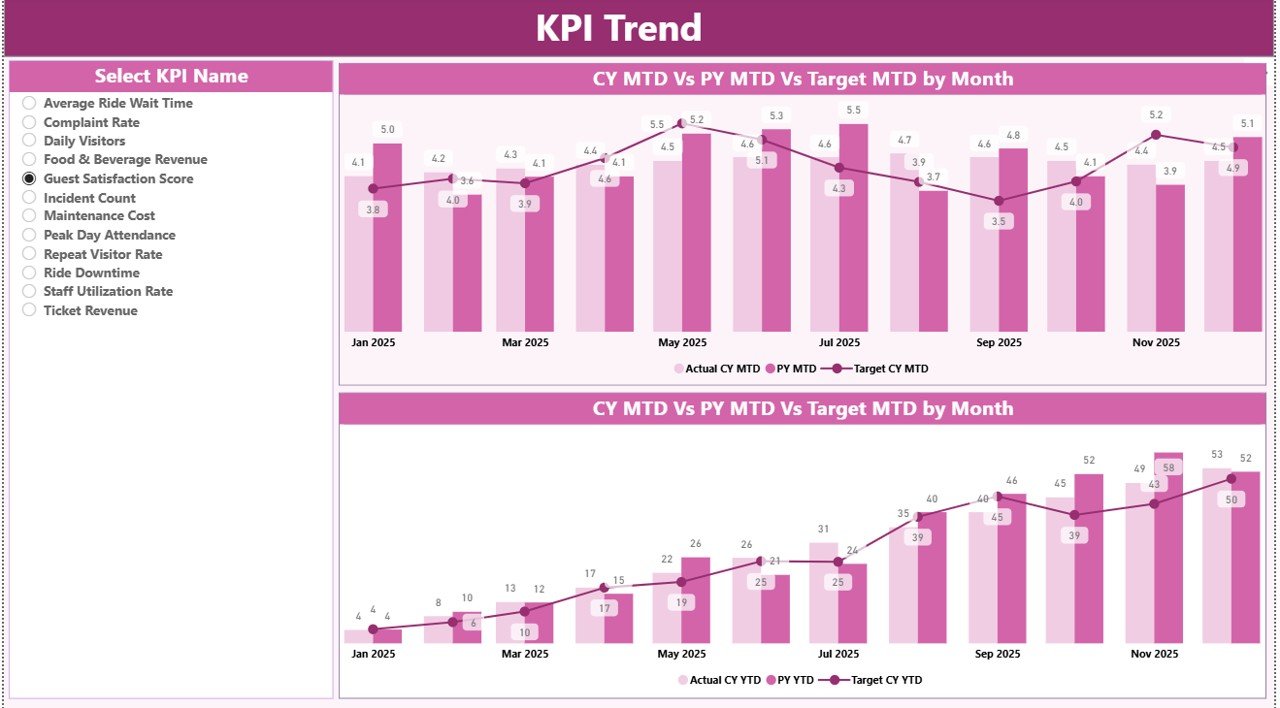
📉 Interactive KPI Trend Analysis
Analyze KPI performance trends over time with dynamic MTD and YTD trend charts.
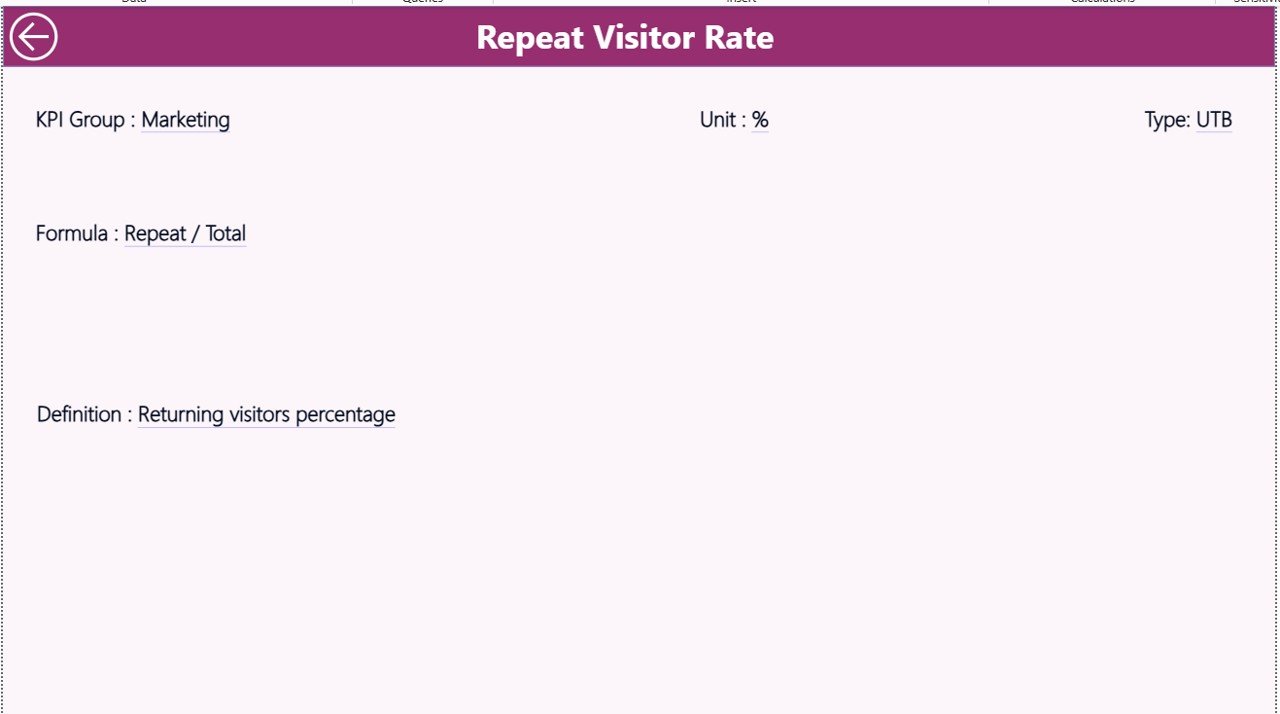
📘 Built-in KPI Definition Page
Ensure clarity and consistency with a detailed KPI definition page covering formulas, units, and KPI types.
📂 Excel-Based Data Source
Easily update data using structured Excel sheets—no advanced Power BI knowledge required.
🔧 Scalable & Customizable Design
Add new KPIs, months, or categories anytime as your theme park grows.
📦 What’s Inside the Theme Parks KPI Dashboard in Power BI
This professionally designed dashboard includes:
✅ Power BI File with 3 Interactive Pages
-
Summary Page (KPI overview with MTD & YTD tracking)
-
KPI Trend Page (MTD & YTD trend analysis)
-
KPI Definition Page (reference guide for all KPIs)
✅ Structured Excel Data Source
-
Input_Actual sheet
-
Input_Target sheet
-
KPI Definition sheet
✅ Pre-Built Calculations
-
Target vs Actual %
-
Current Year vs Previous Year %
-
UTB and LTB logic
✅ User-Friendly Navigation
-
Drill-through functionality
-
Back buttons for easy movement
🛠️ How to Use the Theme Parks KPI Dashboard in Power BI
Using this dashboard is simple and beginner-friendly:
1️⃣ Enter actual performance data in the Input_Actual Excel sheet
2️⃣ Define targets in the Input_Target sheet
3️⃣ Maintain KPI definitions in the KPI Definition sheet
4️⃣ Refresh the Power BI dashboard
5️⃣ Use slicers to analyze KPIs by month or group
That’s it. The dashboard instantly updates all visuals, indicators, and trends.
👥 Who Can Benefit from This Theme Parks KPI Dashboard
🎢 Theme Park Owners & Operators
📊 Operations & Performance Managers
📈 Business Analysts & Data Teams
🧾 Finance & Strategy Teams
🏢 Entertainment & Leisure Management Companies
If you want better visibility, faster decisions, and improved operational control, this dashboard is built for you.
Click here to read the Detailed blog post
Watch the step-by-step video tutorial:


Reviews
There are no reviews yet.