The Web3 industry moves at lightning speed. New blockchain platforms, decentralized applications, and crypto-based services launch every day. However, without clear performance tracking, even the most innovative Web3 initiatives risk losing direction. That is exactly why the Web3 Services KPI Dashboard in Power BI is a must-have solution for modern Web3 teams.
This professionally designed, ready-to-use dashboard transforms complex Web3 performance data into clear, actionable insights. Instead of juggling spreadsheets, manual calculations, and disconnected reports, you get a centralized Power BI dashboard that shows exactly how your Web3 business is performing—month by month and year to date.
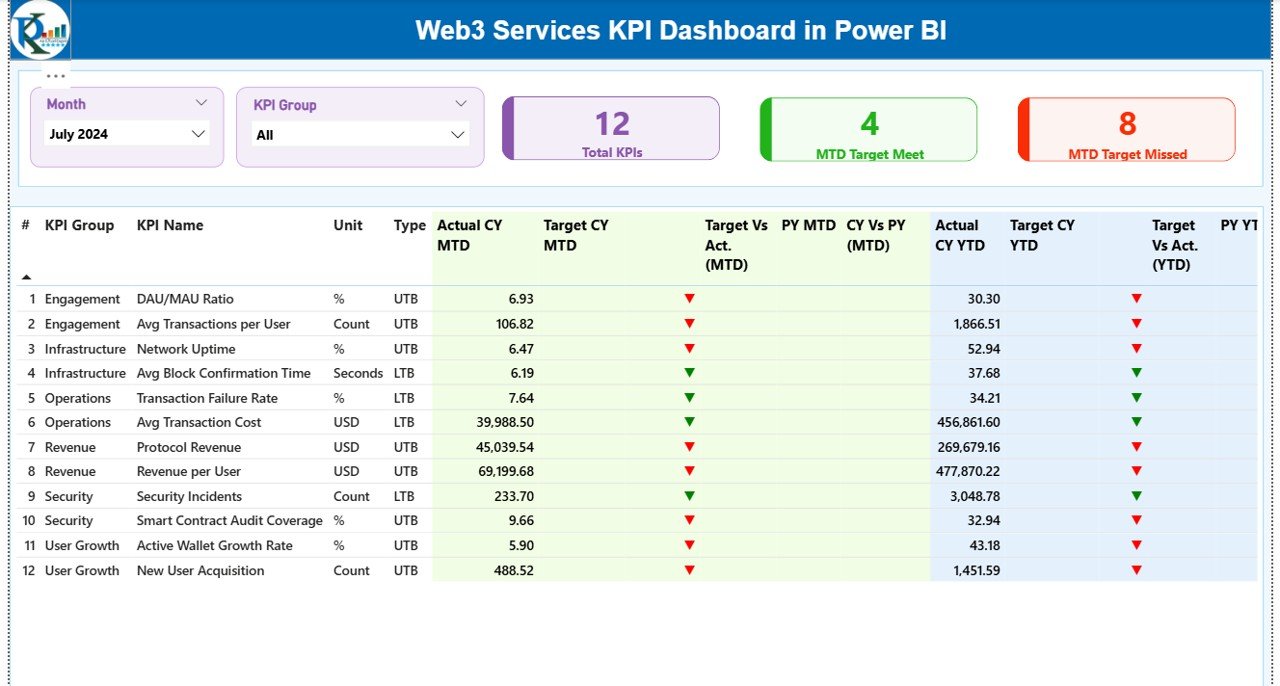
Built on an Excel + Power BI architecture, this dashboard is flexible, scalable, and investor-ready. Whether you manage a blockchain development agency, DeFi platform, NFT marketplace, or Web3 consulting firm, this dashboard gives you clarity, control, and confidence.
## 🚀 Key Features of Web3 Services KPI Dashboard in Power BI
✅ Centralized KPI Monitoring
Track all Web3 service KPIs from a single, interactive Power BI dashboard.
📊 MTD & YTD Performance Tracking
Analyze Month-to-Date and Year-to-Date actuals against targets and previous year performance.
🎯 Target vs Actual Analysis
Instantly identify which KPIs are meeting targets and which need attention using visual indicators.
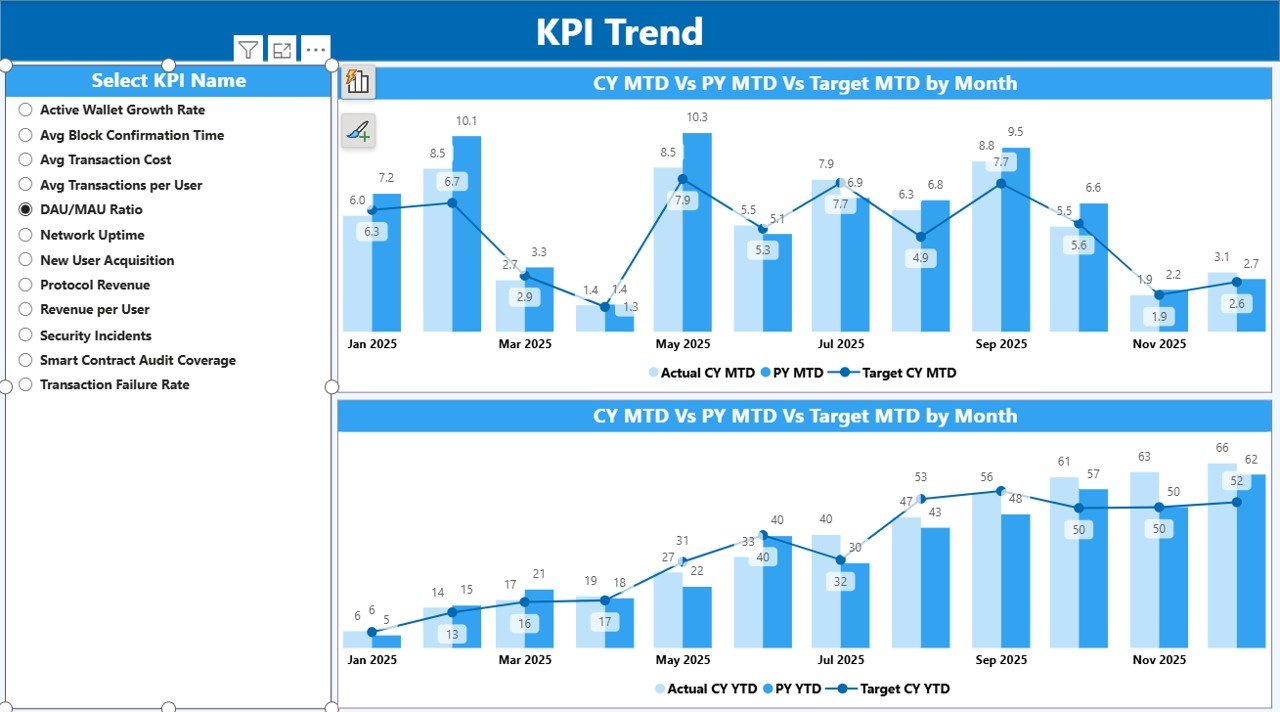
📈 Trend Analysis with Combo Charts
Compare current year actuals, previous year performance, and targets over time.
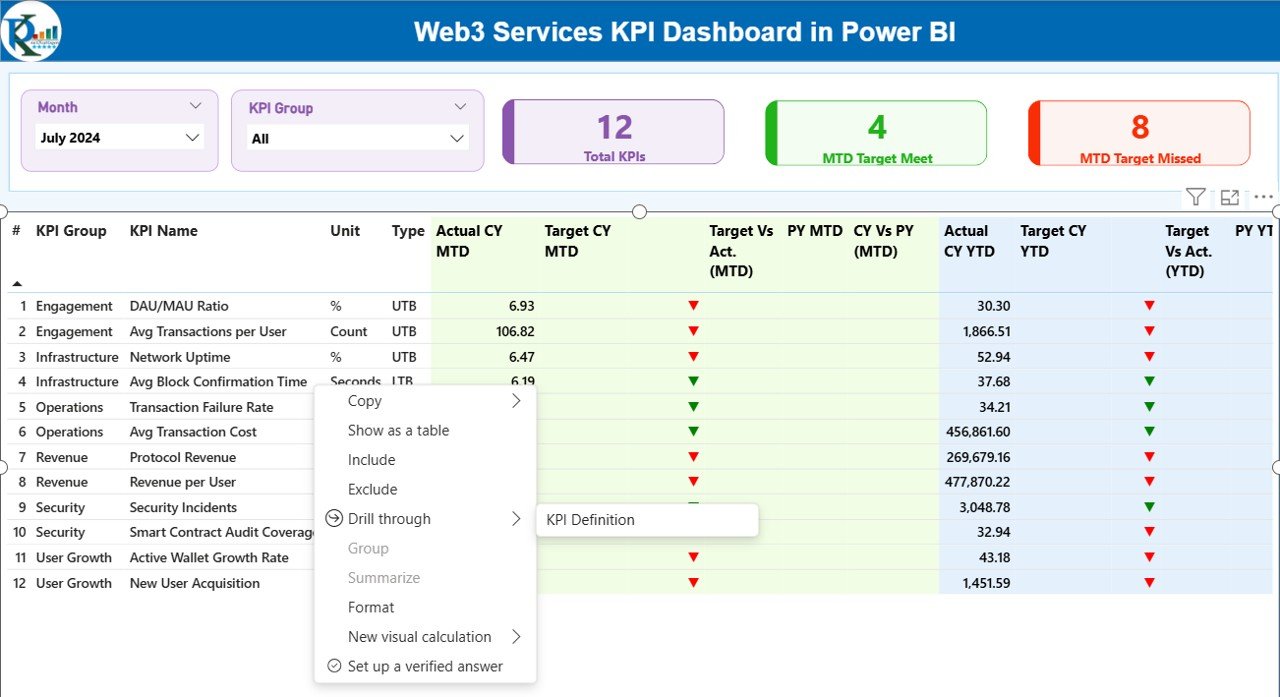
🧠 KPI Definition Drill-Through Page
Ensure complete clarity with detailed KPI formulas, definitions, and logic.
🎛️ Interactive Slicers
Filter results by Month and KPI Group for fast, focused analysis.
📁 Excel-Based Data Input
Easily update actuals and targets without advanced Power BI skills.
💼 Investor-Ready Visual Design
Clean, professional layout ideal for leadership reviews and investor reporting.
## 📦 What’s Inside the Web3 Services KPI Dashboard in Power BI
When you download this product, you receive a fully structured Power BI dashboard connected to an Excel data model that includes:
📌 Input_Actual Sheet – Capture actual KPI performance with MTD and YTD values
📌 Input_Target Sheet – Define monthly and yearly targets for every KPI
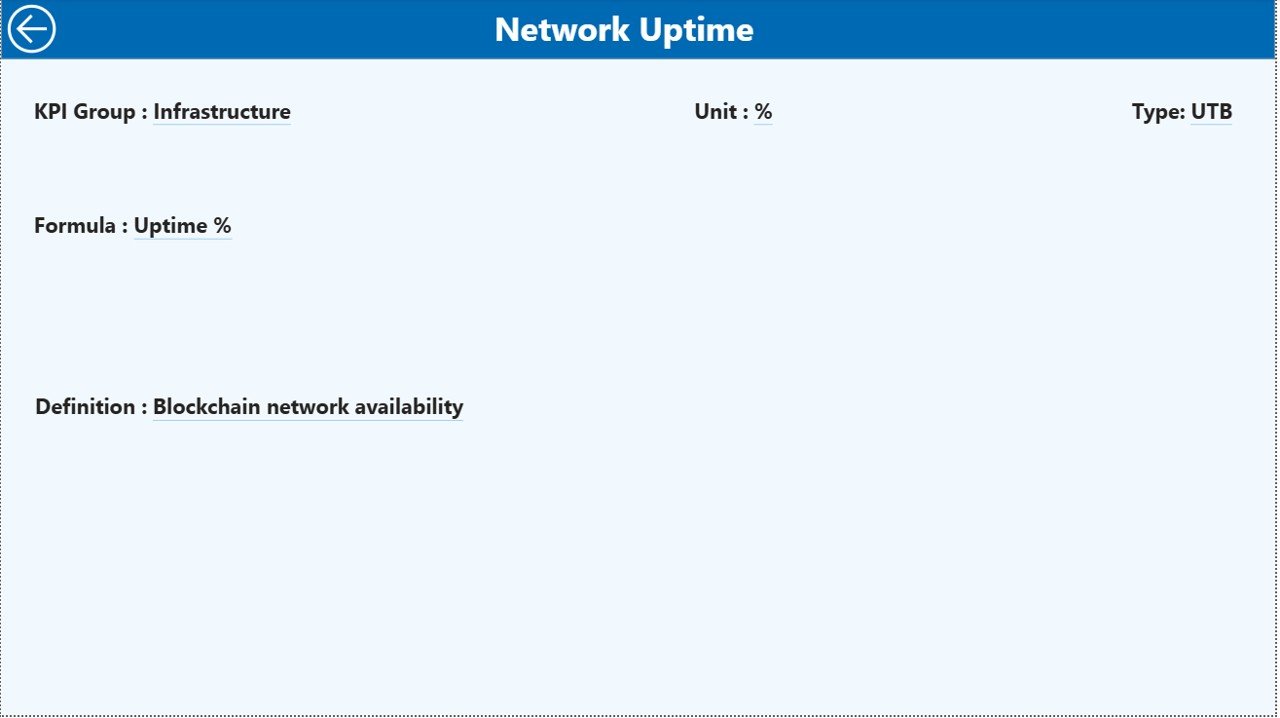
📌 KPI Definition Sheet – Document KPI number, group, unit, formula, and type (LTB/UTB)
Inside Power BI, you get:
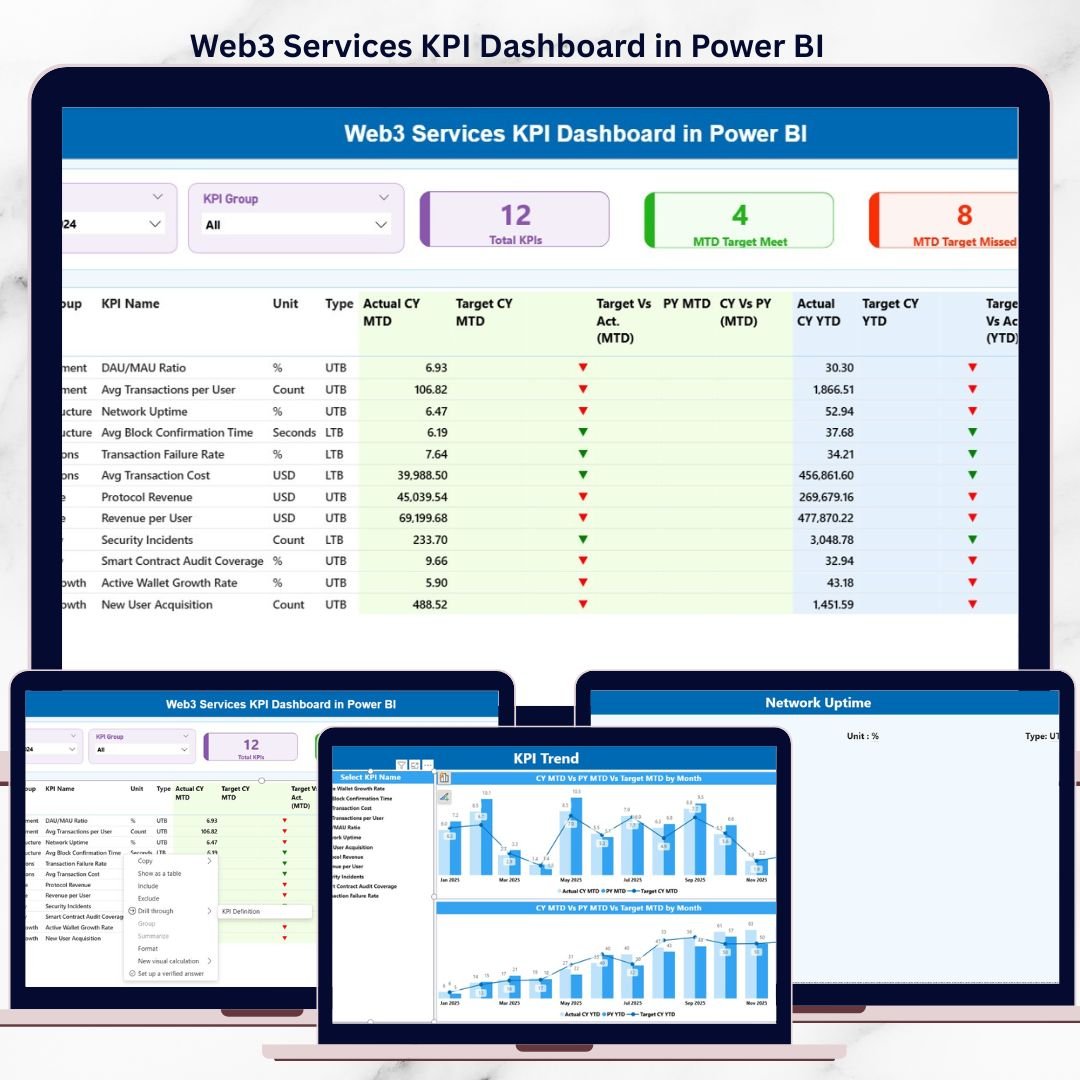
📊 Summary Page – High-level KPI overview with performance cards and a detailed KPI table
📈 KPI Trend Page – Time-based trend analysis with interactive KPI selection
📘 KPI Definition Page – Drill-through reference page for formulas and explanations
This structure ensures transparency, accuracy, and consistency across all reports.
## 🧭 How to Use the Web3 Services KPI Dashboard in Power BI
Using this dashboard is simple and efficient:
1️⃣ Enter actual KPI data into the Input_Actual Excel sheet
2️⃣ Define targets in the Input_Target sheet
3️⃣ Maintain clarity by documenting metrics in the KPI Definition sheet
4️⃣ Refresh the Power BI dashboard
5️⃣ Use slicers, tables, and charts to analyze performance instantly
No advanced Power BI or DAX knowledge is required. Basic Excel skills are enough.
## 🎯 Who Can Benefit from This Web3 Services KPI Dashboard
This dashboard is ideal for:
🚀 Web3 founders and co-founders
🧑💻 Blockchain development agencies
📦 NFT marketplace operators
💰 DeFi and crypto service providers
📊 Web3 product and operations managers
🤝 Web3 consulting firms
📈 Investors and advisors
If your business depends on Web3 performance metrics, this dashboard is built for you.
Click here to read the detailed blog post
Watch the step-by-step video tutorial:


Reviews
There are no reviews yet.