Recruitment agencies work in a highly competitive, target-driven environment where speed, accuracy, and visibility define success. Every day, teams manage candidates, clients, interviews, offers, and revenue. However, when performance data is scattered across spreadsheets, decision-making becomes slow and reactive. That is exactly where the Recruitment Agencies KPI Dashboard in Power BI delivers massive value.
This ready-to-use Power BI dashboard transforms raw Excel data into clear, interactive, and actionable performance insights. Instead of manually preparing reports, recruitment leaders can instantly track MTD and YTD performance, identify gaps, and take corrective action—before targets slip.
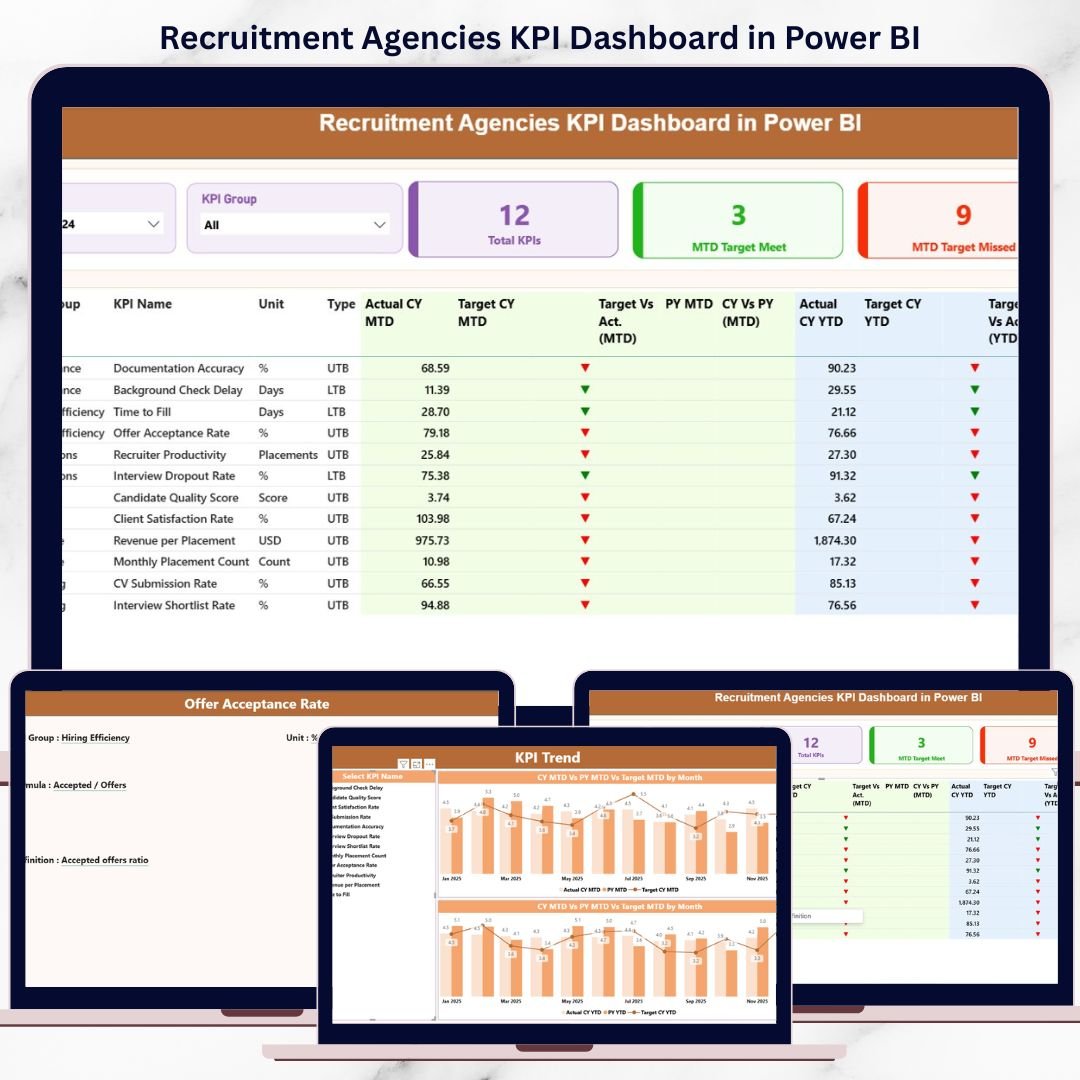
## 🚀 Key Features of Recruitment Agencies KPI Dashboard in Power BI
✨ Interactive Power BI Dashboard with slicers for Month and KPI Group
📊 MTD & YTD performance tracking in one centralized view
🎯 Target vs Actual analysis with clear visual indicators
📈 Current Year vs Previous Year comparison for smarter trend analysis
🔄 Excel-based data input for easy updates and maintenance
🧠 UTB & LTB KPI logic for accurate performance interpretation
⚡ Auto-refresh visuals once Excel data is updated
🔍 Drill-through KPI definitions for clarity and transparency
This dashboard eliminates guesswork and puts performance insights right at your fingertips.
## 📦 What’s Inside the Recruitment Agencies KPI Dashboard
The dashboard is professionally structured into three powerful Power BI pages, each designed for a specific purpose:
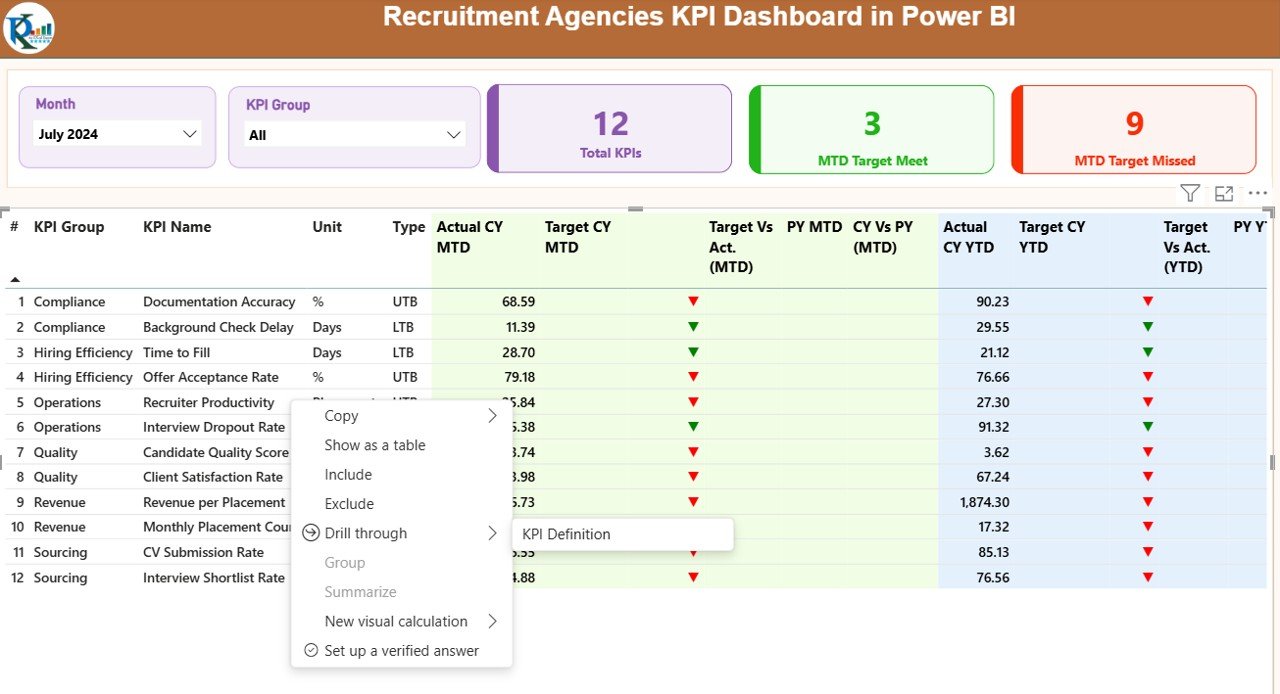
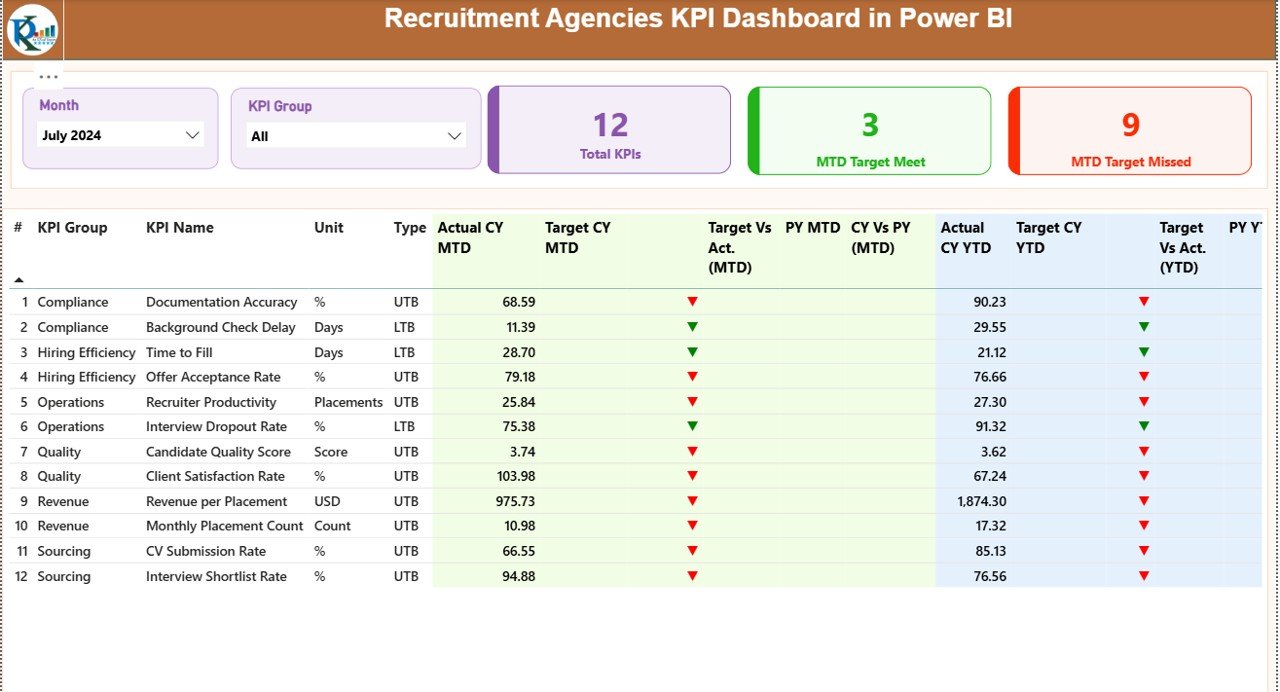
📌 Summary Page
This is the command center of the dashboard. It includes:
-
Month and KPI Group slicers
-
KPI cards showing Total KPIs, MTD Target Met, and MTD Target Missed
-
A detailed KPI table with:
-
MTD & YTD Actuals
-
Targets
-
Previous Year values
-
Conditional icons (green/red ▲▼)
-
Target vs Actual and CY vs PY ratios
-
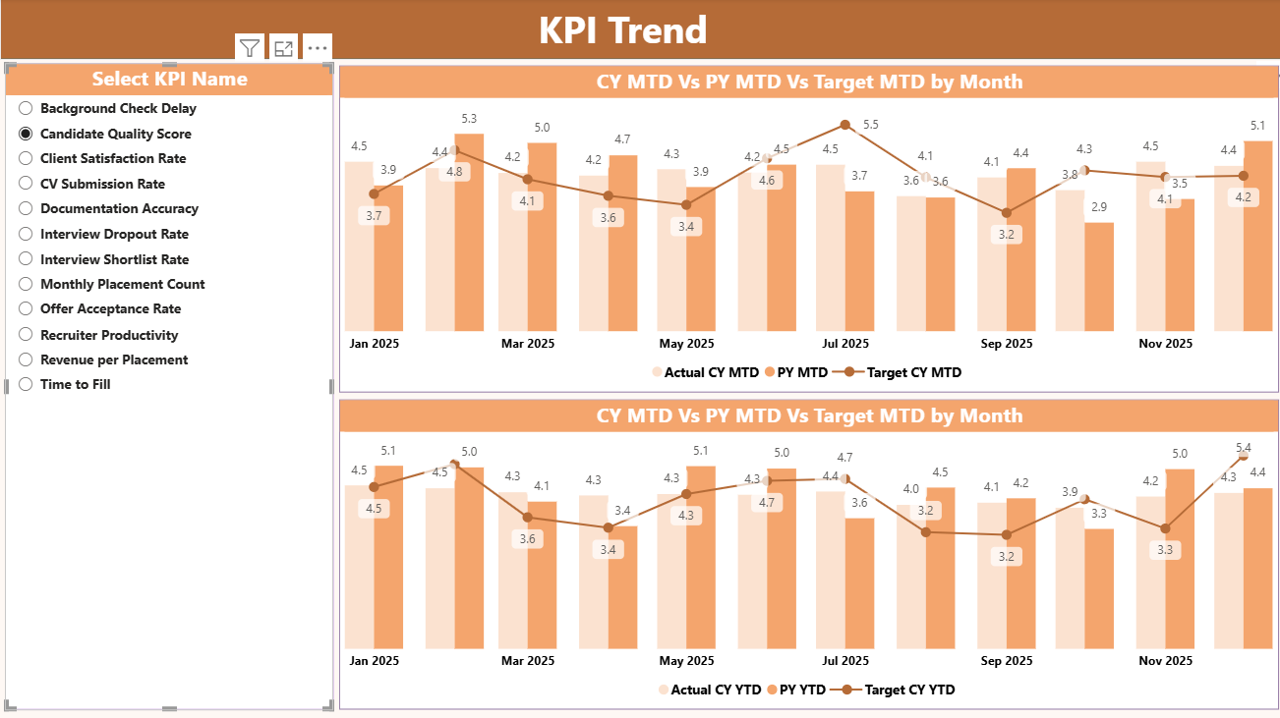
📌 KPI Trend Page
This page focuses on performance movement over time:
-
KPI Name slicer
-
Combo charts comparing:
-
Current Year Actual
-
Previous Year Actual
-
Target values
This helps users quickly identify improving or declining KPIs.
-
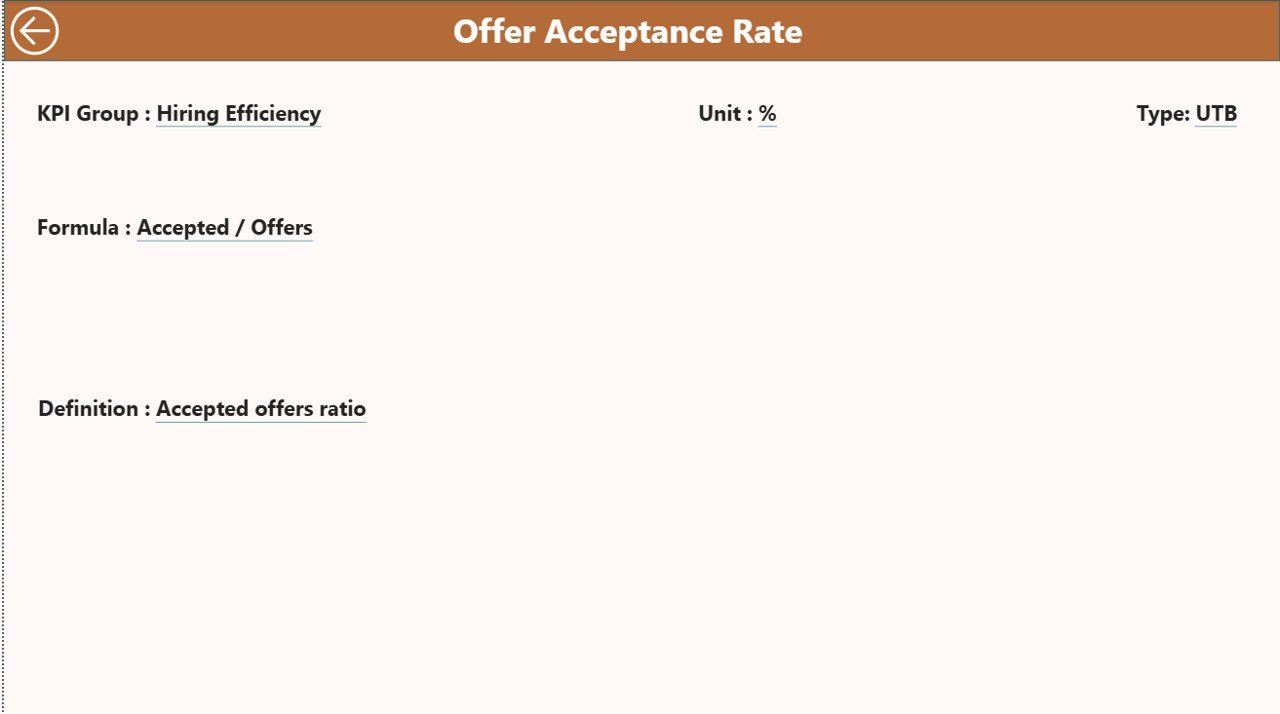
📌 KPI Definition Page
A hidden drill-through page that explains:
-
KPI formula
-
KPI definition
-
Measurement logic
This ensures complete clarity and consistent understanding across teams.
## ⚙️ How to Use the Recruitment Agencies KPI Dashboard
Using this dashboard is simple and efficient:
1️⃣ Update KPI values in the Excel input sheets
2️⃣ Refresh the Power BI file
3️⃣ Select Month and KPI Group using slicers
4️⃣ Analyze KPI cards, tables, and trends
5️⃣ Drill through KPIs for deeper understanding
No complex Power BI development is required. If you can update Excel, you can use this dashboard confidently.
## 👥 Who Can Benefit from This Recruitment Agencies KPI Dashboard
This dashboard is ideal for:
👔 Recruitment Managers – Track recruiter performance and targets
🏢 Staffing Agency Owners – Monitor revenue and operational efficiency
📊 HR & Analytics Teams – Deliver reliable, structured insights
📈 Business Leaders – Drive strategic decisions using real data
🧑💼 Operations Teams – Improve reporting accuracy and speed
Whether you run a small recruitment firm or a large staffing organization, this dashboard scales effortlessly with your growth.
Click here to read the Detailed blog post
Watch the step-by-step video tutorial:
Visit our YouTube channel to learn step-by-step video tutorials:
👉 YouTube.com/@PKAnExcelExpert


Reviews
There are no reviews yet.