Managing railway operations without a clear, centralized reporting system leads to delays, rising costs, and missed improvement opportunities. Railway organizations deal with massive data every day—trips, trains, passengers, freight, stations, zones, and revenue. However, raw data alone does not help unless it turns into meaningful insights.
That is exactly where the Railways Dashboard in Excel becomes a powerful, practical, and cost-effective solution.
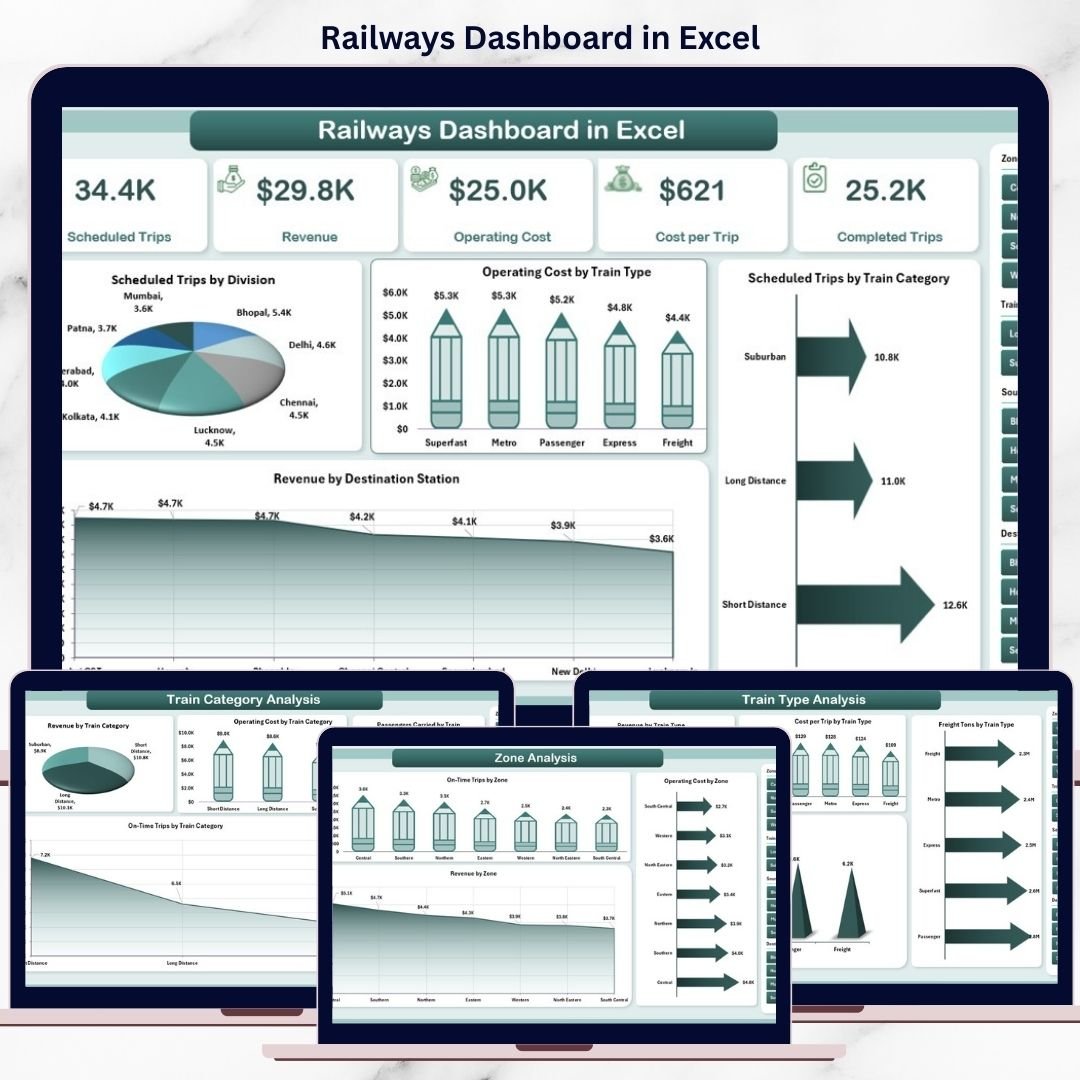
This ready-to-use Excel dashboard converts complex railway data into interactive charts, KPIs, and slicer-based analysis. Instead of reviewing multiple reports or static sheets, decision-makers get a single, visual control panel to monitor performance instantly.
Whether you manage railway operations, planning, finance, logistics, or passenger services, this dashboard helps you track efficiency, control costs, and improve service quality with confidence.
🚀 Key Features of Railways Dashboard in Excel
📊 Centralized Railway Reporting – All operational metrics in one Excel file
🚆 Train Type & Category Analysis – Compare performance across train segments
💰 Cost & Revenue Tracking – Identify cost-heavy and high-revenue areas
👥 Passenger & Freight Insights – Monitor movement patterns clearly
📍 Station & Zone Performance – Evaluate source stations and zones
📅 Interactive Slicers – Filter instantly by zone, division, train type, or category
🧭 Page Navigator – One-click navigation across dashboard pages
⚡ Auto-Updating Visuals – Charts refresh automatically with data updates
📦 What’s Inside the Railways Dashboard in Excel
This dashboard includes 5 structured analytical pages, supported by Data and Support sheets for smooth performance.
🔹 Overview Page
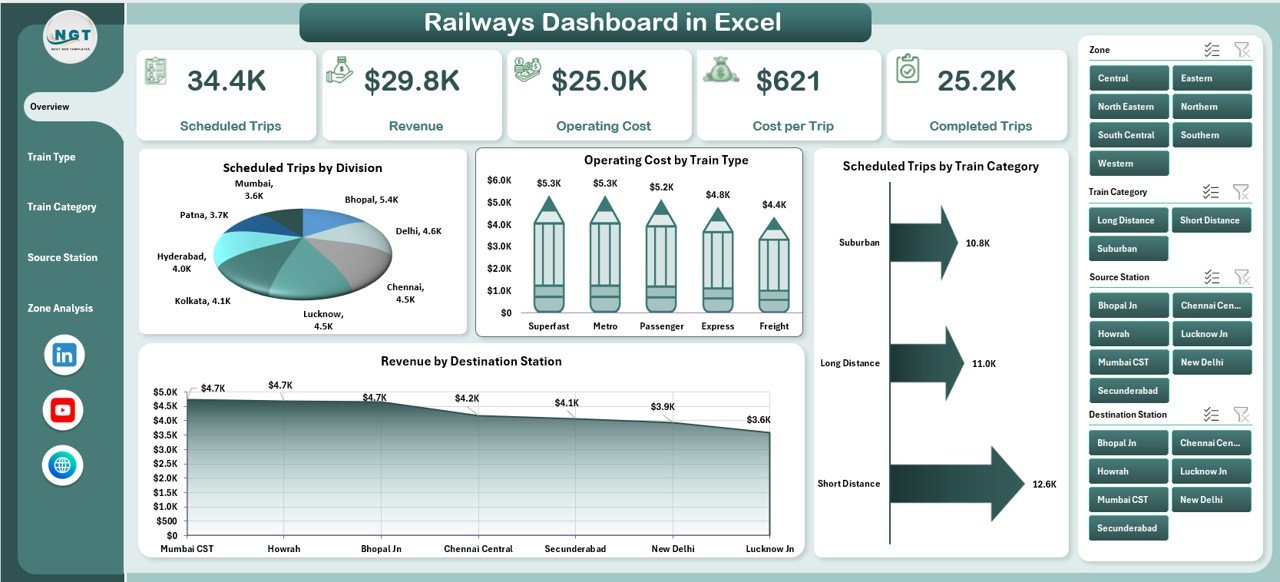
The executive summary that provides instant clarity using:
-
Scheduled Trips by Division
-
Operating Cost by Train Type
-
Scheduled Trips by Train Category
-
Revenue by Destination Station
Perfect for senior management reviews and quick decision-making.
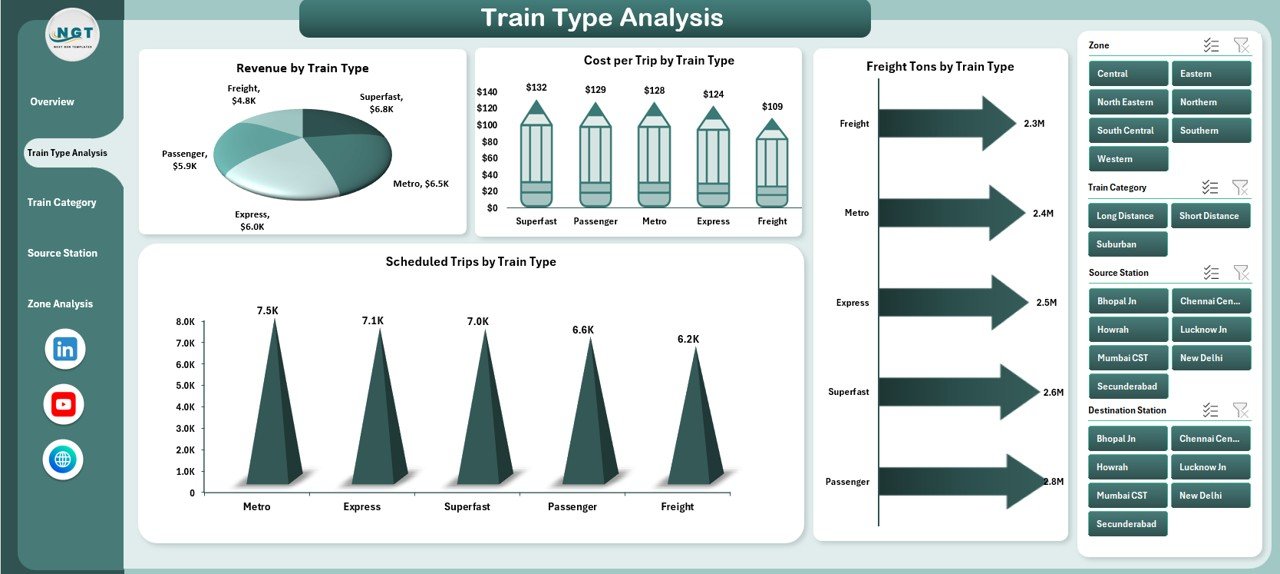
🔹 Train Type Analysis Page
Focuses on train-wise performance:
-
Revenue by Train Type
-
Cost per Trip by Train Type
-
Freight Tons by Train Type
-
Scheduled Trips by Train Type
Helps optimize pricing, utilization, and resource allocation.
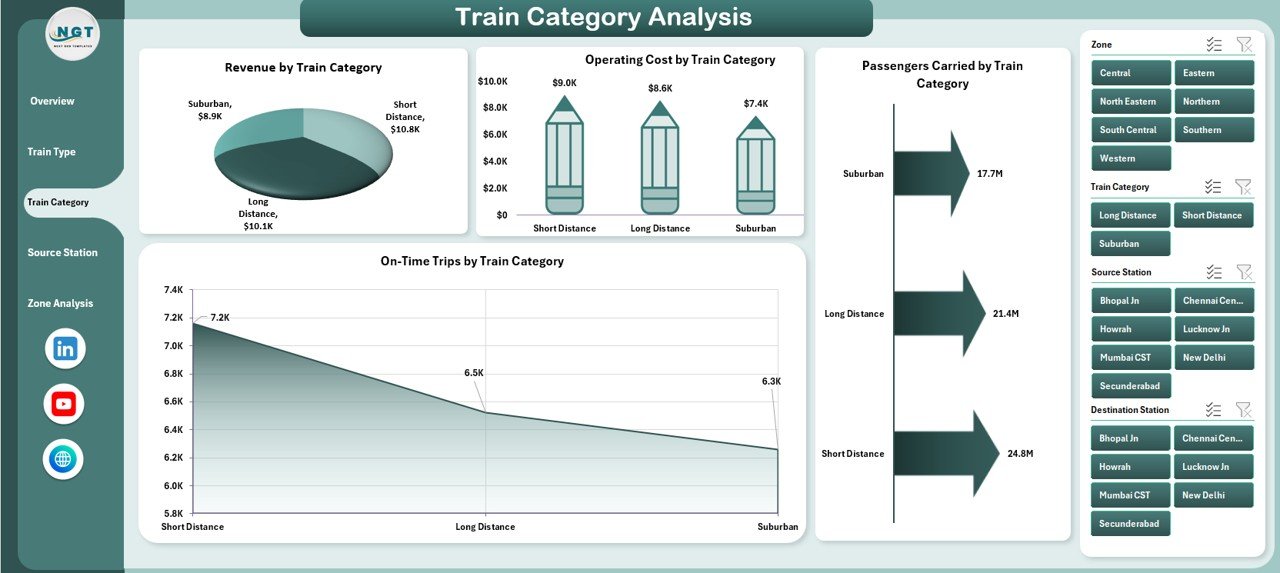
🔹 Train Category Analysis Page
Evaluates performance across categories:
-
Revenue by Train Category
-
Operating Cost by Train Category
-
Passengers Carried by Category
-
On-Time Trips by Category
Balances profitability with service quality.
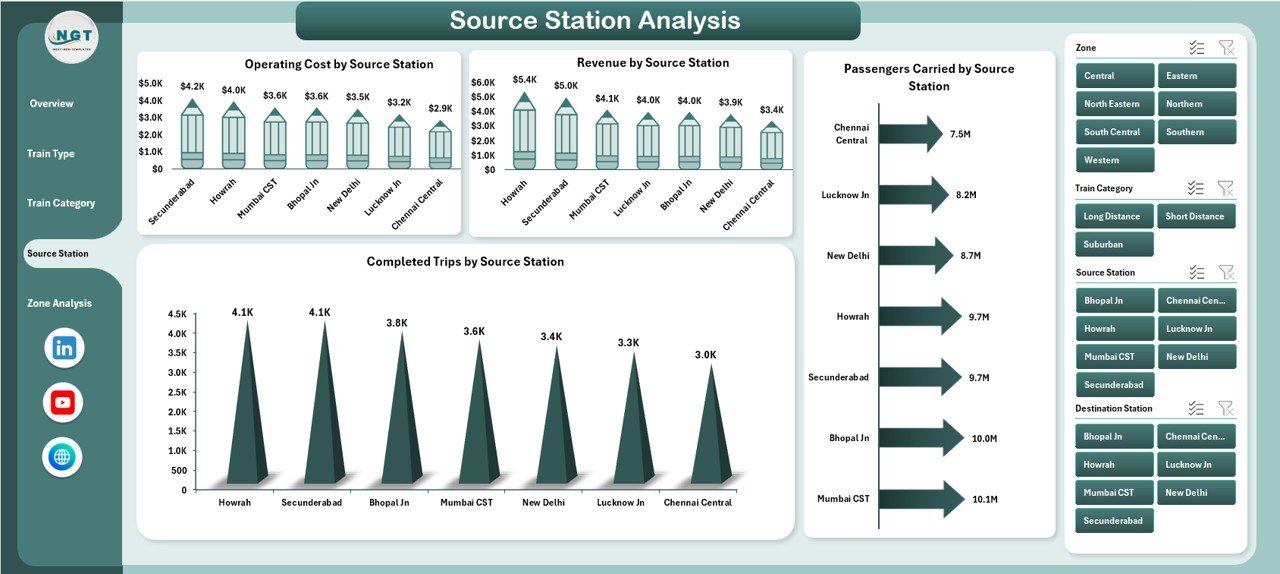
🔹 Source Station Analysis Page
Provides station-level insights:
-
Operating Cost by Source Station
-
Revenue by Source Station
-
Passengers Carried by Source Station
-
Completed Trips by Source Station
Supports station planning and infrastructure decisions.
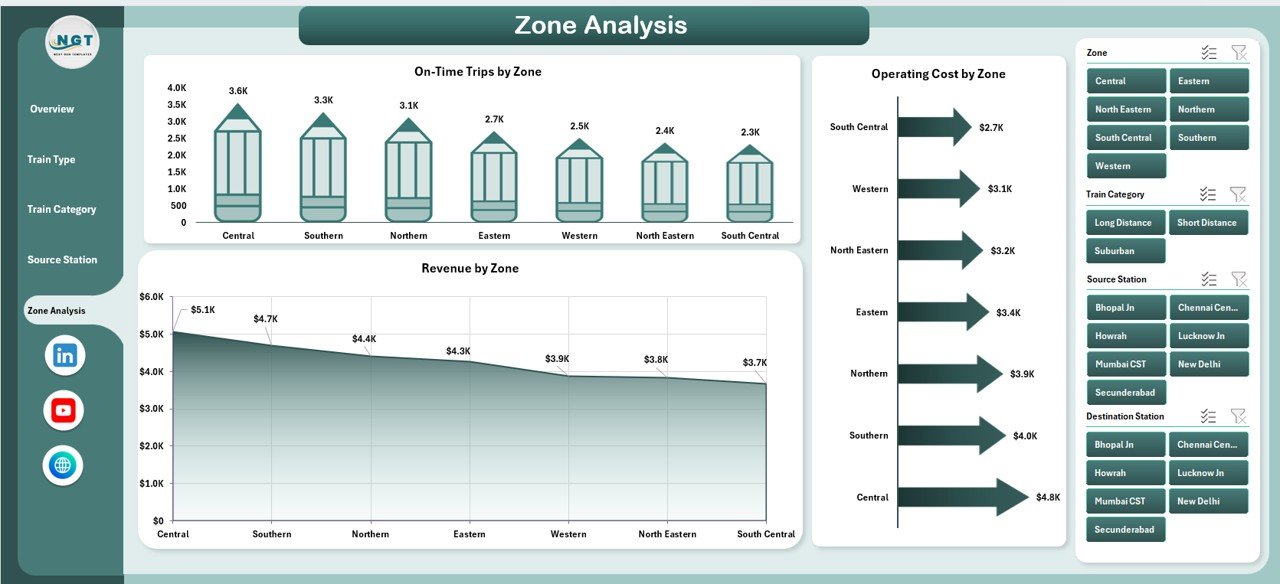
🔹 Zone Analysis Page
Compares zone-wise performance:
-
On-Time Trips by Zone
-
Operating Cost by Zone
-
Revenue by Zone
Ideal for policy decisions and funding allocation.
🧠 How to Use the Railways Dashboard in Excel
1️⃣ Update railway data in the Data Sheet
2️⃣ Refresh pivot tables (if required)
3️⃣ Use right-side slicers to filter insights
4️⃣ Navigate pages using the Page Navigator
5️⃣ Review charts and KPIs for actionable insights
No advanced Excel skills required—basic Excel knowledge is enough.
👥 Who Can Benefit from This Dashboard?
🚆 Railway Operations Managers – Track efficiency and delays
📊 Zonal & Divisional Heads – Compare performance across regions
💰 Finance & Cost Controllers – Monitor costs and revenue
📦 Freight & Logistics Teams – Analyze load and movement
👥 Passenger Services Teams – Improve service quality
🏛️ Government & Regulatory Bodies – Support planning and reporting
This dashboard works for public railways, metro systems, and transport authorities.
### 👉 Click here to read the Detailed Blog Post
🎥 Visit our YouTube channel to learn step-by-step video tutorials
https://www.youtube.com/@PKAnExcelExpert


Reviews
There are no reviews yet.