In today’s sustainability-driven business environment, ESG performance is no longer optional. Investors, regulators, customers, and leadership teams expect clear, measurable, and transparent ESG reporting—not scattered spreadsheets or manual reports. However, raw ESG data alone does not create value unless it is converted into meaningful insights.
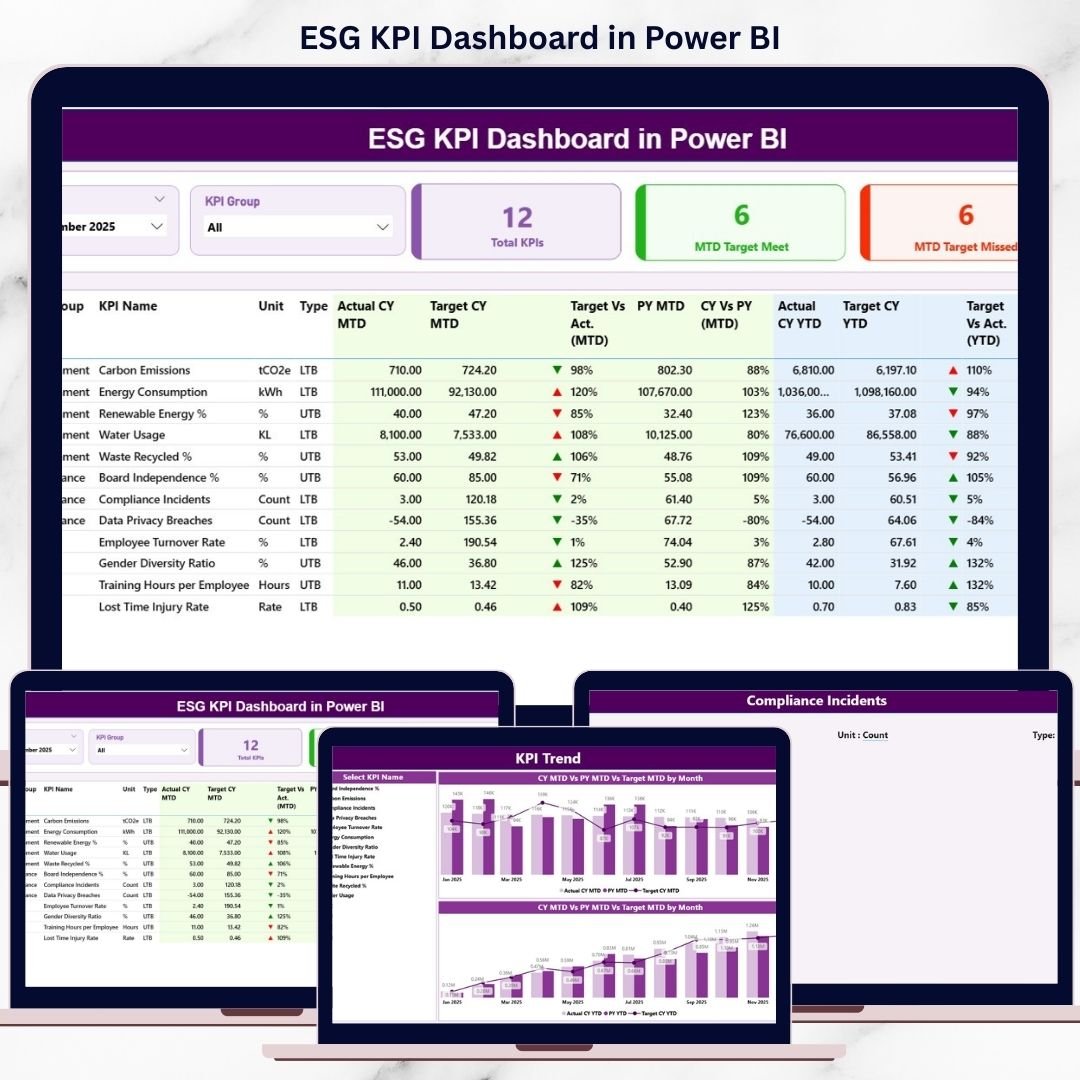
The ESG KPI Dashboard in Power BI is a ready-to-use, interactive reporting solution designed to help organizations track, analyze, and monitor Environmental, Social, and Governance performance in one centralized Power BI dashboard. Instead of managing ESG data across multiple Excel files, this dashboard transforms structured Excel inputs into dynamic visuals, KPI cards, indicators, tables, and trend charts.
As a result, organizations gain clarity, control, and confidence in ESG decision-making.
🚀 Key Features of ESG KPI Dashboard in Power BI
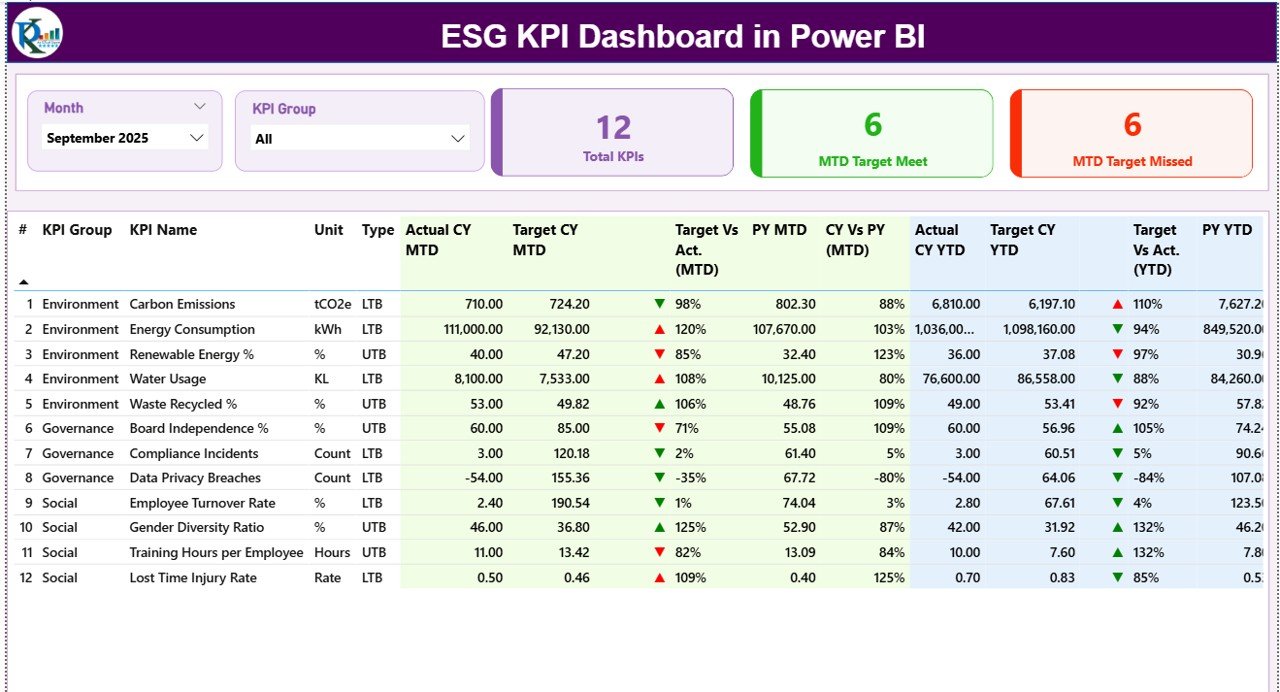
📊 Centralized ESG Performance Tracking – One dashboard for all ESG KPIs
🎯 MTD & YTD Monitoring – Track Month-to-Date and Year-to-Date performance
📈 Target vs Actual Comparison – Instantly identify gaps and achievements
🔄 Current Year vs Previous Year Analysis – Measure ESG progress over time
🧭 Interactive Slicers – Filter by Month and ESG KPI Group
🚦 Performance Status Indicators – Green / Red arrows for quick insights
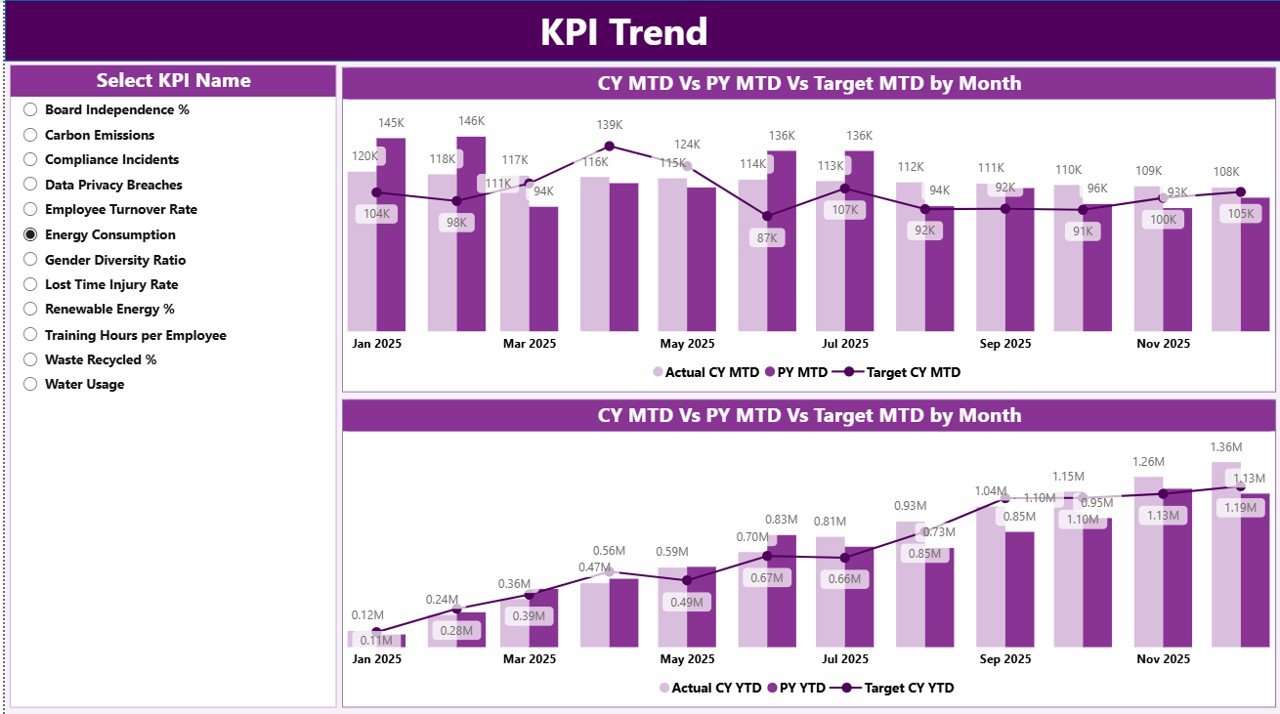
📉 KPI Trend Analysis – Visual trend comparison with targets and PY data
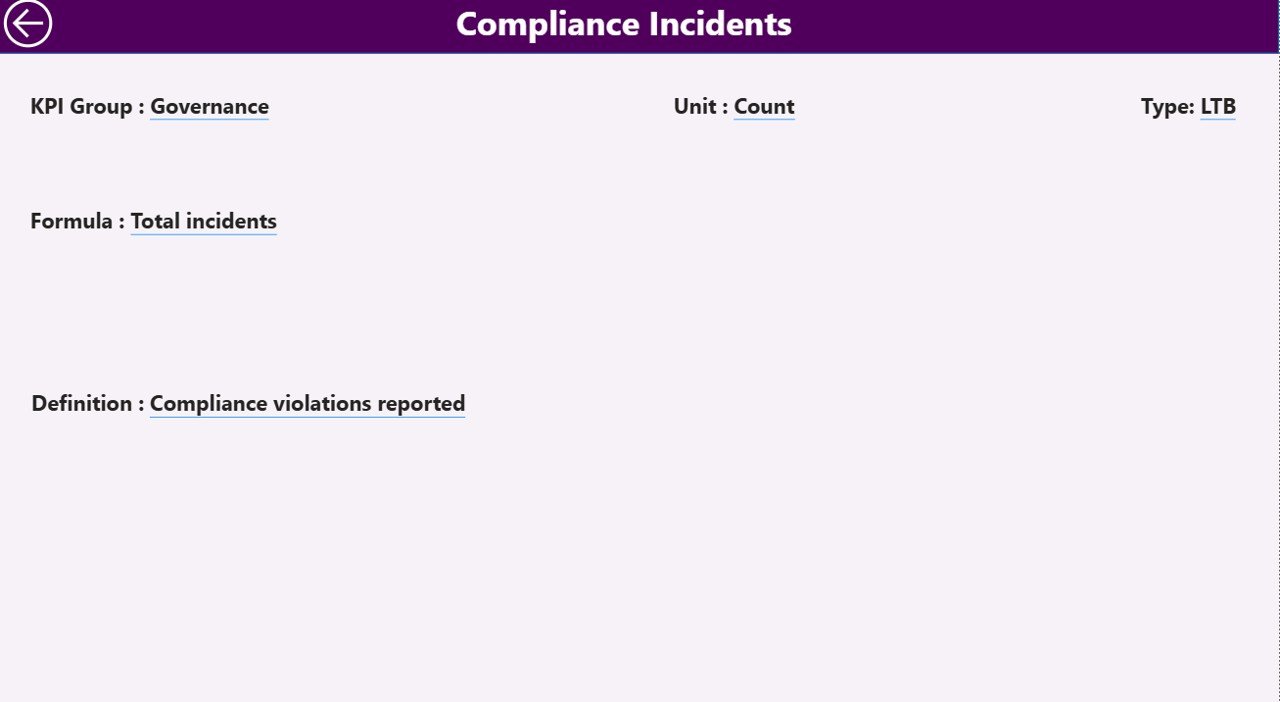
📘 Drill-Through KPI Definition Page – Full clarity on KPI logic
⚡ Excel-Based Data Input – Simple updates, automatic Power BI refresh
📦 What’s Inside the ESG KPI Dashboard in Power BI
📁 Power BI (.pbix) Dashboard File
📊 Summary Page – ESG performance snapshot with KPI cards and detailed table
📈 KPI Trend Page – MTD and YTD trend comparison charts
📘 KPI Definition Page – Drill-through page for formulas and definitions
📄 Excel Data Source Structure, including:
-
Input_Actual Sheet
-
Input_Target Sheet
-
KPI Definition Sheet
This dashboard is designed to be scalable, audit-friendly, and leadership-ready.
🧠 How to Use the ESG KPI Dashboard in Power BI
1️⃣ Enter actual ESG values in the Input_Actual Excel sheet
2️⃣ Define ESG targets in the Input_Target sheet
3️⃣ Maintain KPI logic in the KPI Definition sheet
4️⃣ Refresh the Power BI dashboard
5️⃣ Use Month and KPI Group slicers to filter insights
6️⃣ Review KPI cards, tables, and trend charts
7️⃣ Drill through to understand KPI formulas and definitions
No advanced Power BI expertise is required. If you can update Excel data, you can use this dashboard.
👥 Who Can Benefit from This ESG KPI Dashboard
🌍 Sustainability & ESG Teams – Monitor ESG commitments and progress
📊 ESG Managers & Analysts – Track performance trends and gaps
🛡 Compliance & Risk Teams – Improve audit and disclosure readiness
🏢 Senior Leadership & Boards – Get high-level ESG visibility
💼 Investors & Consultants – Review structured ESG performance insights
This dashboard suits small organizations, large enterprises, and ESG-focused consultants.
### 👉 Click here to read the Detailed Blog Post
🎥 Visit our YouTube channel to learn step-by-step video tutorials
https://www.youtube.com/@PKAnExcelExpert


Reviews
There are no reviews yet.