In today’s competitive digital learning industry, running an EdTech business without clear performance visibility is like flying blind. You may have enrollment numbers, revenue figures, completion rates, and learner feedback—but without a structured system, turning this data into decisions becomes difficult.
That is exactly why the EdTech Dashboard in Excel is a powerful, ready-to-use solution for modern education businesses.
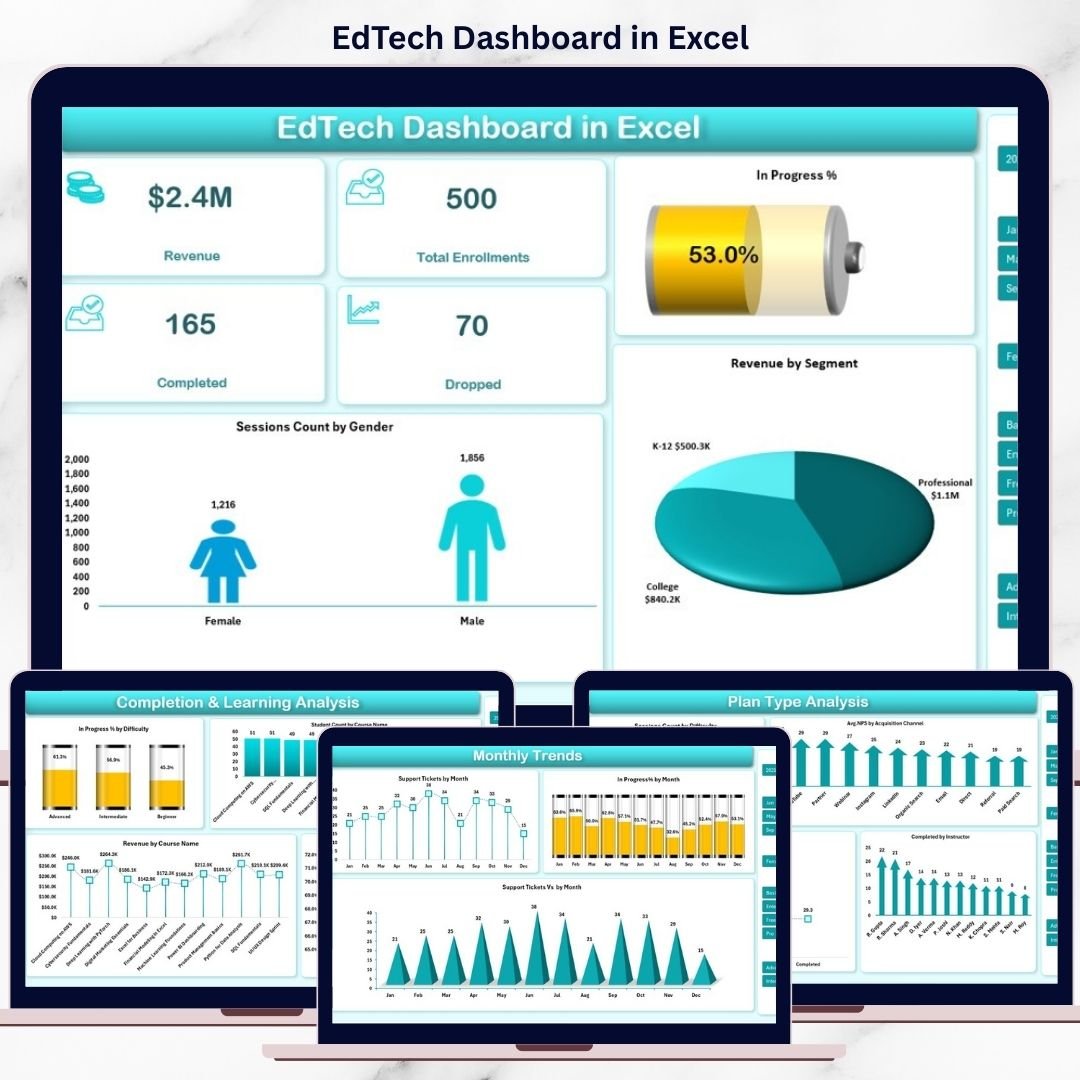
This professionally designed Excel dashboard helps you track, analyze, and visualize every critical EdTech metric in one centralized file. Instead of switching between multiple reports and tools, you get instant insights through interactive charts, KPI cards, and trend analysis—without coding or complex setups.
Whether you manage an online course platform, training institute, or digital learning startup, this dashboard gives you clarity, control, and confidence.
## 🚀 Key Features of EdTech Dashboard in Excel
📊 Complete Business & Learning Snapshot
Track revenue, enrollments, completions, dropouts, and in-progress learners from a single dashboard view.
🎯 Multi-Dimensional Performance Analysis
Analyze performance by course, difficulty level, segment, instructor, plan type, and month.
📈 Interactive Charts & KPI Cards
Visual KPIs and dynamic charts update instantly based on your data.
🔍 Difficulty-Wise Learning Insights
Identify where learners struggle or succeed using in-progress and completion analysis.
💡 Revenue & Growth Visibility
Understand which courses, plans, and segments drive the highest revenue.
🧠 Engagement & Satisfaction Tracking
Monitor quiz attempts, session minutes, NPS scores, and support tickets.
🛠 100% Excel-Based & Customizable
No external tools required. Fully editable to match your business needs.
## 📂 What’s Inside the EdTech Dashboard in Excel
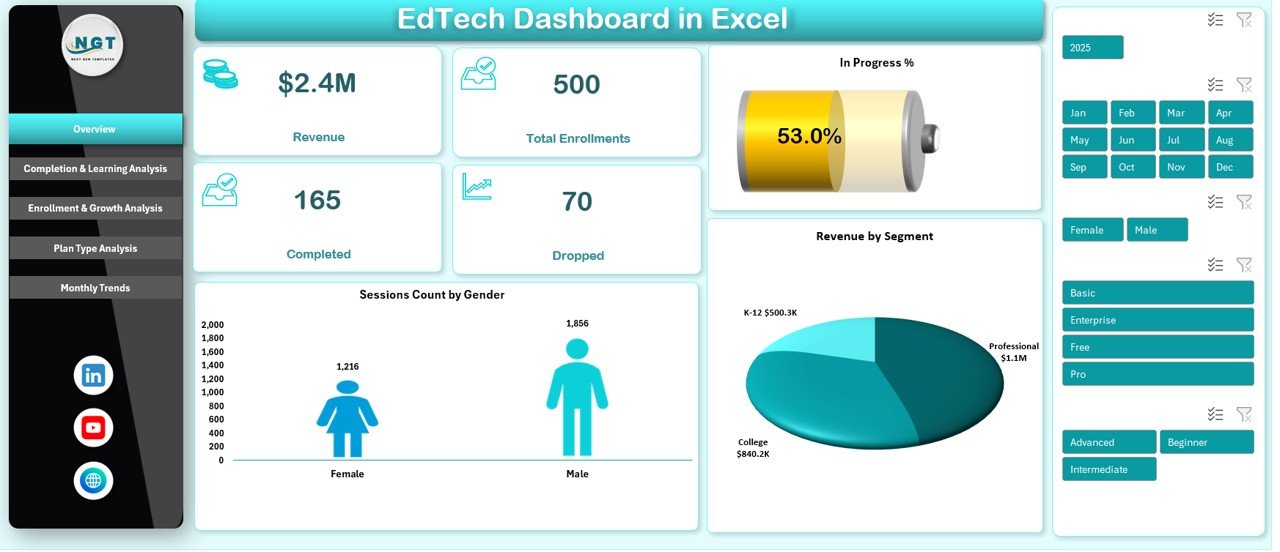
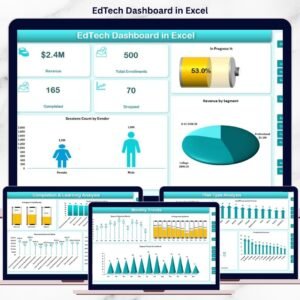
📌 Overview Sheet
Get a high-level snapshot of revenue, enrollments, completions, dropouts, and in-progress percentage—perfect for leadership reviews.
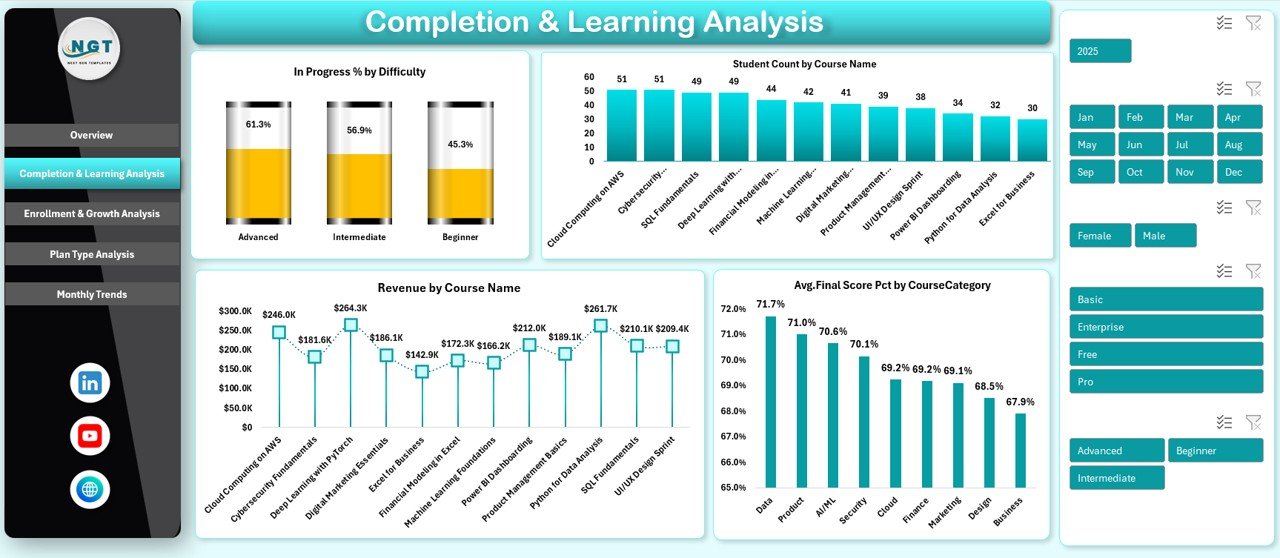
📌 Completion & Learning Analysis Sheet
Track student count by course, revenue by course, and average final scores by category to measure academic effectiveness.
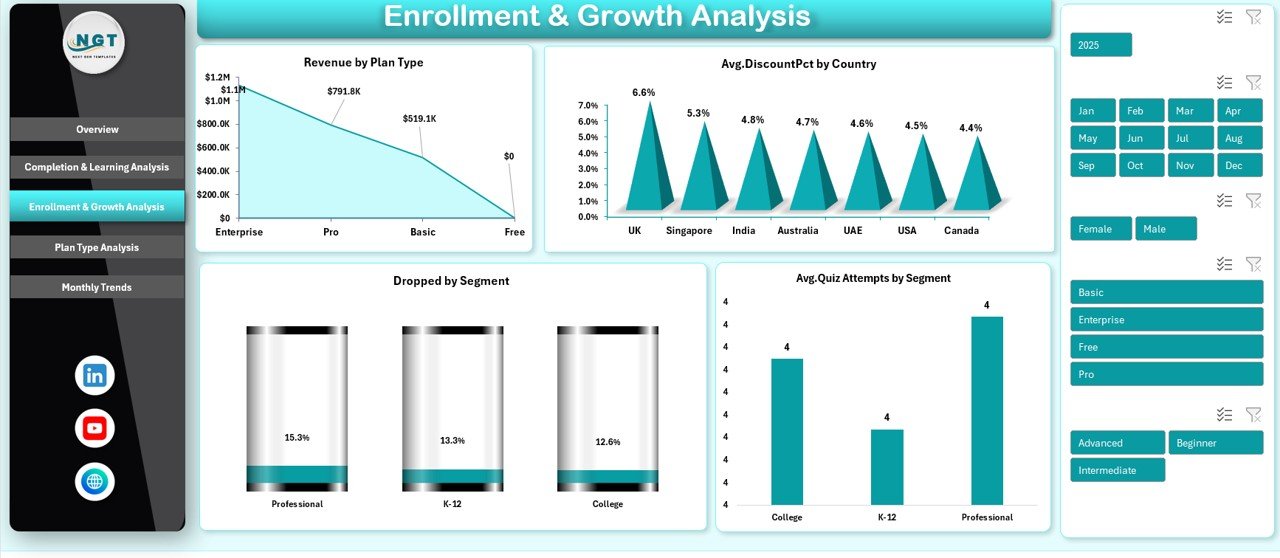
📌 Enrollment & Growth Analysis Sheet
Analyze revenue by plan type, dropouts by segment, discounts by country, and quiz engagement trends.
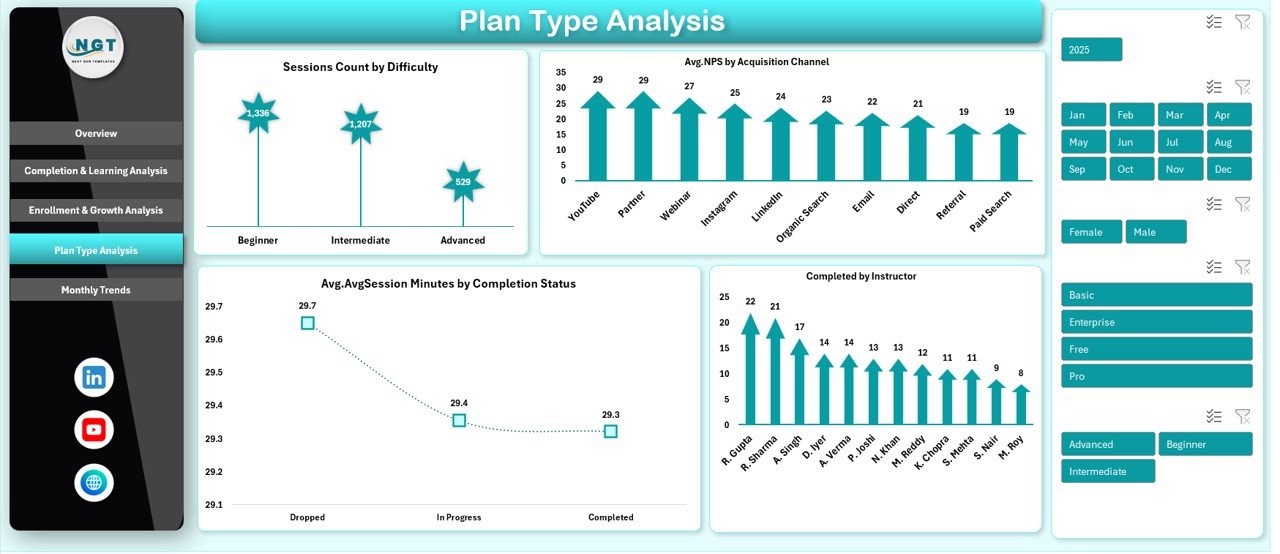
📌 Plan Type Analysis Sheet
Evaluate instructor performance, learner satisfaction by acquisition channel, and session engagement by completion status.
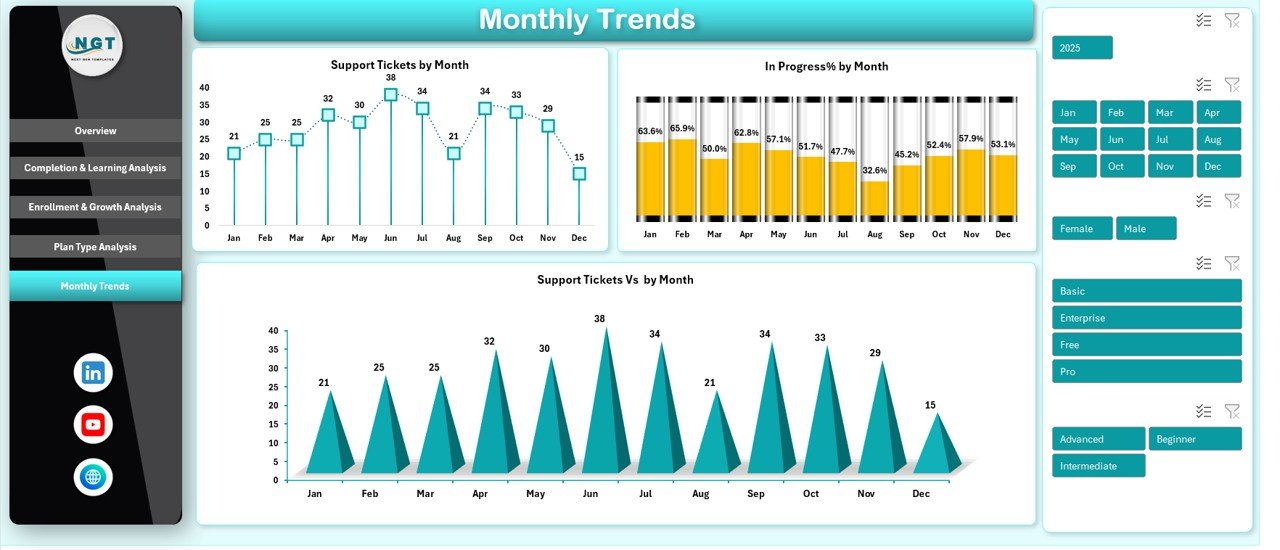
📌 Monthly Trends Sheet
Monitor support tickets and in-progress trends over time to anticipate issues and improve learner experience.
Each sheet is purpose-built to answer real business questions—fast.
## 🧩 How to Use the EdTech Dashboard in Excel
1️⃣ Enter or paste your EdTech data into the structured data tables
2️⃣ Refresh pivot tables (if required)
3️⃣ Use slicers and filters to explore insights
4️⃣ Review charts, KPIs, and trends instantly
5️⃣ Make data-driven decisions with confidence
No advanced Excel knowledge is required. The dashboard is designed for ease of use and fast adoption.
## 🎓 Who Can Benefit from This EdTech Dashboard in Excel
👨💼 EdTech Founders & Executives – Gain instant performance visibility
🏫 Online Course Platforms – Track enrollments and completion rates
📚 Training & Certification Institutes – Monitor learning effectiveness
📊 Learning & Development Teams – Measure engagement and outcomes
🧑🏫 Academic Administrators – Improve course and instructor performance
📈 Education Consultants – Deliver data-driven insights to clients
If you manage learning data, this dashboard is built for you.
Click here to read the Detailed Blog Post
Watch the step-by-step video tutorial:


Reviews
There are no reviews yet.