Managing performance in the petroleum industry is never simple. With complex operations, strict safety norms, fluctuating production targets, and tight margins, even small delays in reporting can lead to costly decisions. That is exactly why the Petroleum Industry KPI Scorecard in Excel is designed — to give you instant clarity, control, and confidence over your operational and strategic performance.
This ready-to-use Excel scorecard transforms raw petroleum data into clear, visual, and actionable insights. Instead of juggling multiple spreadsheets and manual reports, you get one powerful file that tracks MTD, YTD, Actual vs Target, and Previous Year performance — all in one place. As a result, you move from reactive reporting to proactive decision-making.
Whether you manage refinery operations, production performance, safety compliance, or financial efficiency, this Excel-based KPI scorecard becomes your single source of truth.
🔑 Key Features of Petroleum Industry KPI Scorecard in Excel
✅ 📅 Interactive Month & Period Selection
Easily select the month and switch between MTD and YTD views using dropdowns. The entire scorecard updates instantly.
✅ 🎯 Actual vs Target Comparison
Track whether each KPI meets, exceeds, or falls short of its target without manual calculations.
✅ 📉 Previous Year Benchmarking
Compare current performance with last year to understand growth, decline, or stability trends.
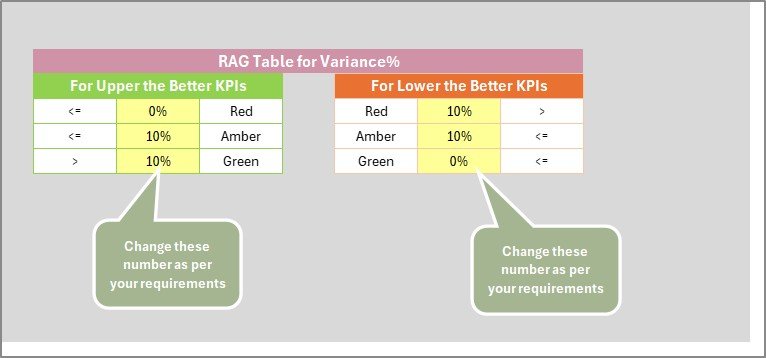
✅ 🚦 Color-Coded Performance Indicators
Conditional formatting highlights performance status clearly, allowing instant issue identification.
✅ 📈 KPI Trend Analysis
Visual trend charts help you understand performance behavior over time, not just static numbers.
✅ 🧮 Automated Calculations
All formulas are pre-built, reducing errors and saving valuable reporting time.
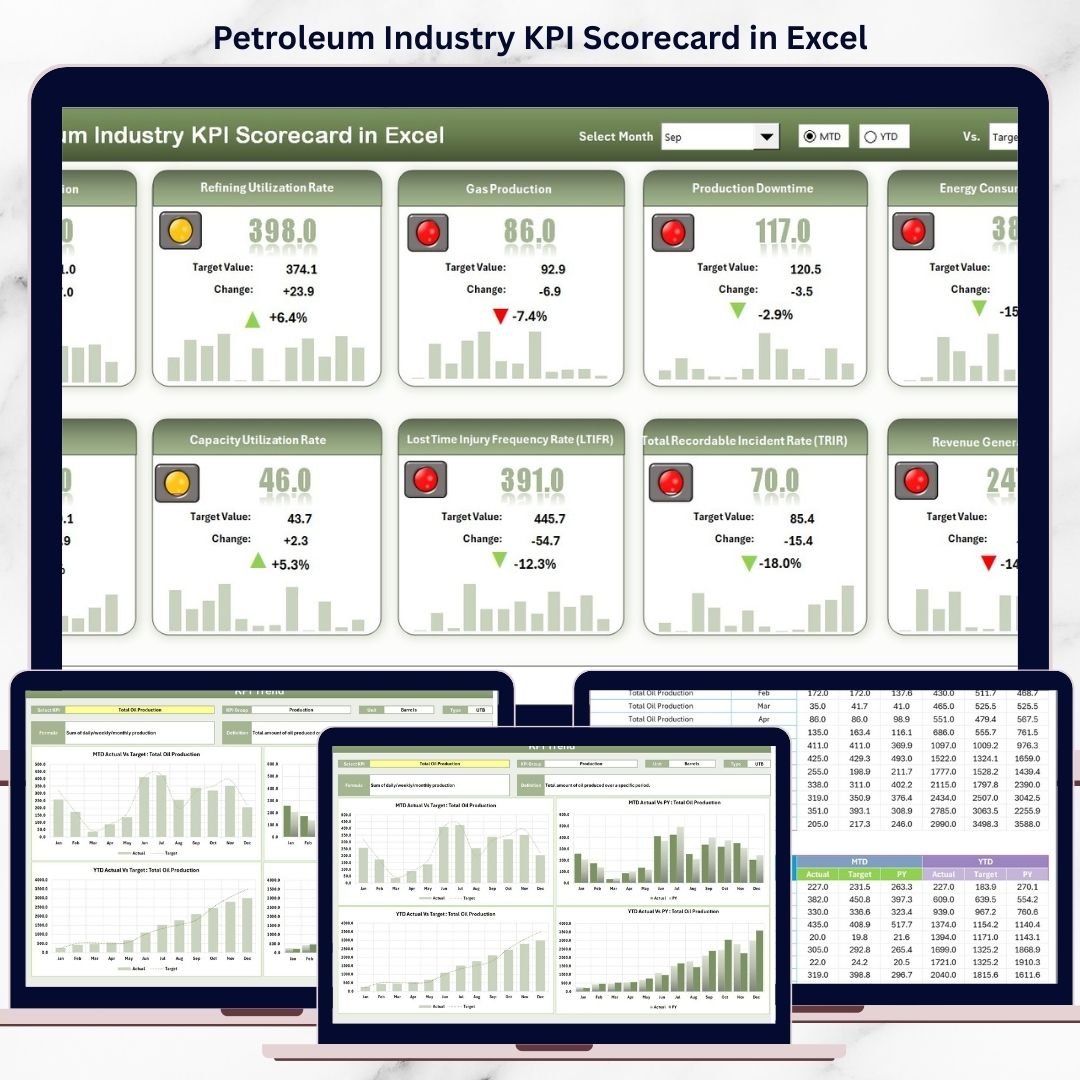
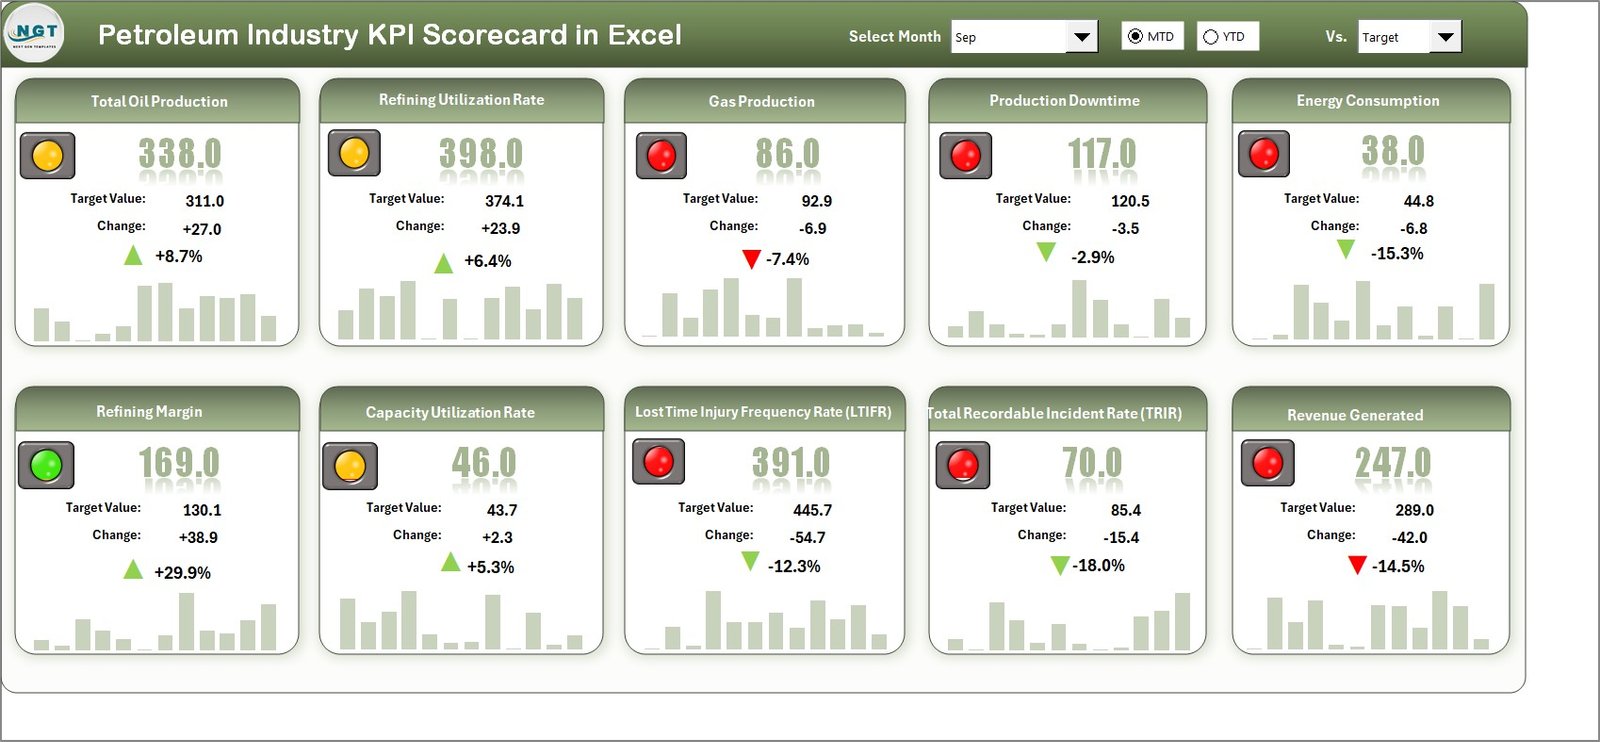
✅ 📊 Executive-Ready Scorecard View
Monitor up to 10 KPIs in a single view, ideal for management meetings and reviews.
📦 What’s Inside the Petroleum Industry KPI Scorecard in Excel
📄 Scorecard Sheet
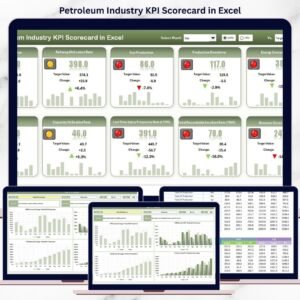
The main dashboard displaying KPI Group, KPI Name, Unit, Type, Actual, Target, Variance, and Status — all in one clean view.
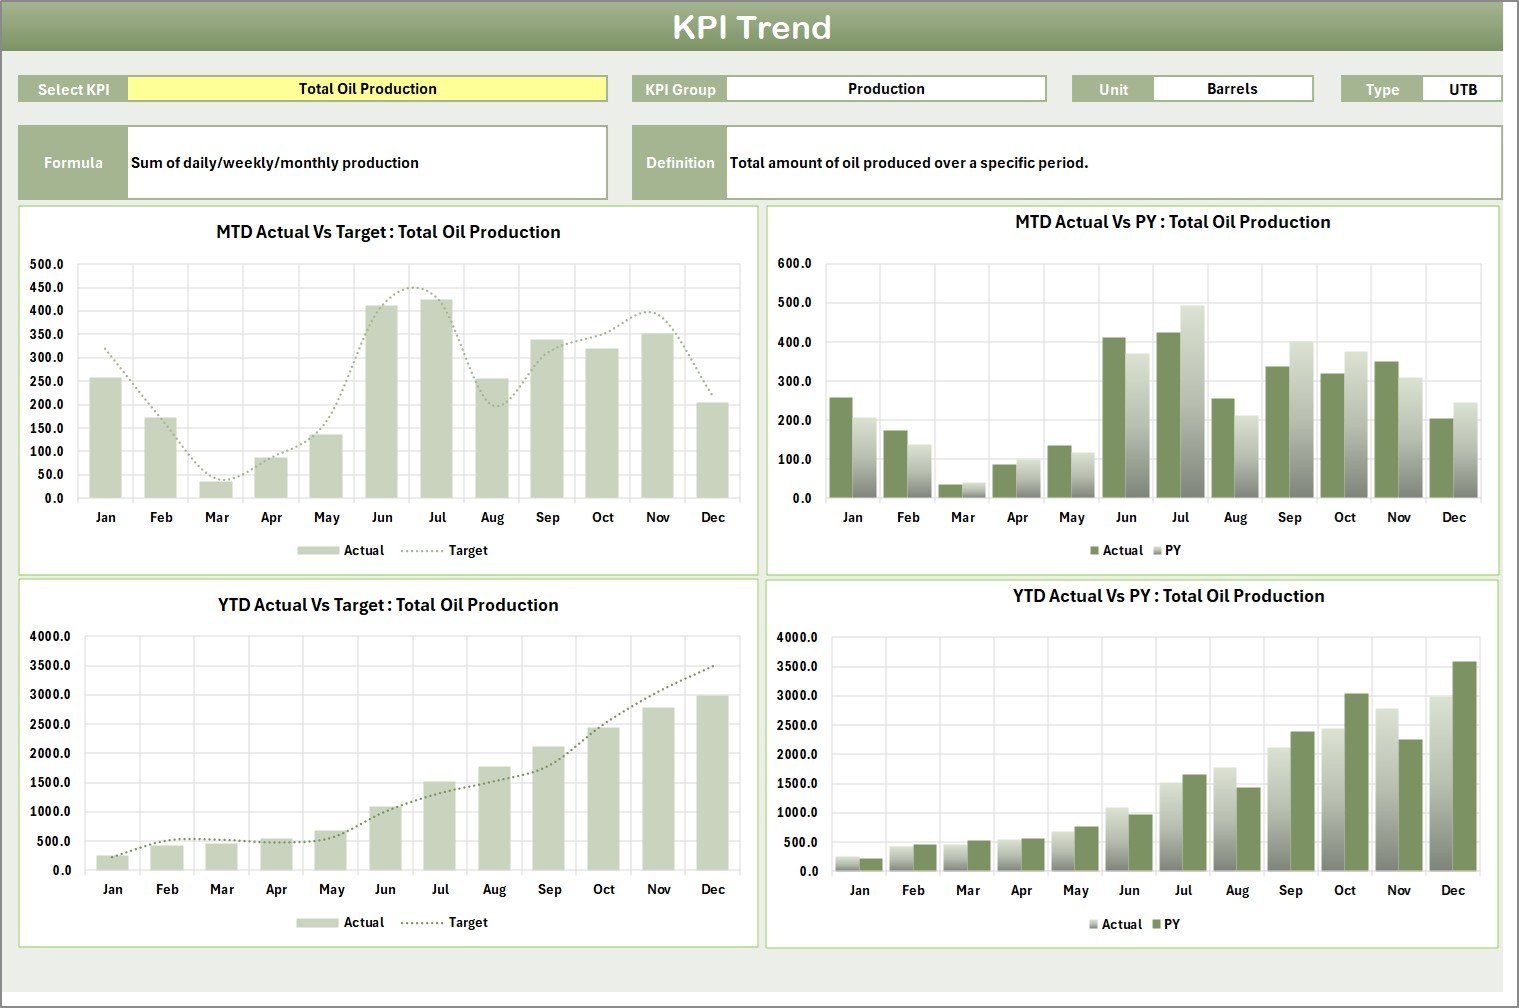
📈 KPI Trend Sheet
Select any KPI from a dropdown and instantly view:
-
KPI Group & Unit
-
KPI Type (LTB / UTB)
-
Formula & Definition
-
MTD and YTD trend charts for Actual, Target, and Previous Year
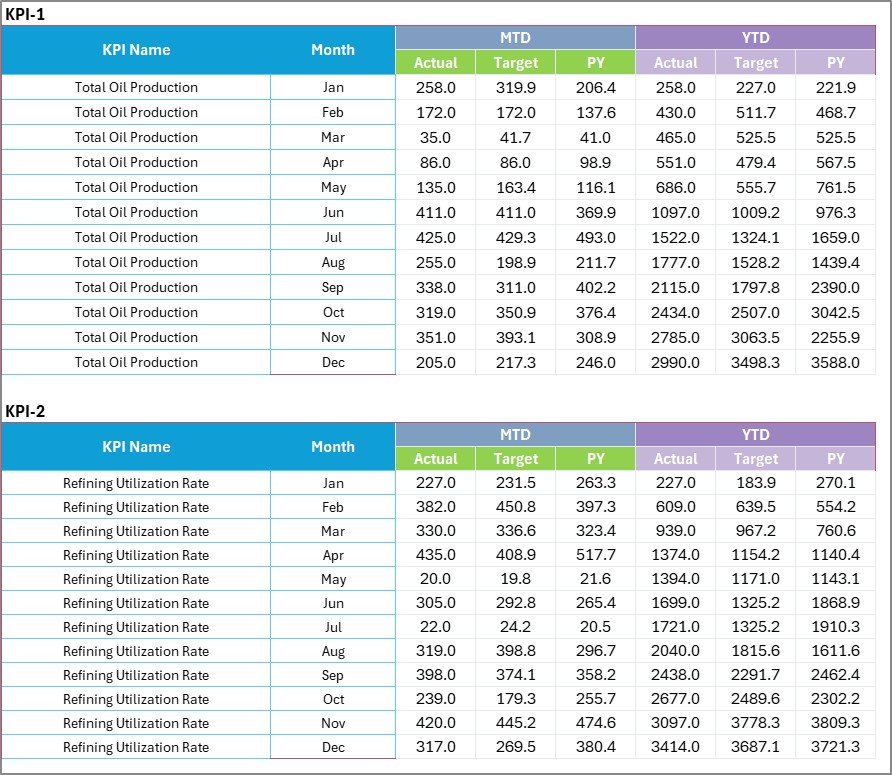
🗂️ Input Data Sheet
A structured and centralized sheet to enter actual values, targets, and previous year data. Update once — refresh everywhere.
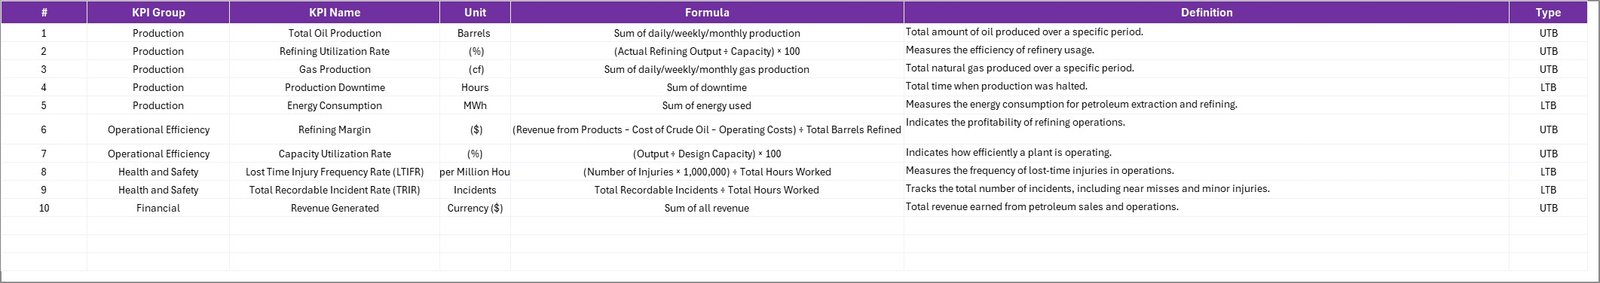
📘 KPI Definition Sheet
Clearly defines every KPI with its name, unit, formula, and purpose, ensuring consistency across teams.
This structure ensures clarity, transparency, and scalability for petroleum KPI tracking.
🛠️ How to Use the Petroleum Industry KPI Scorecard in Excel
1️⃣ Open the Excel file and review the KPI Definition Sheet
2️⃣ Enter or update monthly data in the Input Data Sheet
3️⃣ Select the desired month and MTD/YTD option on the Scorecard
4️⃣ Instantly review KPI performance with visual indicators
5️⃣ Use the Trend Sheet to analyze performance movement over time
6️⃣ Identify gaps, take corrective action, and improve outcomes
No advanced Excel skills are required — the scorecard works right out of the box.
🎯 Who Can Benefit from This Petroleum Industry KPI Scorecard in Excel
👷 Operations & Production Managers – Track efficiency, output, and downtime
🛠️ Maintenance Teams – Monitor response times and equipment performance
💰 Finance Professionals – Analyze cost, margin, and profitability KPIs
🦺 Safety & Compliance Officers – Track incidents and compliance performance
📊 Business Analysts – Perform structured KPI analysis with clean data
🏢 Senior Management & Executives – Get high-level insights for strategic decisions
No matter your role, this scorecard delivers relevant insights without complexity.
Click here to read the Detailed blog post
Watch the step-by-step video tutorial:


Reviews
There are no reviews yet.