Managing eco-tourism initiatives without clear performance visibility often results in missed sustainability targets, inefficient operations, and poor decision-making. When data stays scattered across Excel files and reports, organizations struggle to understand what is working and what needs improvement.
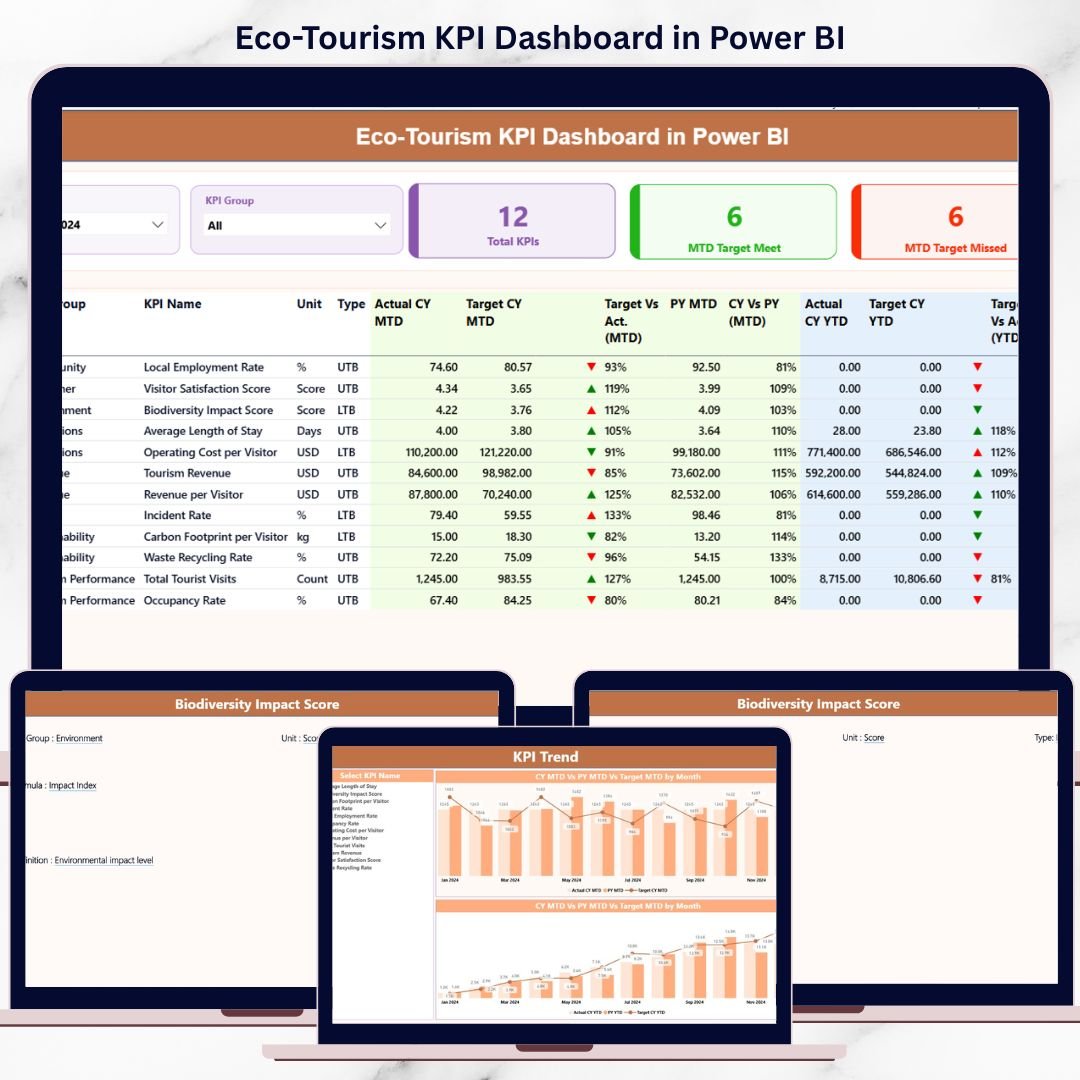
That is exactly why the Eco-Tourism KPI Dashboard in Power BI is a powerful, ready-to-use solution. This professionally designed dashboard converts raw eco-tourism data into meaningful insights so you can track sustainability, visitor impact, and financial performance with confidence.
Built using Power BI with an Excel data source, this dashboard is easy to update, simple to maintain, and designed for real-world decision-makers.
🚀 Key Features of Eco-Tourism KPI Dashboard in Power BI
🌿 Centralized KPI Monitoring – Track all sustainability, operational, and financial KPIs in one interactive dashboard
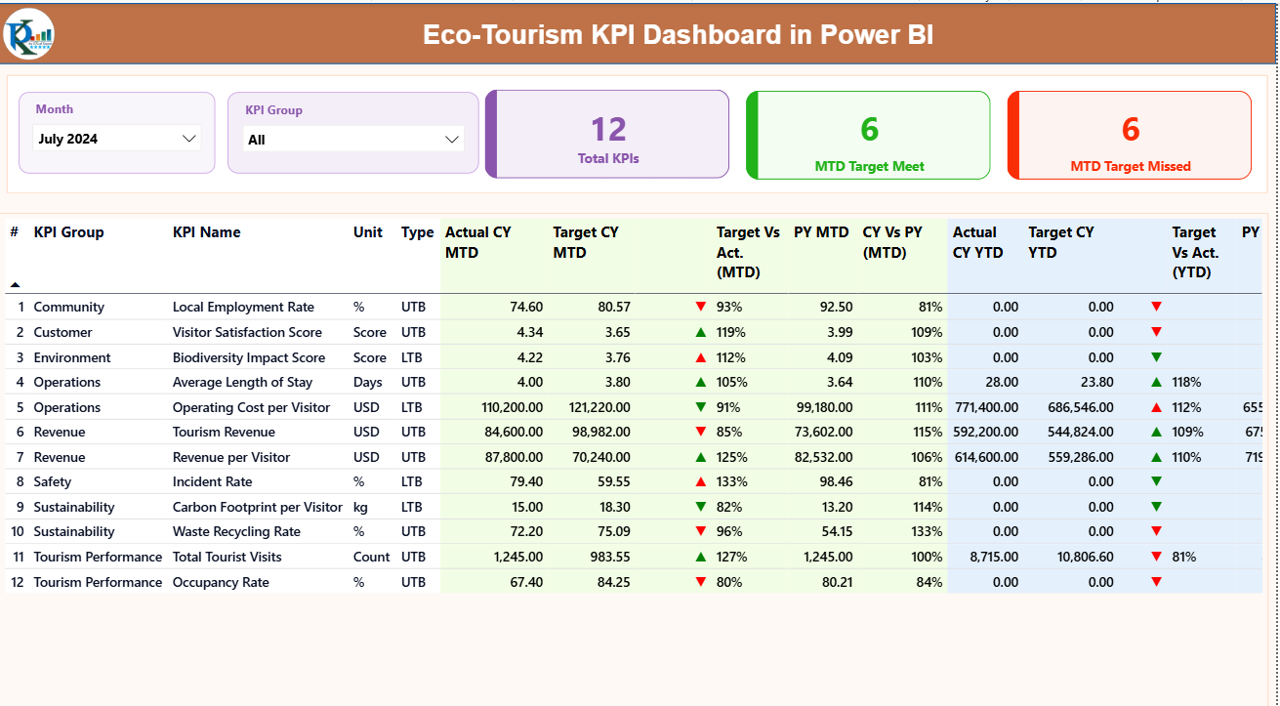
📅 MTD & YTD Performance Tracking – Instantly analyze Month-to-Date and Year-to-Date performance
📊 Target vs Actual Comparison – Identify target met and target missed KPIs visually
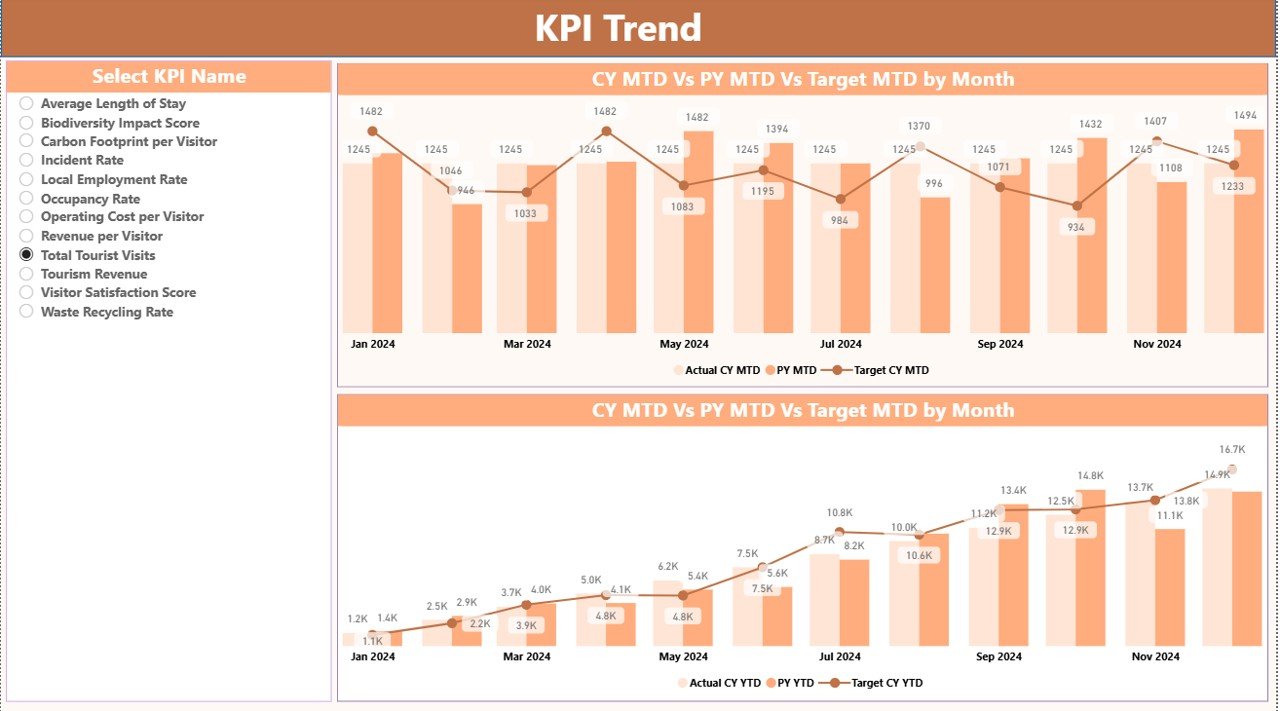
📈 Trend Analysis with Combo Charts – Compare Current Year, Previous Year, and Target values
🎯 Smart KPI Classification – Supports LTB (Lower the Better) and UTB (Upper the Better) logic
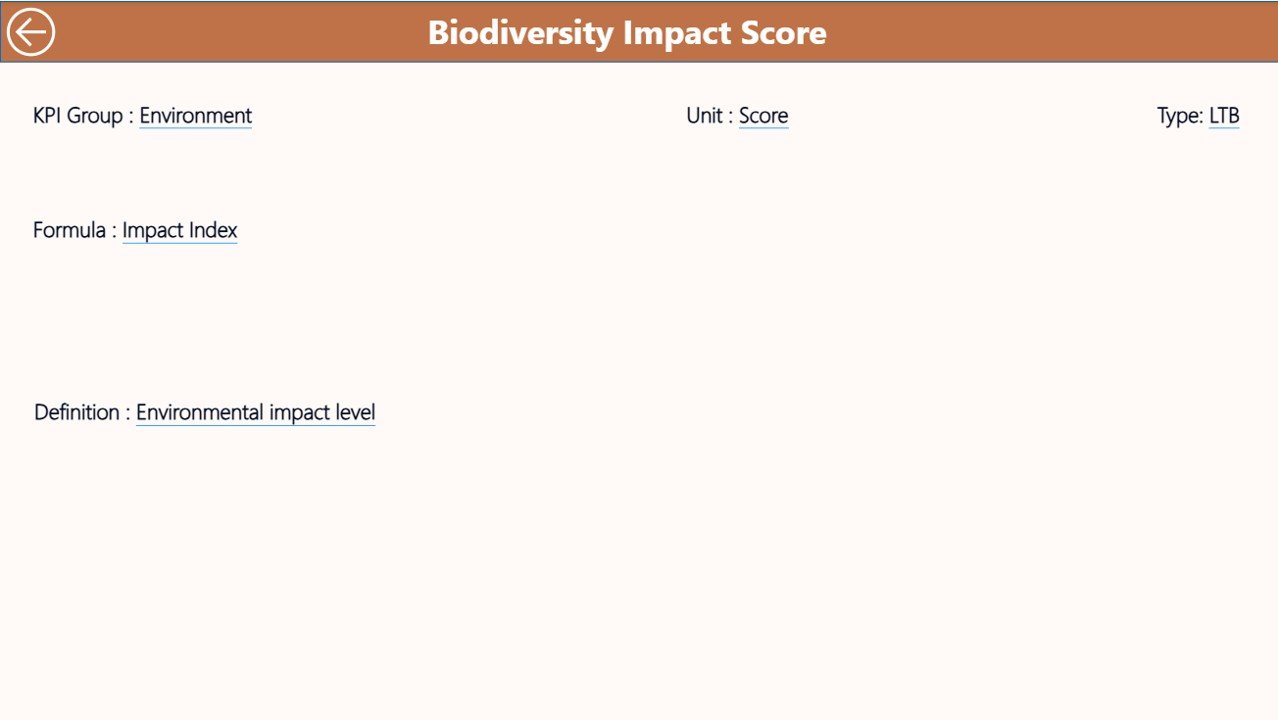
🔎 Drill-Through KPI Definitions – Understand KPI formulas and logic instantly
🧩 Excel-Based Data Input – Update data easily without technical skills
⚡ Decision-Ready Insights – Save time and act faster with clear performance signals
📦 What’s Inside the Eco-Tourism KPI Dashboard
This ready-to-use Power BI file includes three professionally structured pages:
📌 Summary Page
• Month and KPI Group slicers
• KPI cards for Total KPIs, MTD Target Met, and MTD Target Missed
• Detailed KPI table with MTD & YTD comparisons, icons, and YoY analysis
📌 KPI Trend Page
• Dynamic combo charts for trend analysis
• Separate MTD and YTD trend views
• KPI selection slicer for focused analysis
📌 KPI Definition Page
• Drill-through reference page
• KPI formula, definition, and intent
• Built-in back navigation for smooth user experience
Additionally, you get a structured Excel data source with:
• Input_Actual sheet
• Input_Target sheet
• KPI Definition master table
🛠 How to Use the Eco-Tourism KPI Dashboard
Using this dashboard is simple and efficient:
1️⃣ Enter Actual KPI values in the Excel input sheet
2️⃣ Enter Target KPI values in the target sheet
3️⃣ Update KPI definitions if required
4️⃣ Refresh the Power BI file
5️⃣ Use slicers to analyze KPIs by month and category
6️⃣ Review MTD, YTD, and Year-over-Year performance
7️⃣ Drill through to KPI definitions for clarity
No coding. No complex setup. Just clean, structured analytics.
👥 Who Can Benefit from This Eco-Tourism KPI Dashboard?
🌍 Eco-tourism operators & resort managers
🏞 Wildlife reserves and national parks
✈ Sustainable travel agencies
🌱 NGOs and conservation organizations
🏛 Government tourism departments
📑 Policy makers and sustainability planners
Whether you manage a small eco-project or a large sustainability program, this dashboard adapts easily.
Click here to read the Detailed blog post
Visit our YouTube channel to learn step-by-step video tutorials
👉 Youtube.com/@PKAnExcelExpert


Reviews
There are no reviews yet.