Managing a modern smart grid without clear performance visibility always leads to inefficiencies, delayed actions, and hidden operational risks. Power utilities deal with massive data from smart meters, substations, transformers, and grid control systems every single day. However, when this data stays scattered across Excel files or static reports, it loses its true value.
That is exactly why the Smart Grid KPI Dashboard in Power BI becomes a must-have performance management solution for utilities and energy operators.
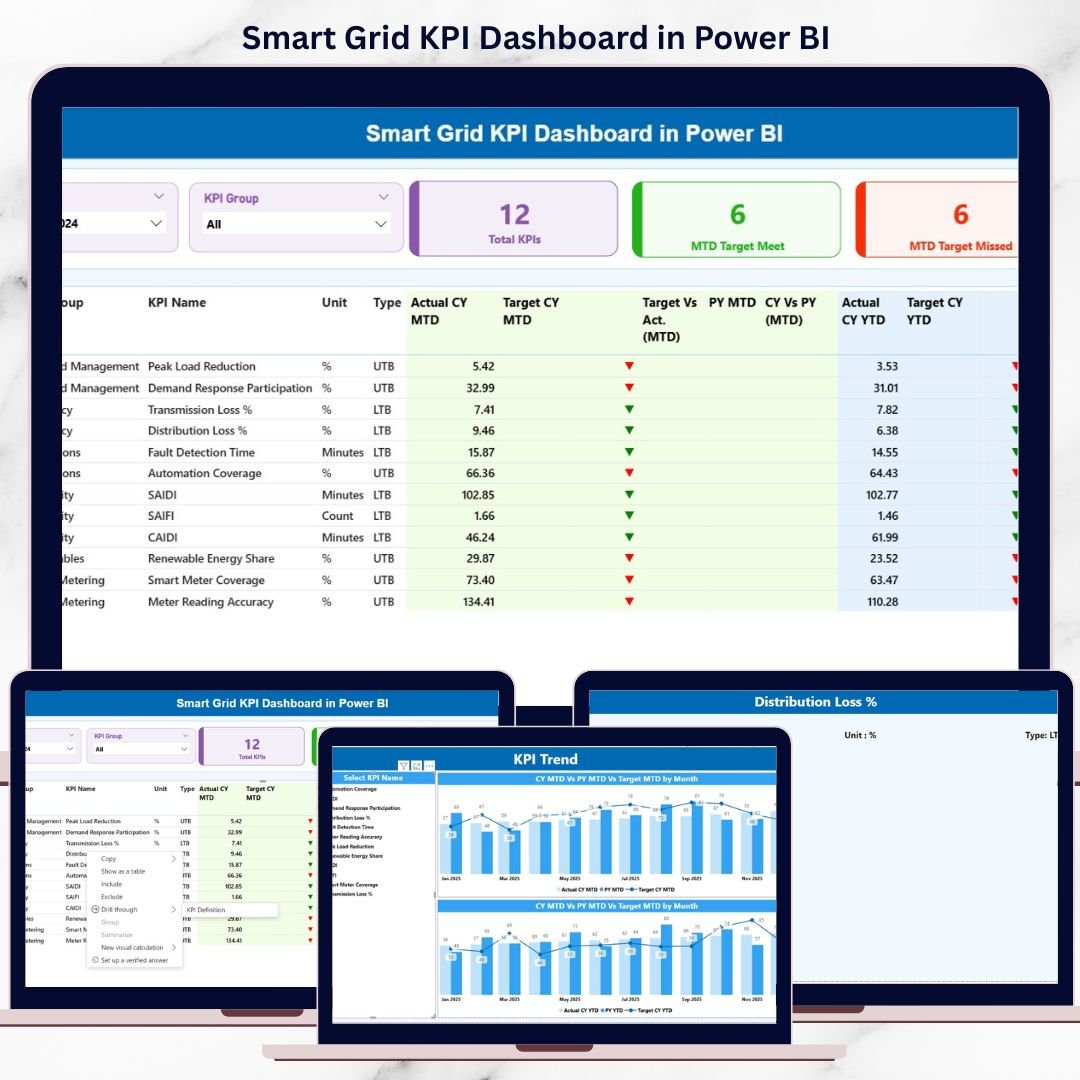
This ready-to-use dashboard converts raw smart grid data into clear, interactive, and actionable insights. Built using Power BI with Excel as the data source, it helps utilities track performance, monitor targets, analyze trends, and take faster, data-driven decisions. Instead of spending hours compiling reports, teams can instantly understand what is working and what needs attention.
With structured pages, visual indicators, MTD and YTD analysis, and drill-through navigation, this dashboard is designed for both operational teams and decision-makers who need clarity without complexity.
🚀 Key Features of Smart Grid KPI Dashboard in Power BI
⚡ Interactive Summary View – Instantly monitor all smart grid KPIs from one centralized dashboard
📅 Dynamic Month & KPI Group Slicers – Filter data effortlessly by reporting period and KPI category
📊 MTD & YTD Performance Tracking – Compare actual vs target values with clear indicators
🔼 Visual Status Indicators – Green ▲ and Red ▼ icons show target achievement at a glance
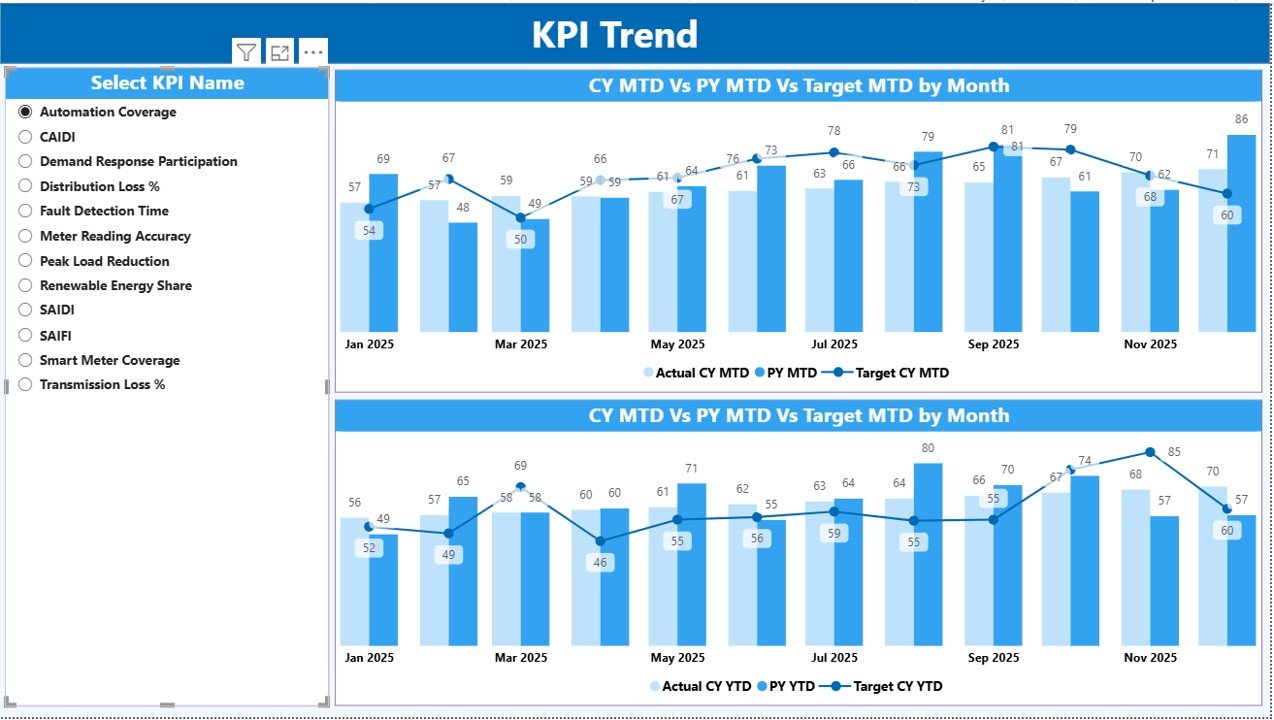
📈 KPI Trend Analysis – Analyze current year vs previous year performance using dynamic combo charts
🔍 Drill-Through KPI Definitions – Understand KPI logic, formula, and purpose without external documents
📁 Excel-Based Data Input – Simple, structured, and easy-to-maintain data model
🔄 Scalable Design – Add or modify KPIs as your smart grid operations evolve
📦 What’s Inside the Smart Grid KPI Dashboard in Power BI
This digital product includes a Power BI Desktop (.pbix) file with three professionally designed pages:
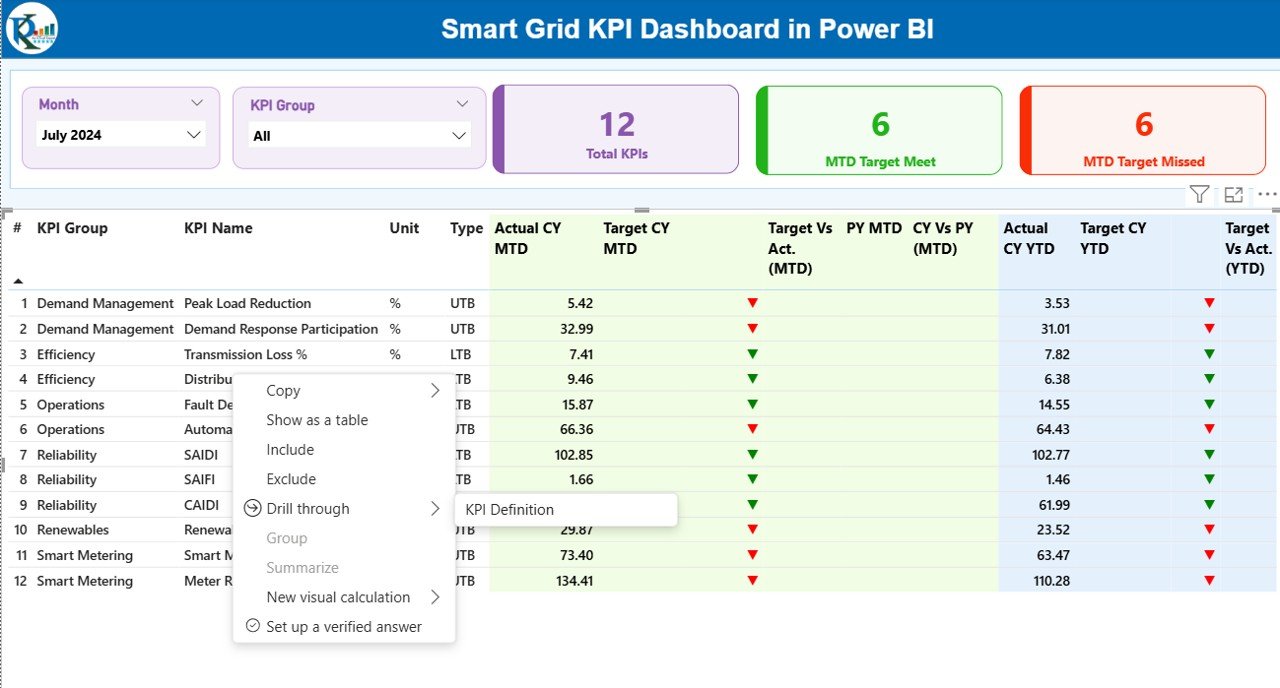
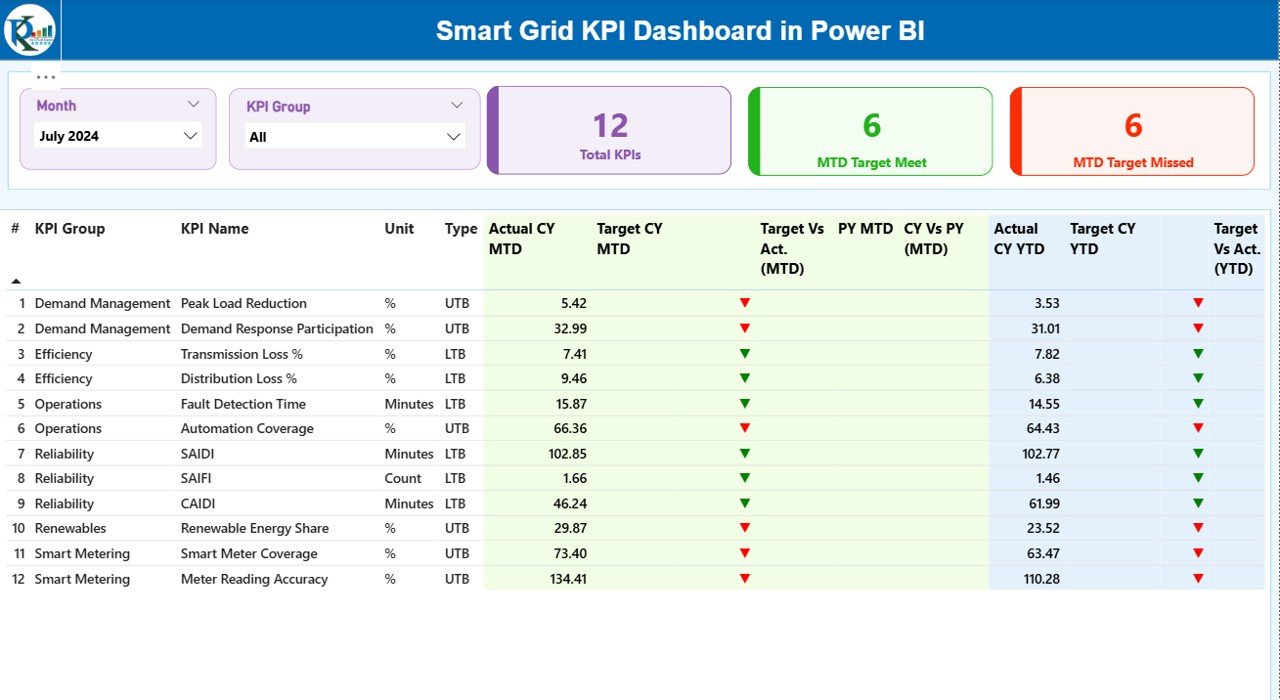
📌 Summary Page
The main control center showing KPI cards, filters, and a detailed performance table with MTD and YTD comparisons.
📌 KPI Trend Page
A deep-dive analysis page with interactive combo charts that show actual, target, and previous year trends for selected KPIs.
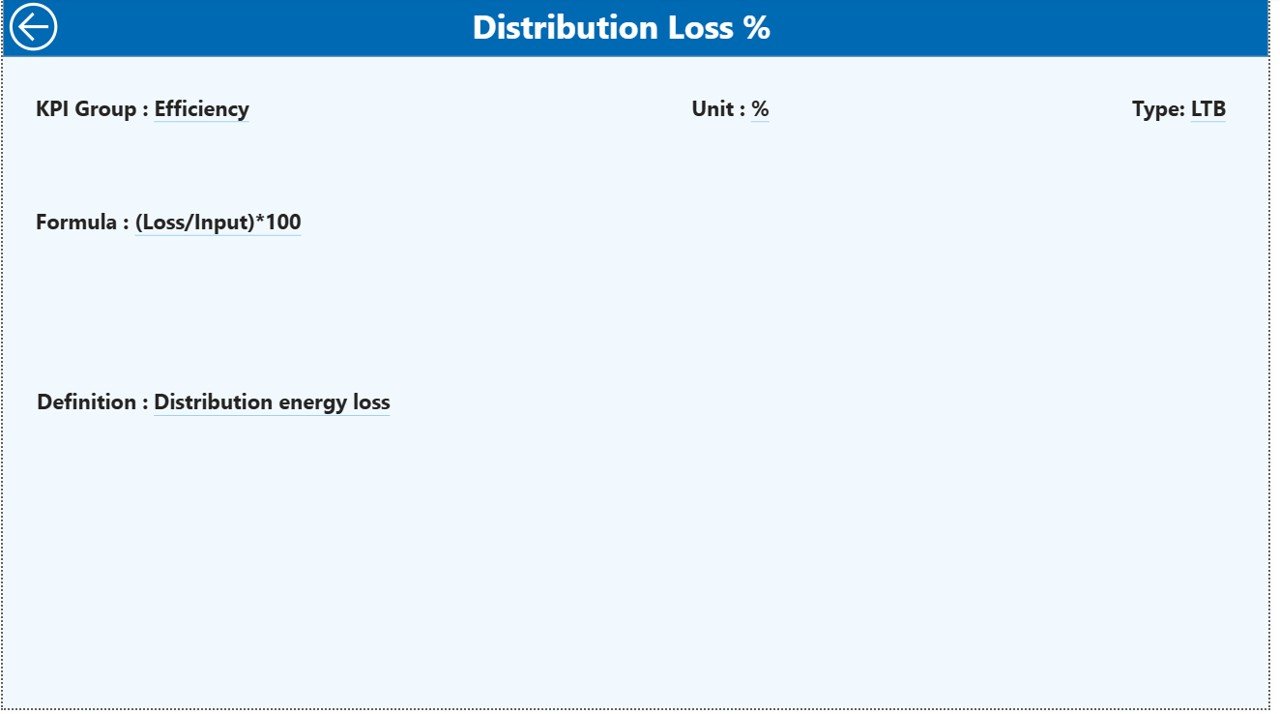
📌 KPI Definition Page
A reference page accessible via drill-through that explains KPI formula, definition, unit, and type (UTB / LTB).
Additionally, the dashboard connects to a structured Excel data file containing:
-
Actual performance data
-
Target values
-
KPI master definitions
🛠️ How to Use the Smart Grid KPI Dashboard in Power BI
Using this dashboard is simple and user-friendly:
1️⃣ Enter or update KPI data in the provided Excel sheets
2️⃣ Open the Power BI Desktop file
3️⃣ Refresh the data with one click
4️⃣ Use slicers to filter by month or KPI group
5️⃣ Review KPI cards, tables, and trends
6️⃣ Drill through to KPI definitions for clarity
No advanced Power BI expertise is required. The dashboard is designed so both technical and non-technical users can operate it confidently.
👥 Who Can Benefit from This Smart Grid KPI Dashboard
This dashboard is ideal for:
⚙️ Power utilities and grid operators
🌱 Renewable energy providers
🏢 Transmission & distribution companies
📋 Energy regulators and compliance teams
🏙️ Smart city planners
📊 Energy analysts and consultants
👔 Senior management and decision-makers
Whether you manage a small utility or a large energy network, this dashboard adapts to your operational needs.
Click here to read the Detailed blog post
Watch the step-by-step video tutorial:


Reviews
There are no reviews yet.