Virtual Reality (VR) studios operate in one of the most fast-moving and innovation-driven industries today. Virtual Reality Studios KPI Dashboard in Excel From immersive gaming and entertainment to training simulations, education, healthcare, and enterprise solutions, VR studios manage creative teams, technical resources, tight timelines, and high development costs. However, when performance tracking depends on scattered spreadsheets or manual updates, visibility disappears and decision-making slows down.
Virtual Reality Studios KPI Dashboard in Excel That is exactly why the Virtual Reality Studios KPI Dashboard in Excel becomes a must-have performance management tool for modern VR studios 🚀.
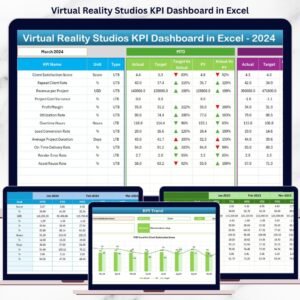
Virtual Reality Studios KPI Dashboard in Excel This ready-to-use Excel dashboard transforms complex studio data into clear KPIs, performance indicators, and trend insights. Instead of chasing reports, studio managers, producers, and founders gain a single, structured view of productivity, cost efficiency, delivery timelines, and overall performance—all inside Excel.
Virtual Reality Studios KPI Dashboard in Excel Whether you manage a VR content studio, gaming team, simulation lab, or XR startup, this dashboard helps you measure what matters, spot risks early, and make confident, data-driven decisions.
🚀 Key Features of Virtual Reality Studios KPI Dashboard in Excel
🎮 Centralized KPI Tracking
Monitor all VR studio KPIs in one structured Excel dashboard.
📅 MTD & YTD Performance Analysis
Track both short-term execution and long-term studio performance.
🎯 Target vs Actual Comparison
Instantly see which KPIs meet or miss defined targets.
📈 KPI Trend Analysis
Analyze performance patterns using MTD and YTD trend charts.
🔍 Clear Performance Indicators
Green ▲ and Red ▼ arrows highlight performance status instantly.
⚙️ Fully Excel-Based
No Power BI, no coding—simple, flexible, and cost-effective.
🧠 KPI Definition Governance
Ensure clarity with standardized KPI formulas and definitions.
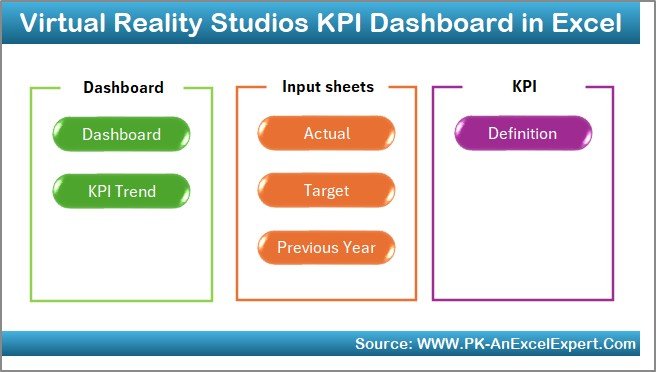
📂 What’s Inside the Virtual Reality Studios KPI Dashboard in Excel
🏠 Home Sheet – Easy Navigation
The Home Sheet acts as the entry point of the dashboard.
🔘 Key Highlights
-
Six clearly labeled navigation buttons
-
One-click access to all major worksheets
-
Clean, user-friendly layout
This design ensures even non-technical users navigate the dashboard effortlessly.
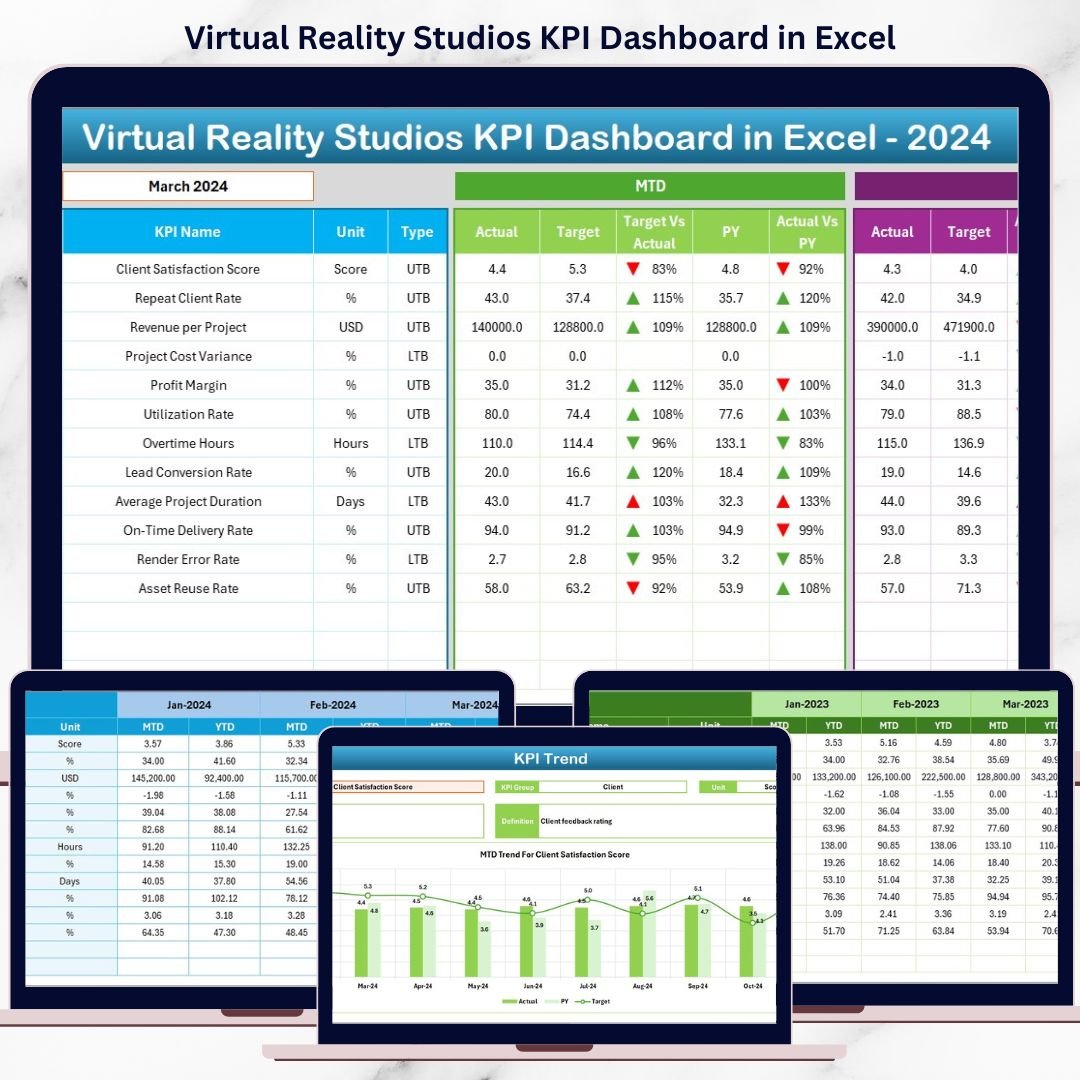
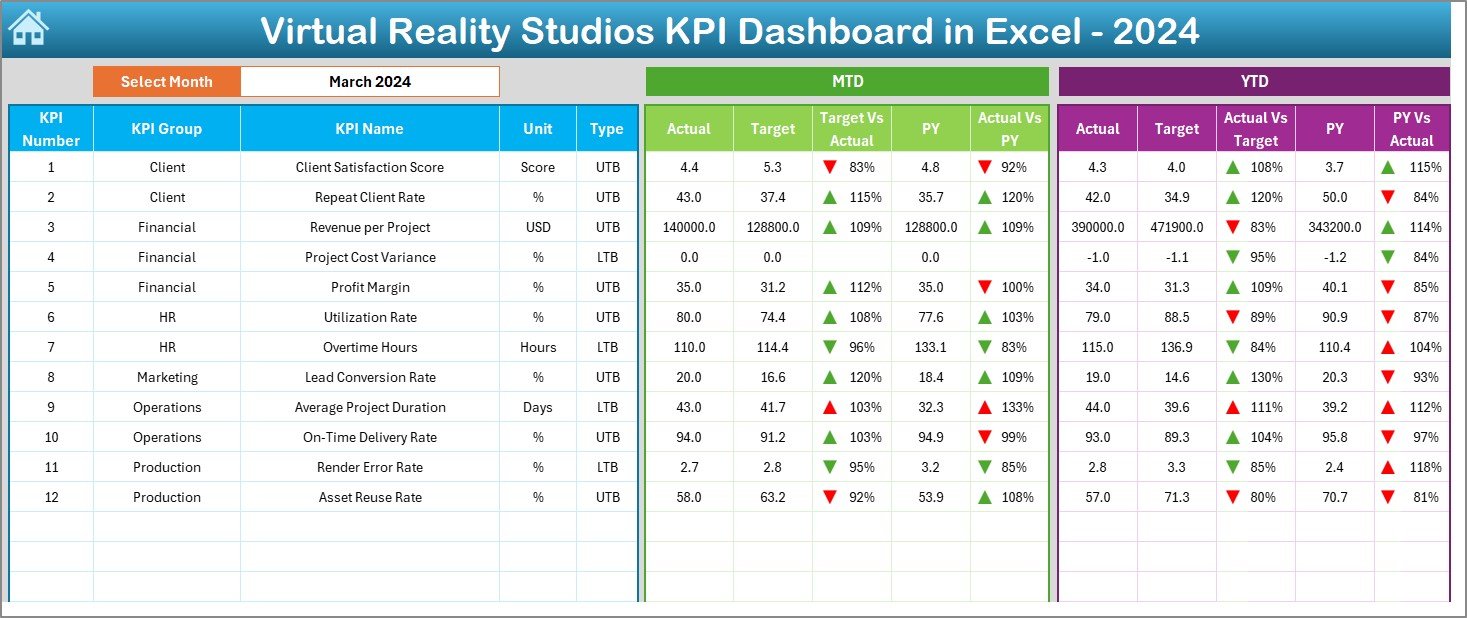
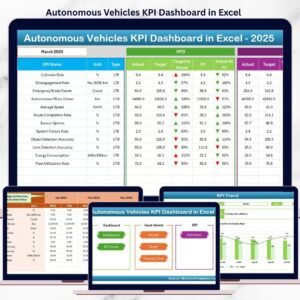
📊 Dashboard Sheet – Complete KPI Overview
The Dashboard Sheet is the core analytical page of the workbook.
📅 Month Selection
On cell D3, users select the reporting month. Once selected, all KPIs update automatically for that month.
📈 KPI Metrics Displayed
The dashboard displays both MTD (Month-to-Date) and YTD (Year-to-Date) performance, including:
MTD Analysis
-
Actual
-
Target
-
Previous Year
-
Target vs Actual (%)
-
Previous Year vs Actual (%)
YTD Analysis
-
Actual
-
Target
-
Previous Year
-
Target vs Actual (%)
-
Previous Year vs Actual (%)
🚦 Visual Performance Indicators
-
Green ▲ = On track / Positive performance
-
Red ▼ = Needs attention
As a result, performance gaps become visible instantly.
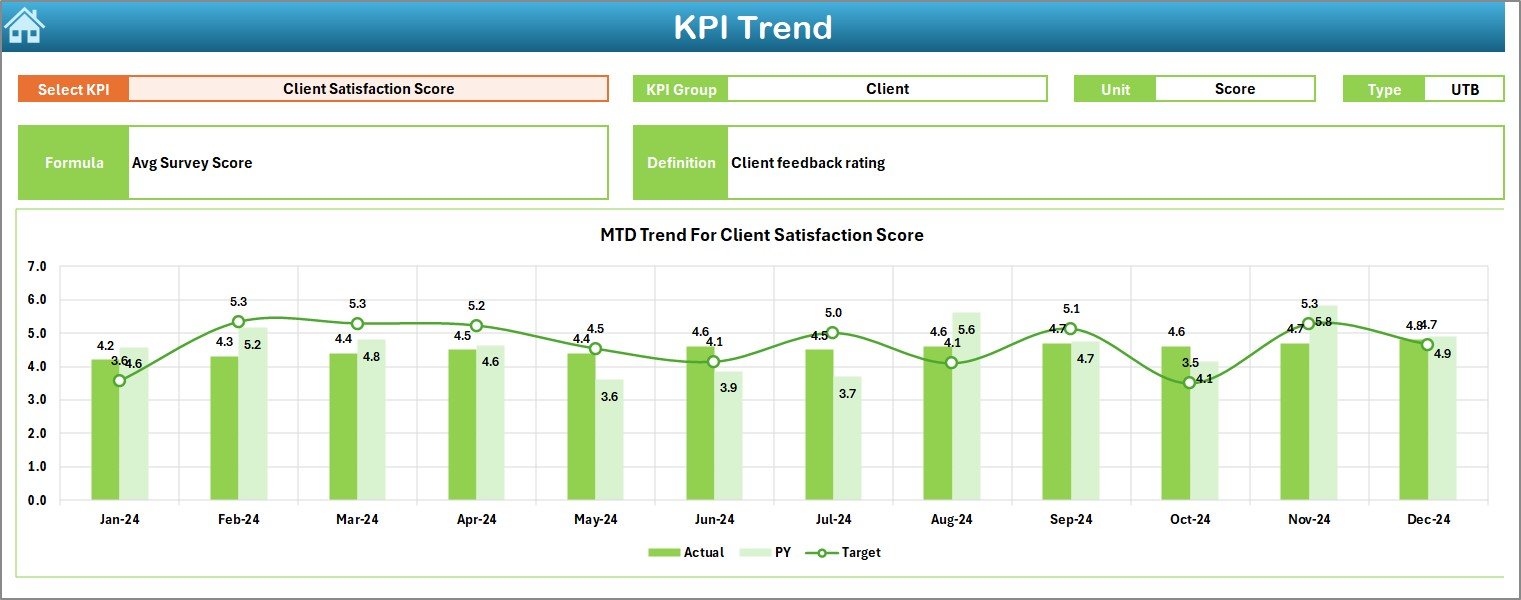
📈 KPI Trend Sheet – Deep-Dive Analysis
The KPI Trend Sheet enables focused KPI-level analysis.
🎯 KPI Selection
On cell C3, users select a KPI from a drop-down list.
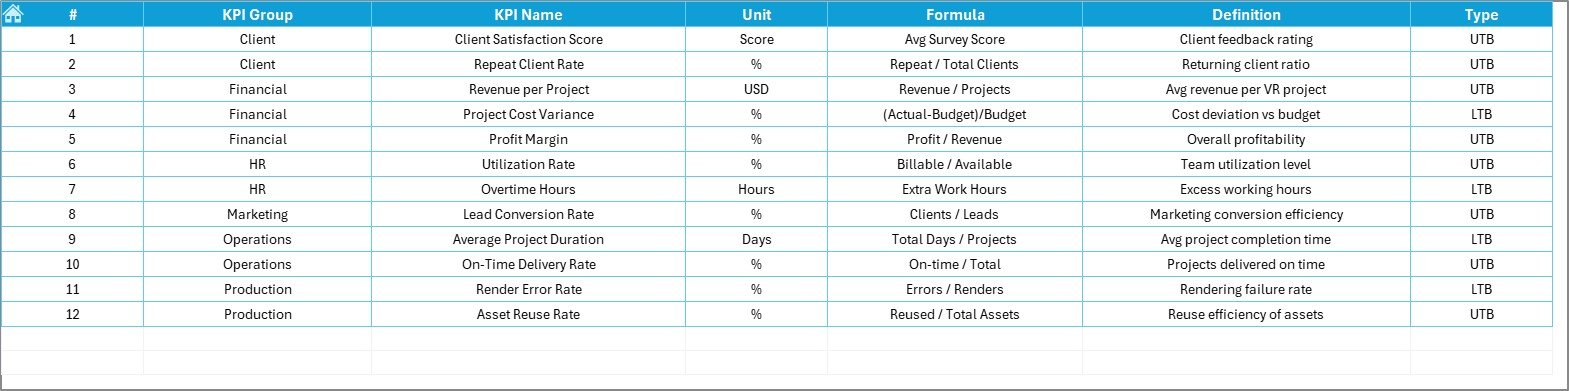
📋 KPI Details Displayed
-
KPI Group
-
Unit of Measurement
-
KPI Type (UTB / LTB)
-
KPI Formula
-
KPI Definition
📊 Trend Charts
-
MTD Trend Chart – Actual vs Target vs Previous Year
-
YTD Trend Chart – Actual vs Target vs Previous Year
These charts help identify trends, seasonality, and recurring issues.
📝 Supporting Input Sheets
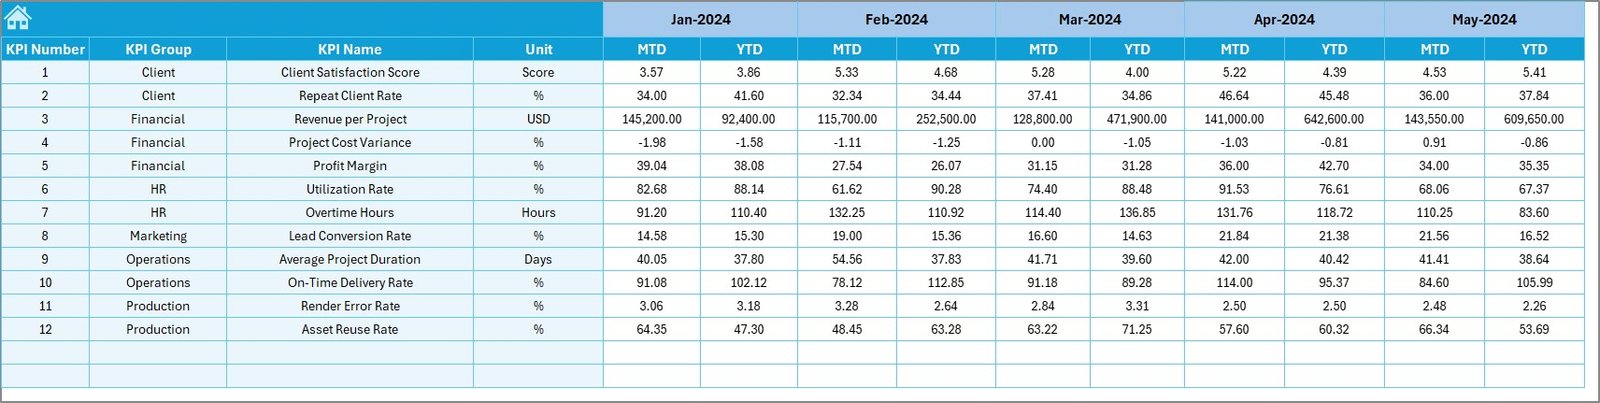
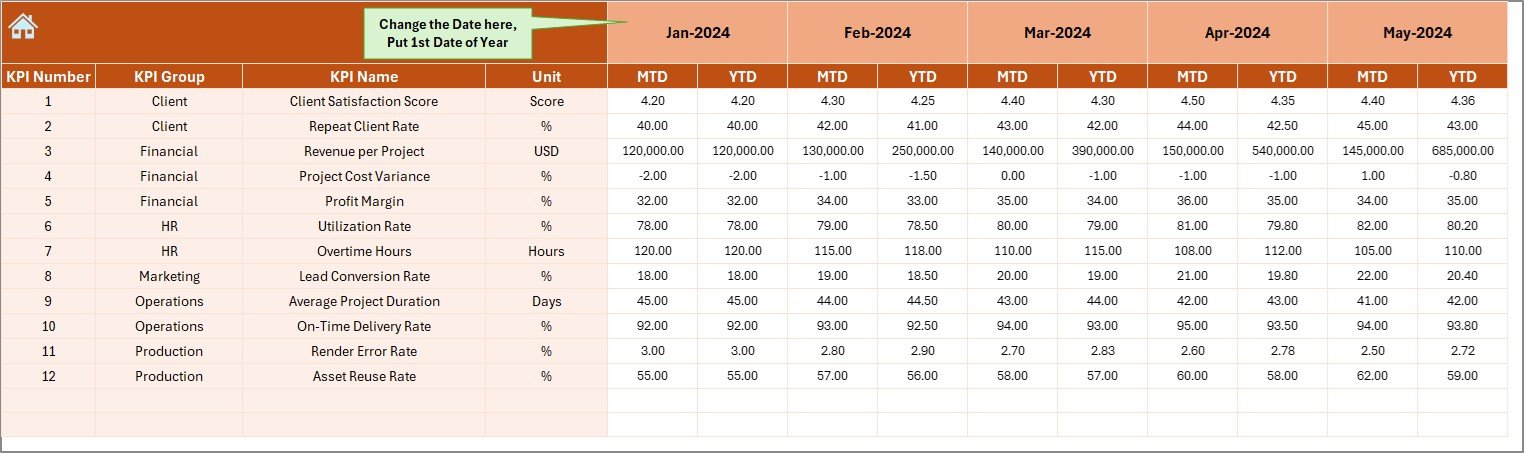
📌 Actual Numbers Input Sheet
Enter real MTD and YTD performance data.
🎯 Target Sheet
Store monthly MTD and YTD targets for each KPI.
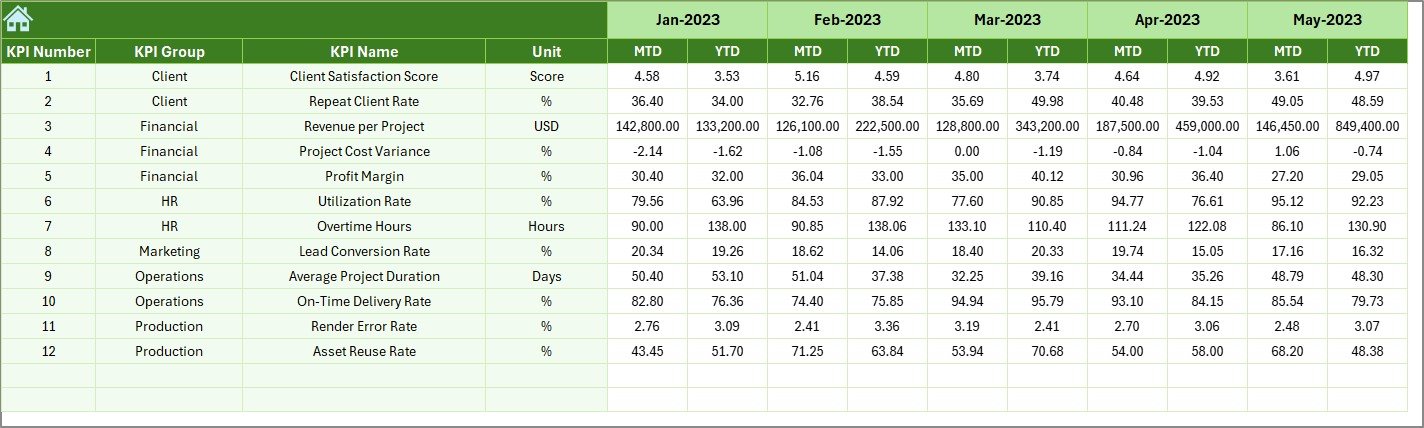
📆 Previous Year Number Sheet
Capture historical data for year-over-year comparison.
📘 KPI Definition Sheet
Maintain KPI name, group, unit, formula, definition, and type.
This structure ensures accuracy, consistency, and transparency.
👥 Who Can Benefit from This Dashboard
🎮 VR content studios
🕹 Gaming development teams
🏥 Healthcare & training simulation studios
🏫 Educational VR providers
🎥 Media & immersive experience companies
🚀 XR & metaverse startups
🔎 Click here to read the Detailed blog post
📺 Visit our YouTube channel to learn step-by-step video tutorials
👉 Youtube.com/@PKAnExcelExpert


Reviews
There are no reviews yet.