Waste reduction is no longer just a compliance requirement—it is a strategic priority for modern organizations. Rising sustainability expectations, stricter regulations, and cost pressures demand accurate tracking of waste performance. However, many organizations still rely on fragmented Excel sheets, manual calculations, and static reports. As a result, leaders struggle to identify trends, measure progress, and take timely corrective actions.
That is exactly why the Waste Reduction KPI Dashboard in Power BI becomes a powerful and essential performance management solution 🚀.
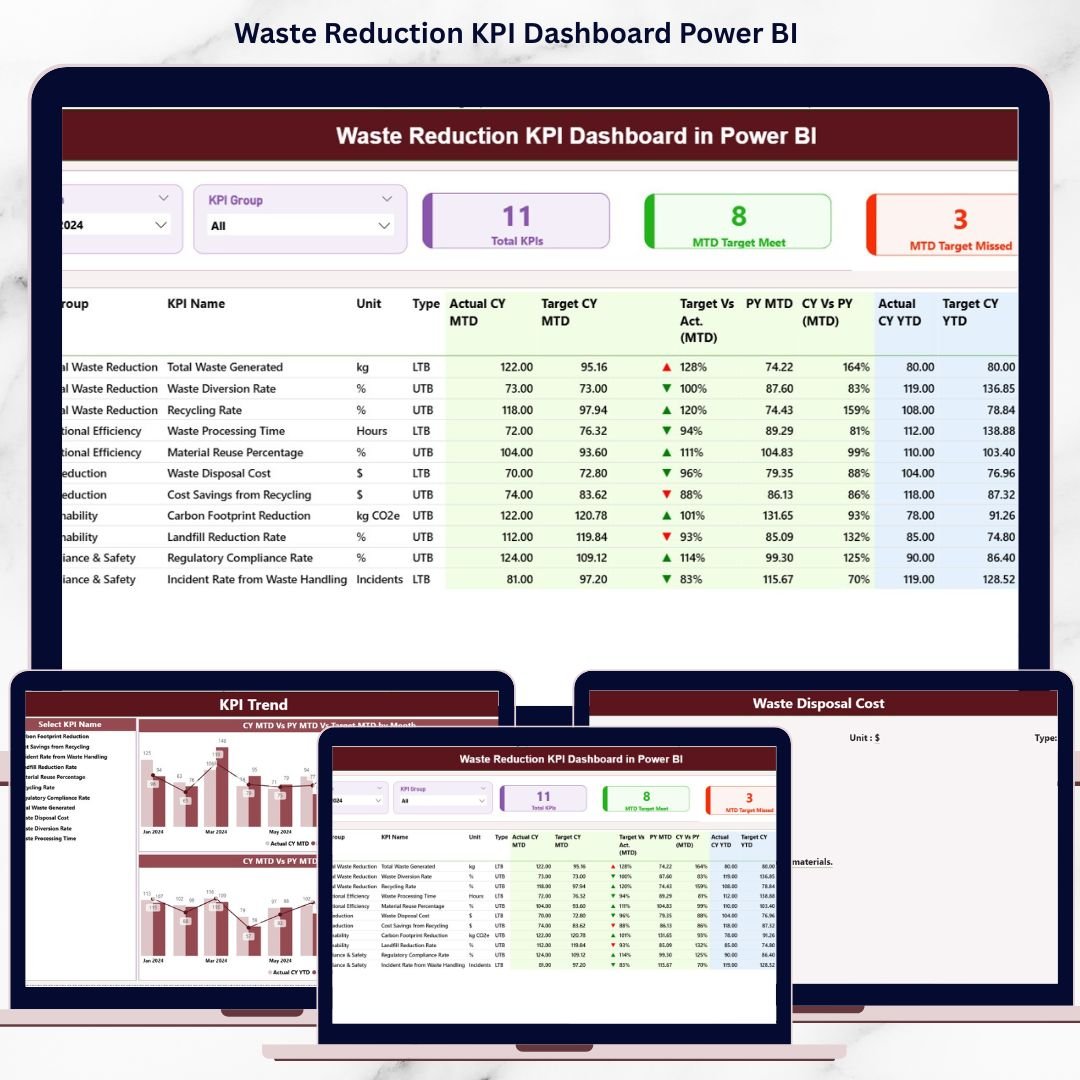
This ready-to-use dashboard converts raw waste data into clear, interactive, and decision-ready insights. Instead of juggling multiple spreadsheets for actuals, targets, and historical comparisons, teams gain a centralized view of all waste-related KPIs. Because the dashboard is built in Power BI, it delivers speed, clarity, and visual intelligence—without unnecessary complexity.
Whether your goal is cost control, regulatory compliance, or ESG reporting, this dashboard empowers teams to track performance confidently and consistently.
🔑 Key Features of Waste Reduction KPI Dashboard in Power BI
📊 Centralized KPI Monitoring – Track all waste reduction KPIs from one interactive dashboard
🎯 MTD & YTD Performance Tracking – Monitor short-term progress and long-term trends together
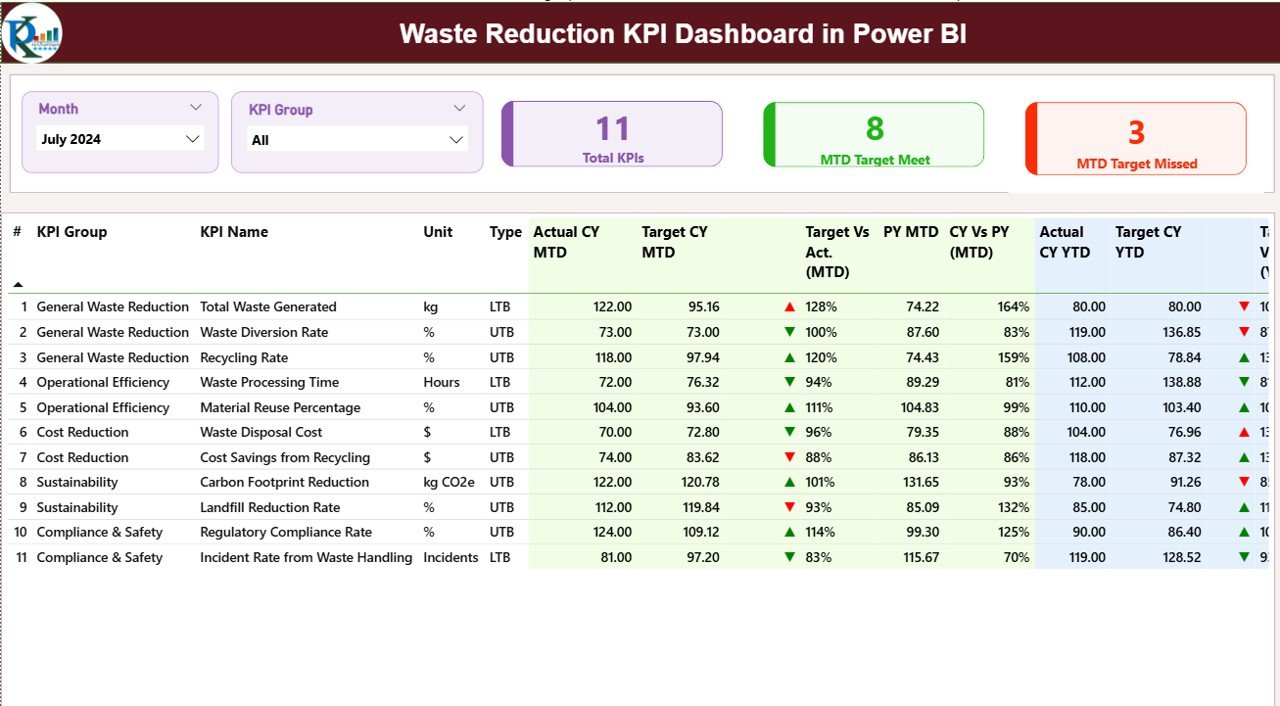
📅 Dynamic Month Slicer – Analyze performance for any reporting month instantly
🧩 KPI Group Slicer – Filter KPIs by category for focused analysis
🚦 Visual Status Indicators – Green and red arrows instantly show target met or missed
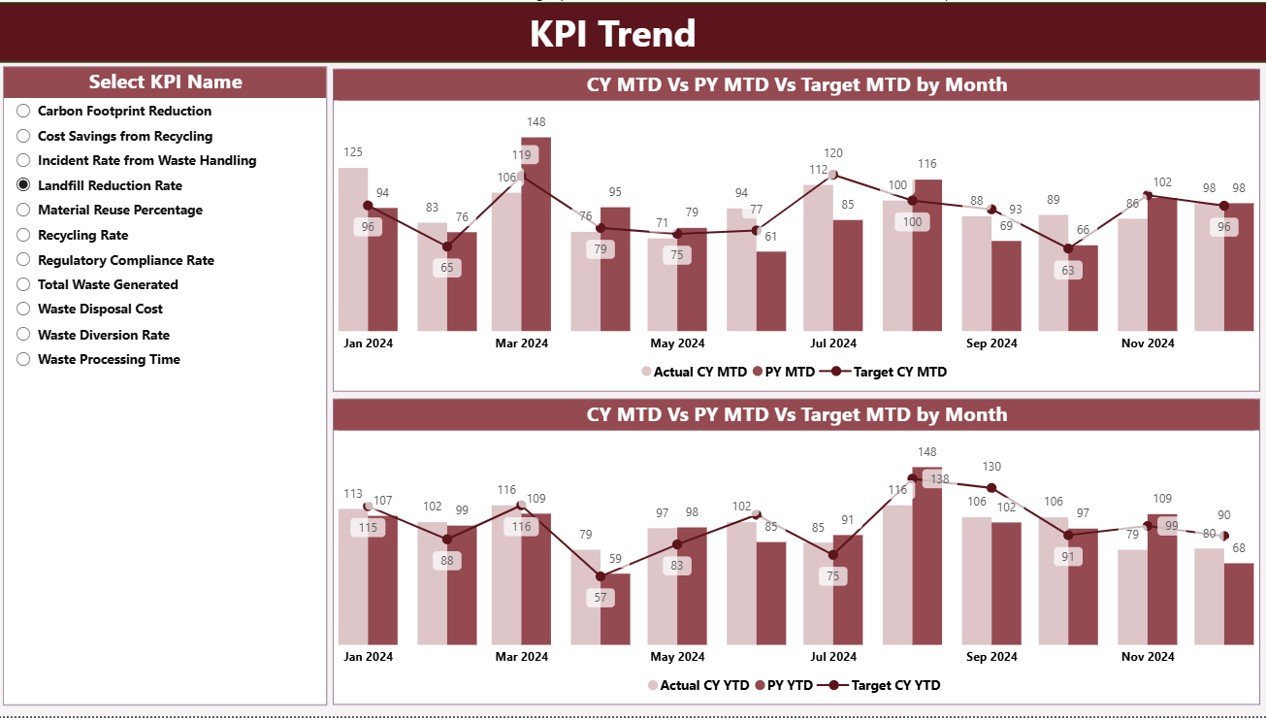
📈 Trend Analysis Charts – Compare current year, previous year, and targets visually
⚡ Excel-Based Data Input – Simple Excel sheets feed accurate Power BI visuals
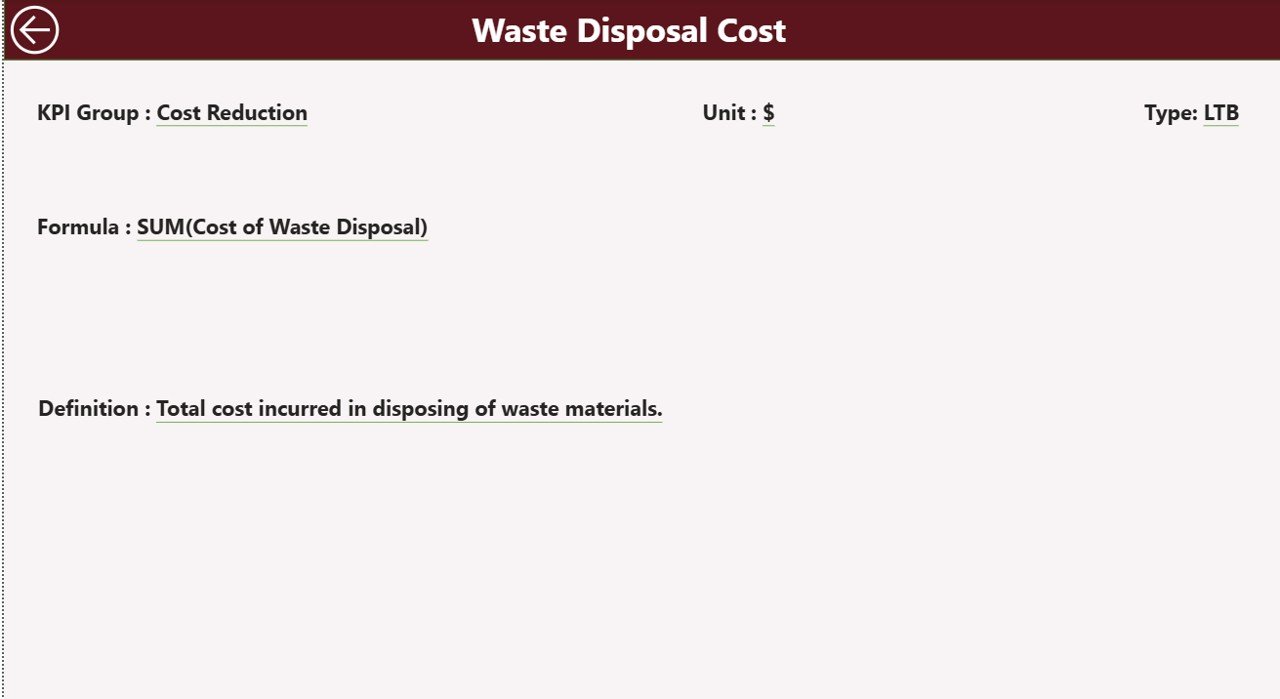
🔍 Drill-Through KPI Definitions – Access KPI logic, formulas, and units in one click
📂 What’s Inside the Waste Reduction KPI Dashboard in Power BI
This digital product includes three powerful analytical pages, each designed to support a different decision level:
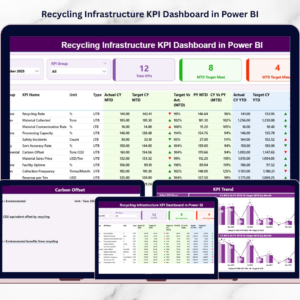
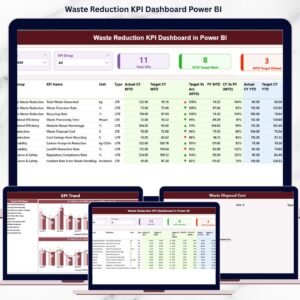
📌 Summary Page – The main control center showing total KPIs, MTD target meet count, and missed KPIs, along with a detailed KPI table
📌 KPI Trend Page – Interactive combo charts displaying MTD and YTD trends for selected KPIs
📌 KPI Definition Page – Drill-through page showing KPI formula, definition, unit, and KPI type (LTB or UTB)
In addition, the dashboard connects to a structured Excel data source containing:
-
Actual performance values
-
Target values
-
KPI definitions and metadata
This structure ensures accuracy, transparency, and easy maintenance.
🛠️ How to Use the Waste Reduction KPI Dashboard in Power BI
Using this dashboard is simple and business-friendly:
1️⃣ Enter actual performance values in the Input_Actual Excel sheet
2️⃣ Update target values in the Input_Target Excel sheet
3️⃣ Maintain KPI logic in the KPI Definition sheet
4️⃣ Refresh the Power BI dashboard
5️⃣ Use slicers to filter by month and KPI group
6️⃣ Review MTD and YTD performance in one table
7️⃣ Analyze trends using interactive charts
8️⃣ Drill through to KPI definitions when needed
No advanced Power BI skills required—just structured data and clear insights.
👥 Who Can Benefit from This Waste Reduction KPI Dashboard in Power BI
This dashboard is ideal for:
🌱 Sustainability Managers – Track and improve waste reduction initiatives
🏭 Operations Managers – Identify inefficiencies and cost-saving opportunities
📊 ESG & Compliance Teams – Support transparent and reliable reporting
🏢 Manufacturing Leaders – Monitor waste KPIs across processes
📈 Corporate Strategy Teams – Align sustainability goals with performance data
📋 Environmental Reporting Teams – Reduce manual reporting effort
Because the dashboard is flexible, it adapts easily across industries.


Reviews
There are no reviews yet.