Running a dermatology clinic today goes far beyond clinical expertise. Clinics must manage patient flow, track performance, control costs, and improve outcomes—simultaneously. However, without clear visibility, decision-making becomes slow and reactive. That is exactly why the Dermatology Clinics KPI Dashboard in Power BI is a must-have solution for modern dermatology practices.
This ready-to-use Power BI dashboard transforms complex clinical, operational, and financial data into clear, actionable insights. Instead of juggling multiple Excel files and manual reports, clinics gain one centralized dashboard that delivers real-time performance clarity. As a result, leaders make faster decisions, teams stay aligned, and clinics operate more efficiently.
🚀 Key Features of Dermatology Clinics KPI Dashboard in Power BI
📊 Centralized KPI Monitoring
Track all dermatology clinic KPIs in one interactive Power BI report without manual consolidation.
📅 MTD & YTD Performance Tracking
Analyze Month-to-Date and Year-to-Date performance side by side for better short-term and long-term decisions.
🎯 Target vs Actual Comparison
Instantly identify KPIs that meet or miss targets using visual indicators and percentage comparisons.
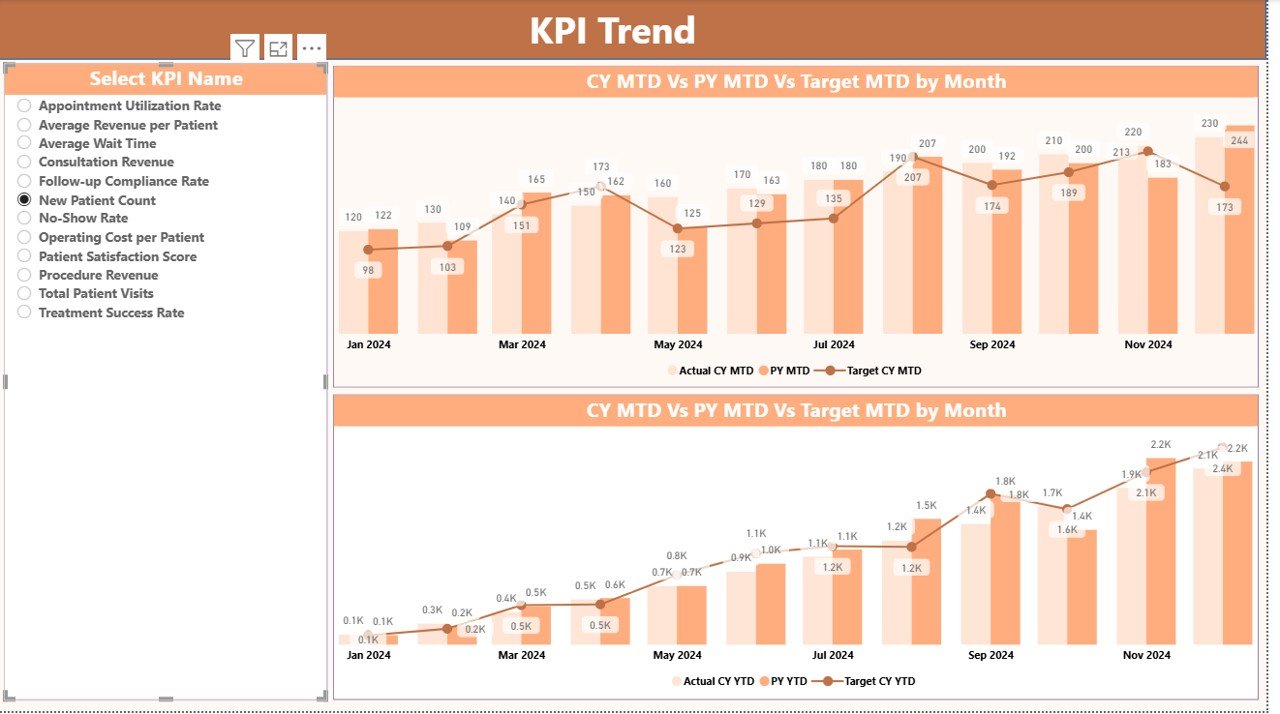
📈 Trend Analysis with Combo Charts
Compare Current Year, Previous Year, and Target values to spot trends and seasonality.
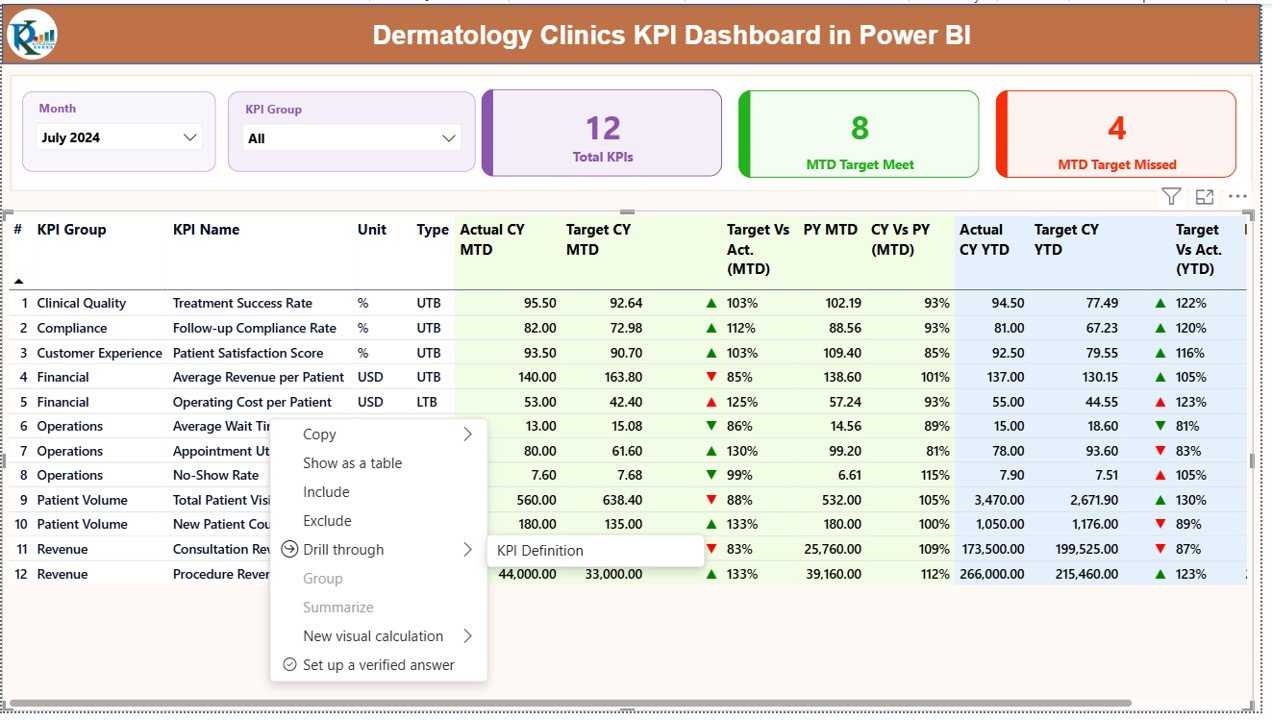
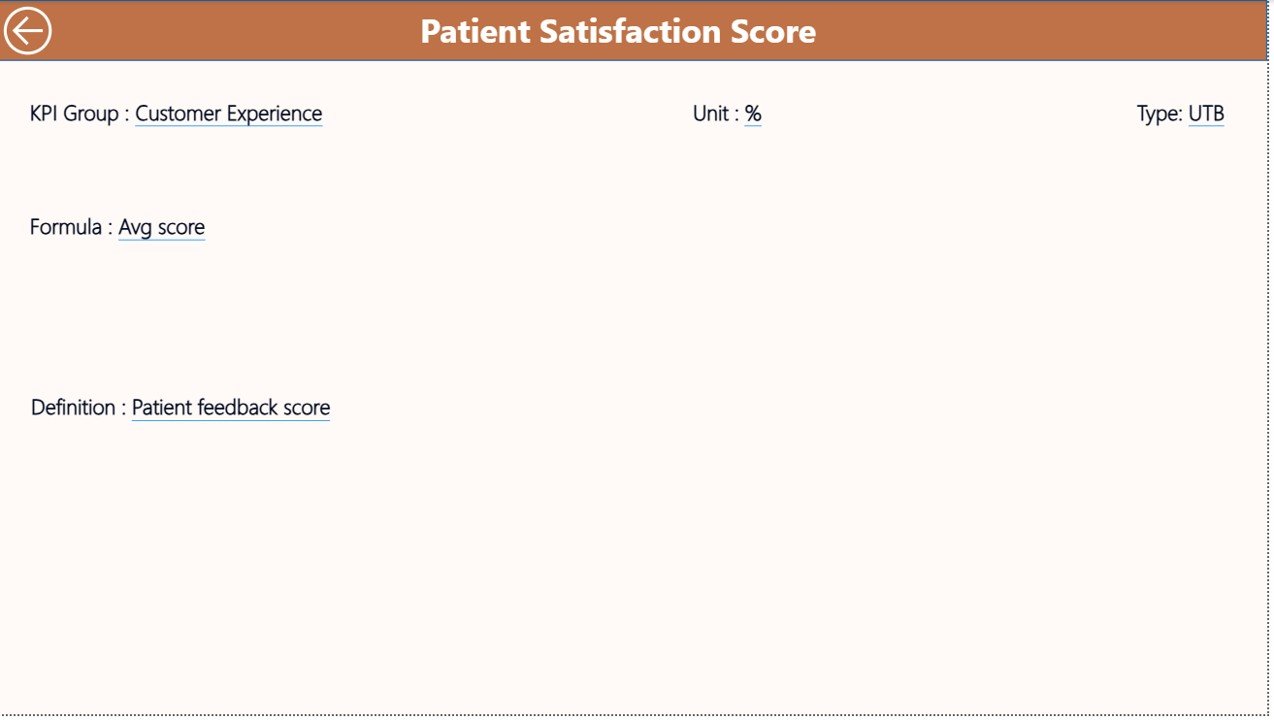
🔍 Drill-Through KPI Definitions
Click any KPI to instantly view its formula, unit, and interpretation for complete clarity.
🧩 Excel-Based Data Input
Easily update actuals, targets, and KPI definitions using structured Excel sheets—no technical skills required.
🎛️ Interactive Slicers
Filter performance by Month and KPI Group to focus on what matters most.
📐 UTB & LTB KPI Logic
Supports both Upper-the-Better and Lower-the-Better KPIs for accurate evaluation.
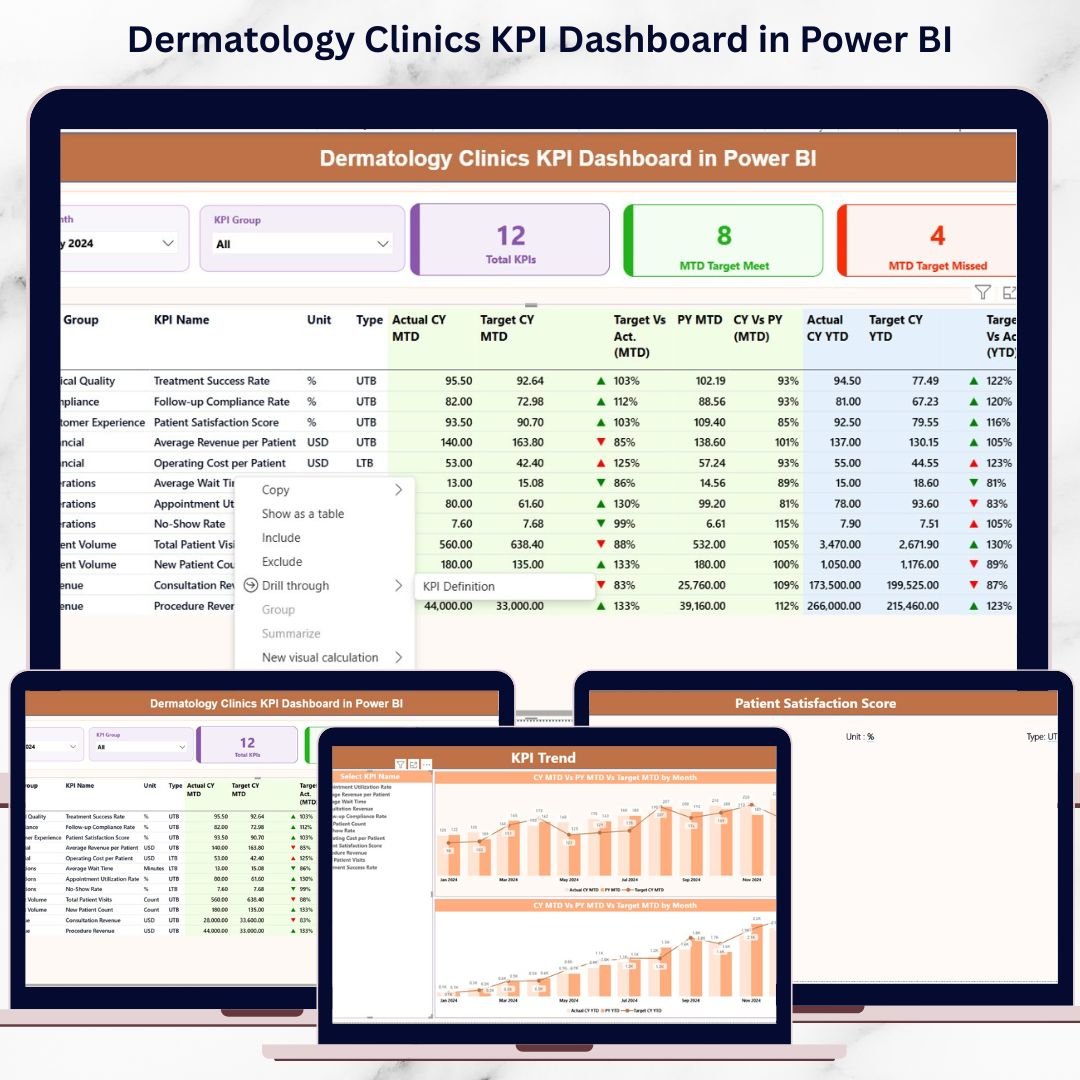
📂 What’s Inside the Dermatology Clinics KPI Dashboard in Power BI
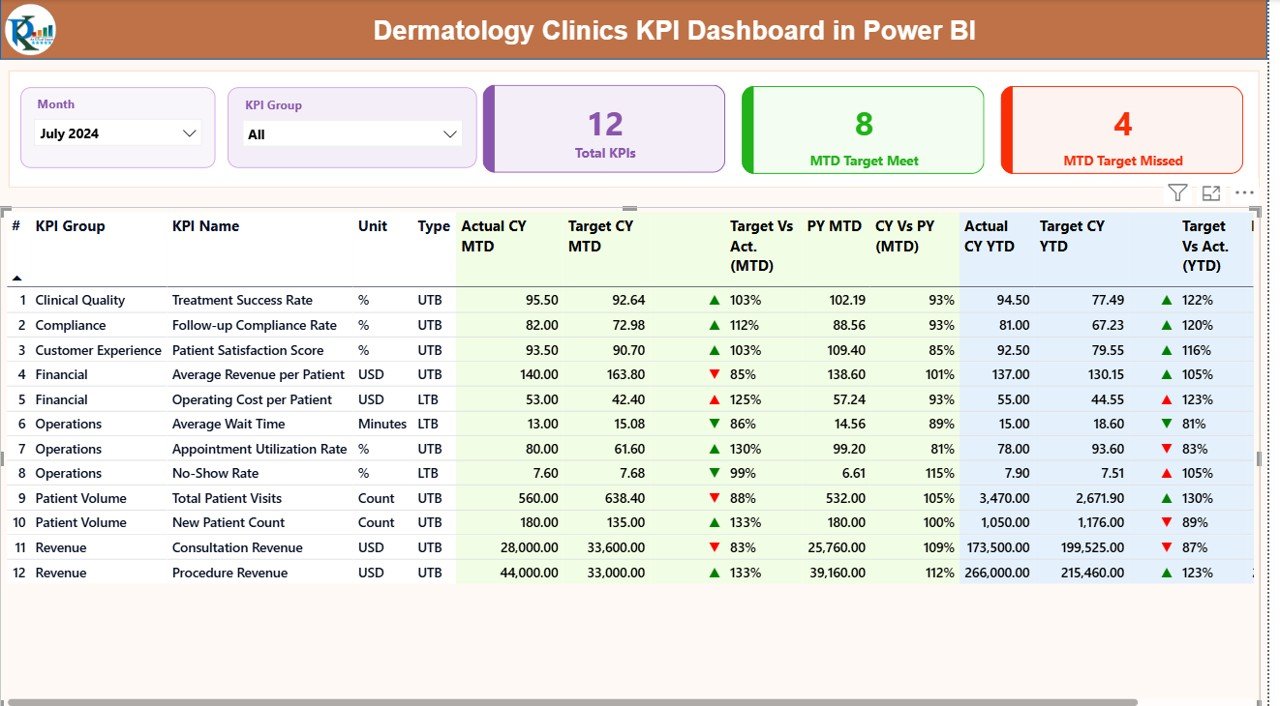
📄 Summary Page
A powerful overview showing Total KPIs, MTD Target Met, and MTD Target Missed counts, along with a detailed KPI table.
📈 KPI Trend Page
Visualizes performance movement over time using combo charts for MTD and YTD comparisons.
📘 KPI Definition Page
A hidden drill-through page that explains each KPI’s formula, unit, type, and definition.
📊 Structured Excel Data Model
Includes:
-
Input_Actual sheet
-
Input_Target sheet
-
KPI Definition sheet
This structure ensures clean data flow and consistent reporting.
🛠️ How to Use the Dermatology Clinics KPI Dashboard in Power BI
First, enter actual KPI values into the Input_Actual Excel sheet.
Next, define monthly and yearly targets in the Input_Target sheet.
Then, maintain KPI logic in the KPI Definition sheet.
After that, refresh the Power BI file.
Finally, use slicers, tables, and charts to analyze performance instantly.
Because everything updates dynamically, you always see the latest insights.
👩⚕️ Who Can Benefit from This Dermatology Clinics KPI Dashboard in Power BI
🏥 Dermatology Clinic Owners
📋 Medical Directors
📊 Operations Managers
💰 Finance & Billing Teams
⭐ Quality & Compliance Teams
Whether you manage a single clinic or multiple locations, this dashboard scales with your needs.
Click here to read the Detailed blog post
Watch the step-by-step video tutorial:


Reviews
There are no reviews yet.