
Managing electricity projects without clear, real-time performance visibility can quickly turn small issues into major risks. Because electricity projects involve high capital investment, strict regulatory compliance, tight timelines, and multiple stakeholders, even a minor KPI deviation can cause serious cost overruns or schedule delays.
That is exactly why the Electricity Project KPI Dashboard in Power BI is designed as a powerful, ready-to-use performance monitoring solution.
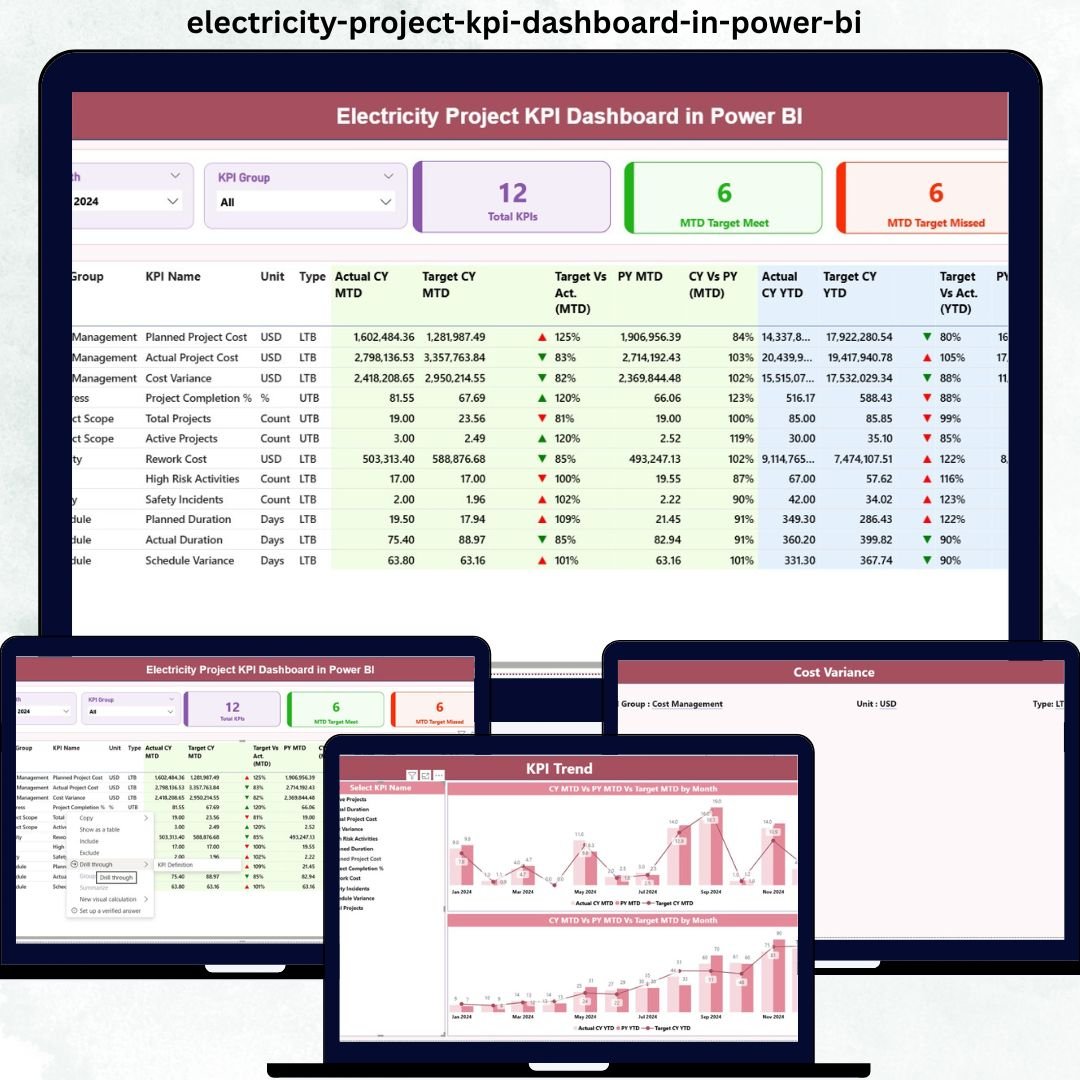
This dashboard converts complex electricity project data into clear KPIs, visual indicators, and actionable insights. Instead of relying on scattered Excel files or manual reporting, project teams get a centralized Power BI dashboard that highlights performance gaps, trends, and accountability—month after month.
⚡ Key Features of Electricity Project KPI Dashboard in Power BI
🚀 Centralized KPI Monitoring
Track all electricity project KPIs from a single interactive Power BI dashboard without juggling multiple reports.
📅 Dynamic Month & KPI Group Slicers
Instantly filter KPIs by reporting month or functional group for focused and quick analysis.
🎯 MTD & YTD Performance Tracking
Monitor both short-term and long-term project performance with automated Month-to-Date and Year-to-Date calculations.
📊 Target vs Actual Analysis
Clearly see whether KPIs meet or miss targets using visual indicators and percentage comparisons.
🔁 CY vs PY Comparisons
Analyze current year performance against previous year values to identify growth or decline.
📈 Interactive KPI Trend Analysis
Use combo charts to visualize KPI trends over time and detect performance patterns early.

📦 What’s Inside the Electricity Project KPI Dashboard in Power BI
This digital product includes a professionally designed Power BI dashboard file connected to a structured Excel data source.
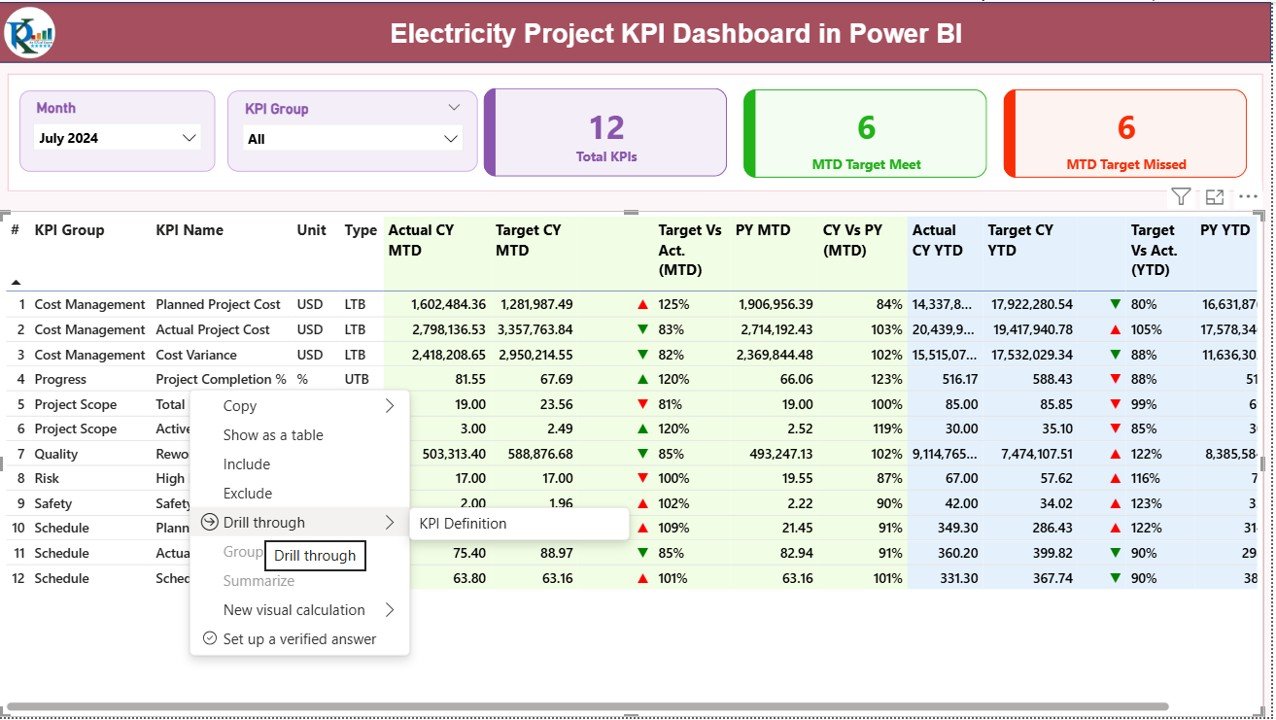
🔹 Summary Page
-
Month & KPI Group slicers
-
KPI cards showing total KPIs, target met, and target missed
-
Detailed KPI performance table with MTD and YTD analysis
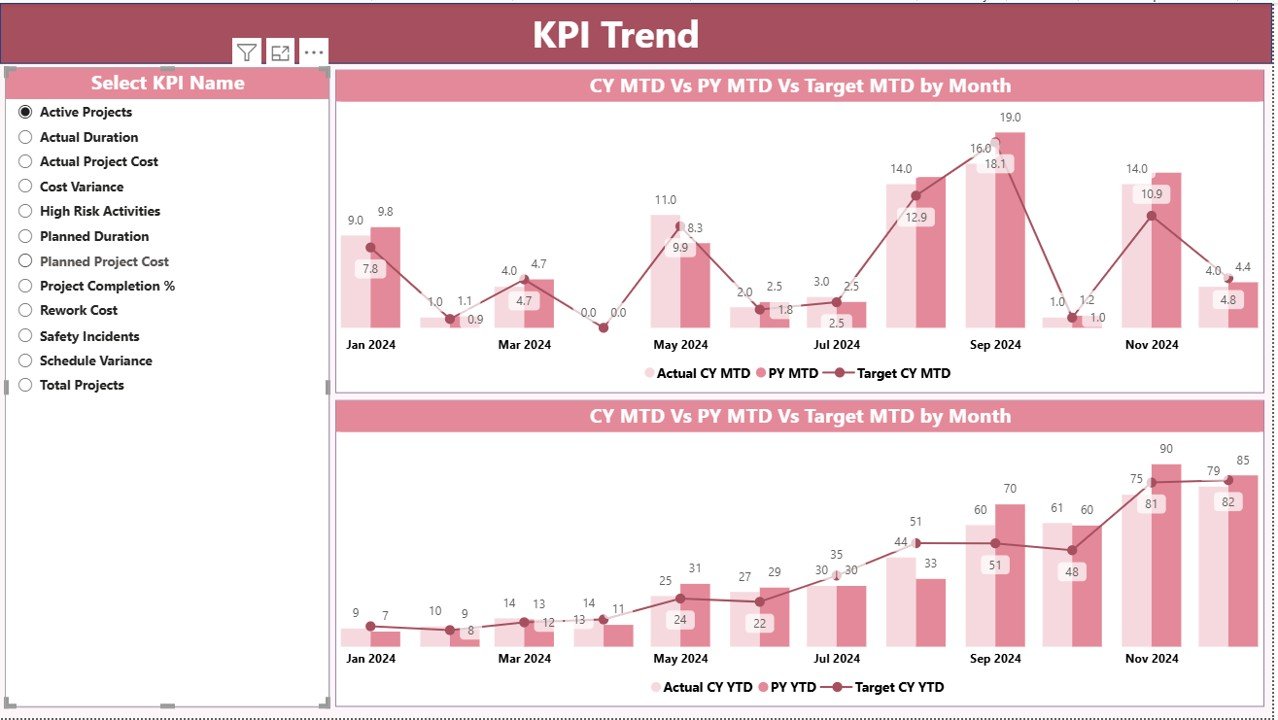
🔹 KPI Trend Page
-
Combo charts showing Actual CY, Actual PY, and Target trends
-
KPI Name slicer to analyze one KPI at a time
🔹 KPI Definition Page
-
Drill-through reference page
-
KPI formulas, definitions, units, and types (UTB / LTB)
🔹 Excel Data Files
-
Input_Actual sheet for actual performance
-
Input_Target sheet for planned targets
-
KPI Definition sheet for governance and consistency
🛠️ How to Use the Electricity Project KPI Dashboard in Power BI
Using this dashboard is simple and does not require advanced Power BI expertise.
1️⃣ Update actual KPI values in the Excel Input_Actual sheet
2️⃣ Maintain targets in the Excel Input_Target sheet
3️⃣ Refresh the Power BI dashboard
4️⃣ Use slicers to analyze KPIs by month or group
5️⃣ Review cards, tables, and trends for performance insights
Because data entry happens in Excel, both technical and non-technical users can easily manage and maintain the dashboard.
👥 Who Can Benefit from This Electricity Project KPI Dashboard in Power BI
This dashboard is ideal for organizations and professionals involved in electricity and energy projects:
⚡ Electricity utilities
⚡ Power generation companies
⚡ EPC contractors
⚡ Project managers and planners
⚡ Energy consultants
⚡ Government electricity boards
Whether you manage a single project or multiple large-scale initiatives, this dashboard scales effortlessly to your needs.
Click here to read the Detailed Blog Post
Visit our YouTube channel to learn step-by-step video tutorials


Reviews
There are no reviews yet.