Managing electricity contracts without real-time performance visibility is risky, time-consuming, and expensive. Because electricity contracts involve high financial exposure, strict compliance requirements, long timelines, and multiple stakeholders, even a minor KPI miss can create serious operational and financial consequences.
That is exactly why the Electricity Contract KPI Dashboard in Power BI is designed as a powerful, ready-to-use performance monitoring solution.
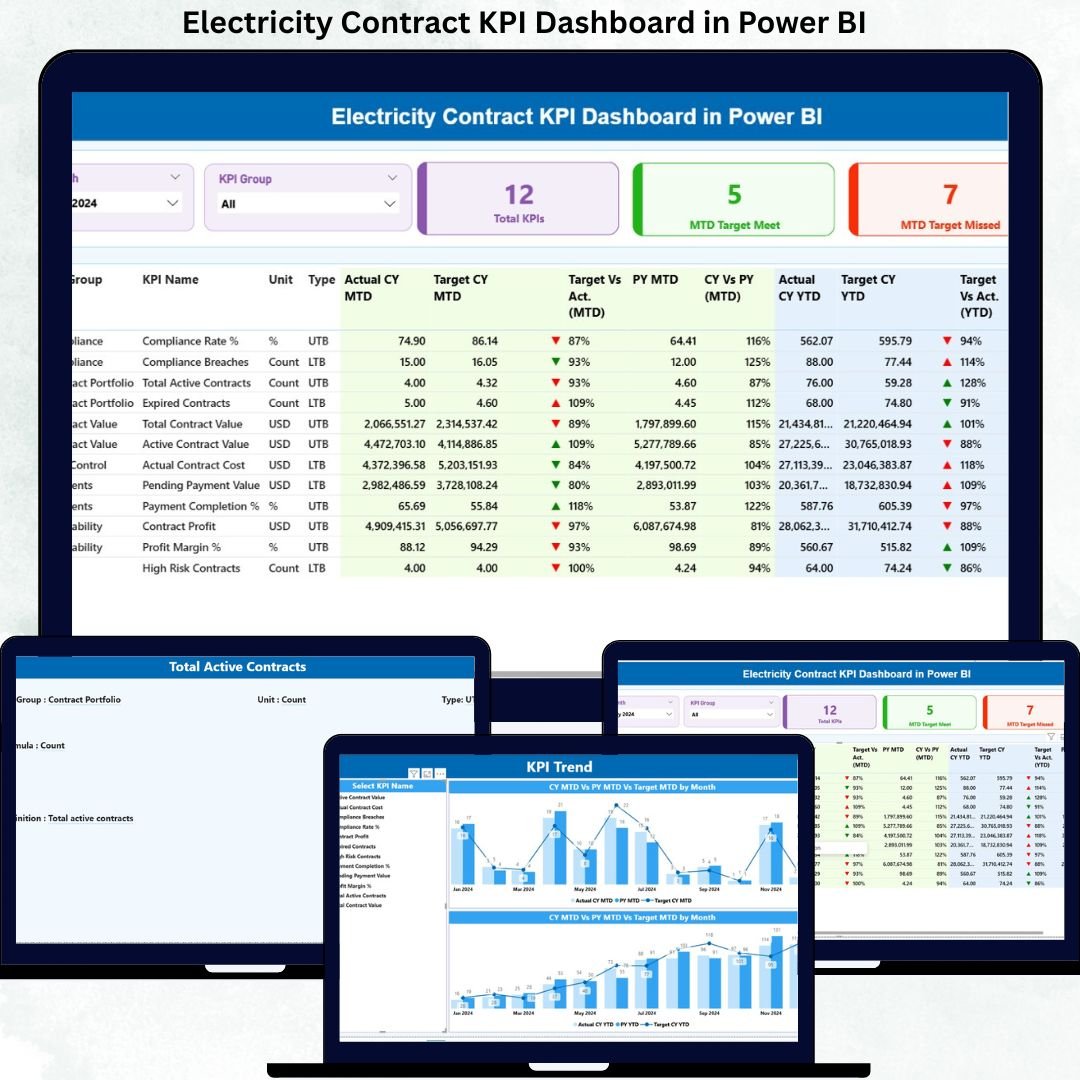
This dashboard transforms raw contract KPI data into clear, interactive, and actionable insights. Instead of relying on scattered Excel files and manual reporting, decision-makers get a single, centralized Power BI dashboard that tracks targets, performance gaps, trends, and accountability—month after month.
🚀 Key Features of Electricity Contract KPI Dashboard in Power BI
📊 Centralized KPI Monitoring
Track all electricity contract KPIs in one structured Power BI dashboard instead of managing multiple disconnected reports.
📅 Dynamic Month & KPI Group Slicers
Instantly filter performance by reporting month and KPI category for focused analysis.
🎯 MTD & YTD Performance Tracking
Monitor Month-to-Date and Year-to-Date performance with automatic calculations.
📈 Target vs Actual Analysis
Clearly identify whether KPIs meet or miss targets using intuitive percentage comparisons.
🔄 CY vs PY Comparisons
Analyze current year performance against previous year results to measure improvement or decline.
🚦 Visual Performance Indicators
Green and red icons instantly highlight target achievement and missed KPIs.
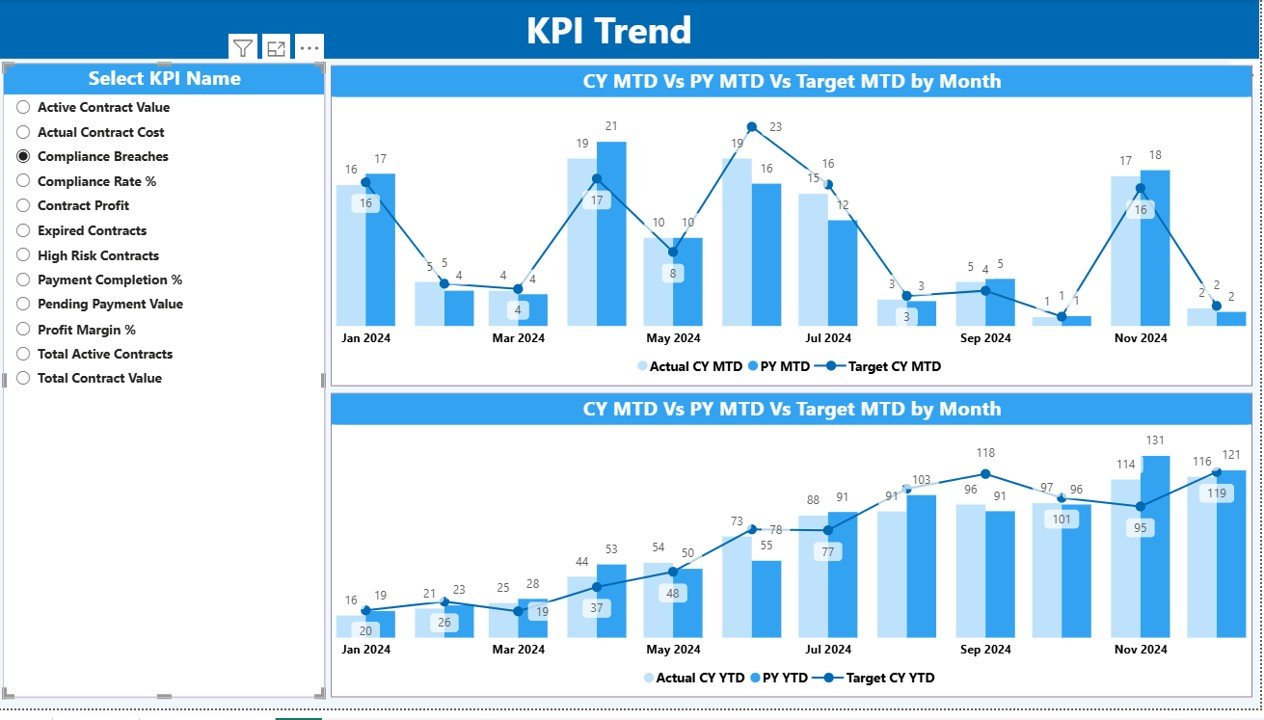
📉 Trend Analysis with Combo Charts
Understand performance behavior over time using Actual, Target, and Previous Year trend visuals.
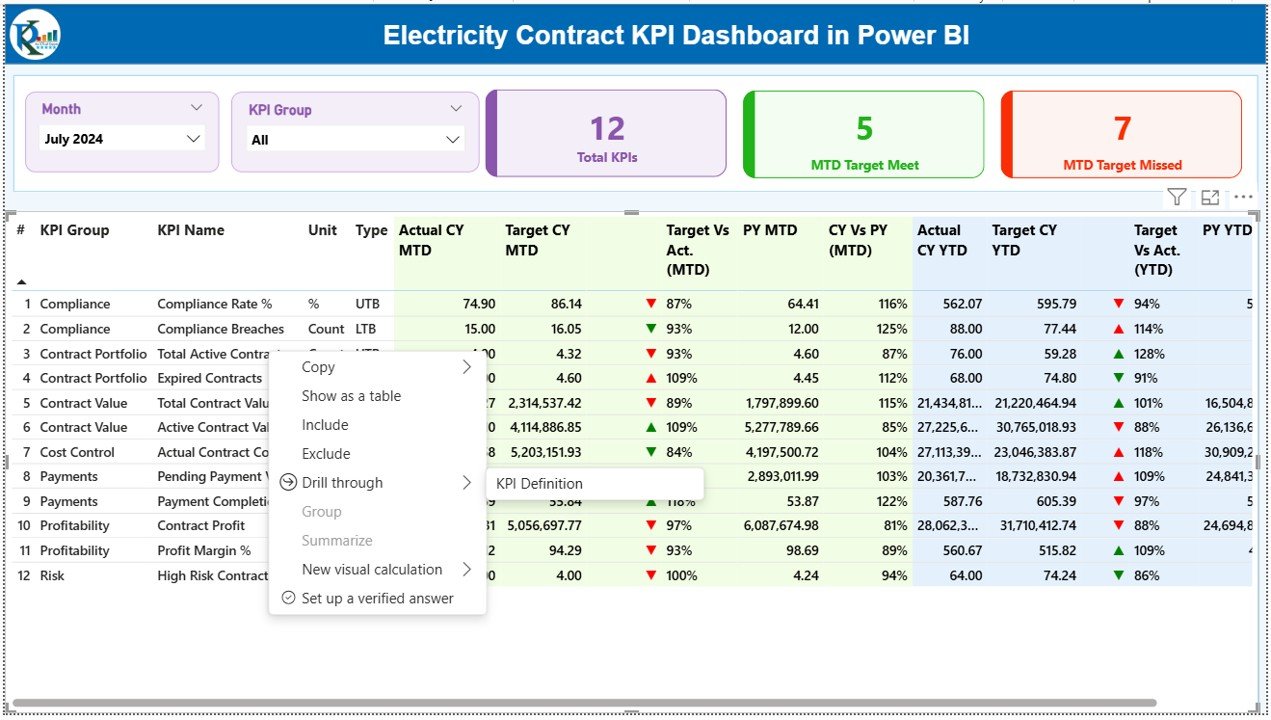
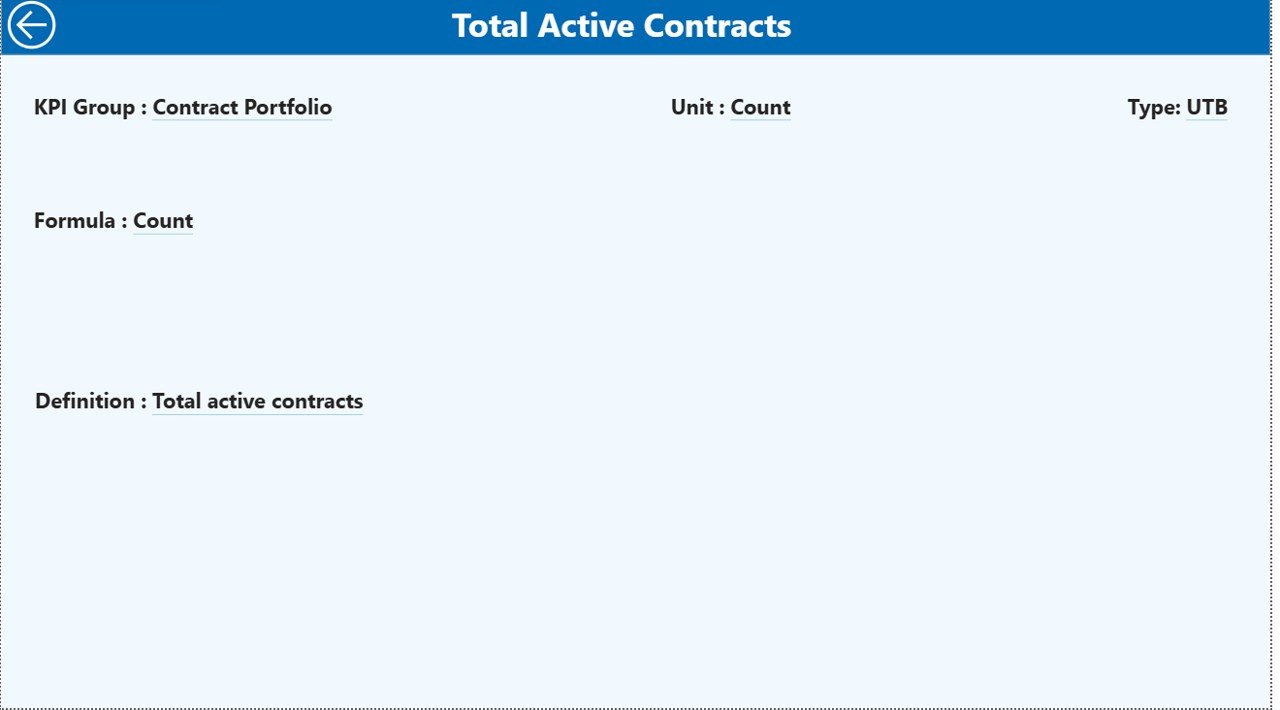
📘 Built-in KPI Definition & Governance
Ensure clarity with a dedicated KPI definition page covering formulas, units, and KPI type.
📦 What’s Inside the Electricity Contract KPI Dashboard in Power BI
This ready-to-use Power BI file includes three professionally designed analytical pages, each serving a unique purpose:
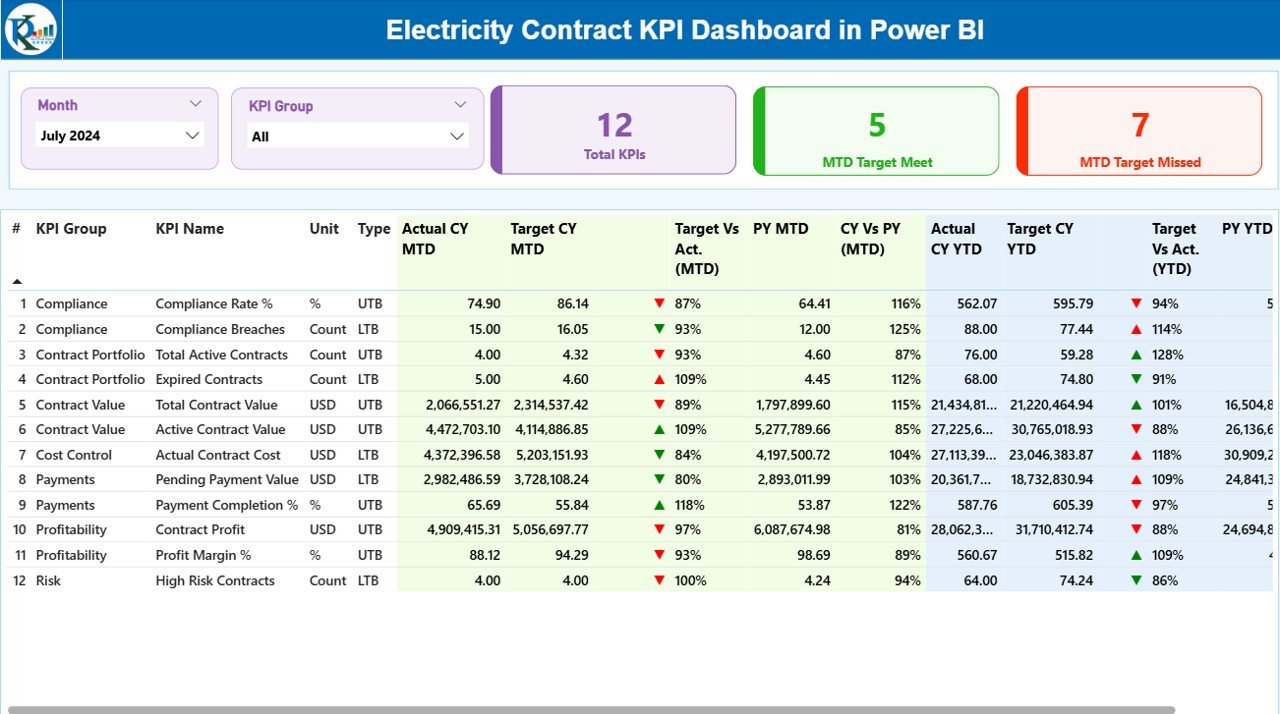
📌 Summary Page
The control center of the dashboard showing:
-
Total KPI count
-
MTD target met count
-
MTD target missed count
-
Detailed KPI table with MTD and YTD performance metrics
📌 KPI Trend Page
Focused on historical analysis, featuring:
-
MTD trend: Actual vs Target vs Previous Year
-
YTD trend: Actual vs Target vs Previous Year
-
KPI selection slicer for deep-dive analysis
📌 KPI Definition Page
A governance and reference layer that displays:
-
KPI definition
-
Formula
-
Unit of measurement
-
KPI type (LTB or UTB)
A built-in Back Button ensures seamless navigation.
🛠️ How to Use the Electricity Contract KPI Dashboard in Power BI
Using this dashboard is simple and efficient:
📝 Step 1: Enter Data in Excel
Update Actual and Target values in structured Excel input sheets.
🔗 Step 2: Connect Excel to Power BI
Power BI automatically reads and models the data.
🔄 Step 3: Refresh the Dashboard
With one click, all KPIs, visuals, and calculations update instantly.
📊 Step 4: Analyze & Act
Use slicers, tables, and charts to identify gaps, trends, and risks.
This workflow makes performance monitoring fast, accurate, and reliable—even for non-technical users.
👥 Who Can Benefit from This Electricity Contract KPI Dashboard in Power BI
This dashboard is ideal for:
⚡ Electricity Boards & Power Utilities
📑 Contract Management Teams
🏗️ EPC Contractors
📊 Finance & Compliance Teams
🧾 Energy Project Managers
🏢 Senior Management & Leadership
Anyone responsible for contract performance, compliance, or reporting will benefit from this solution.
Click here to read the detailed blog post
Watch the step-by-step video tutorial:


Reviews
There are no reviews yet.