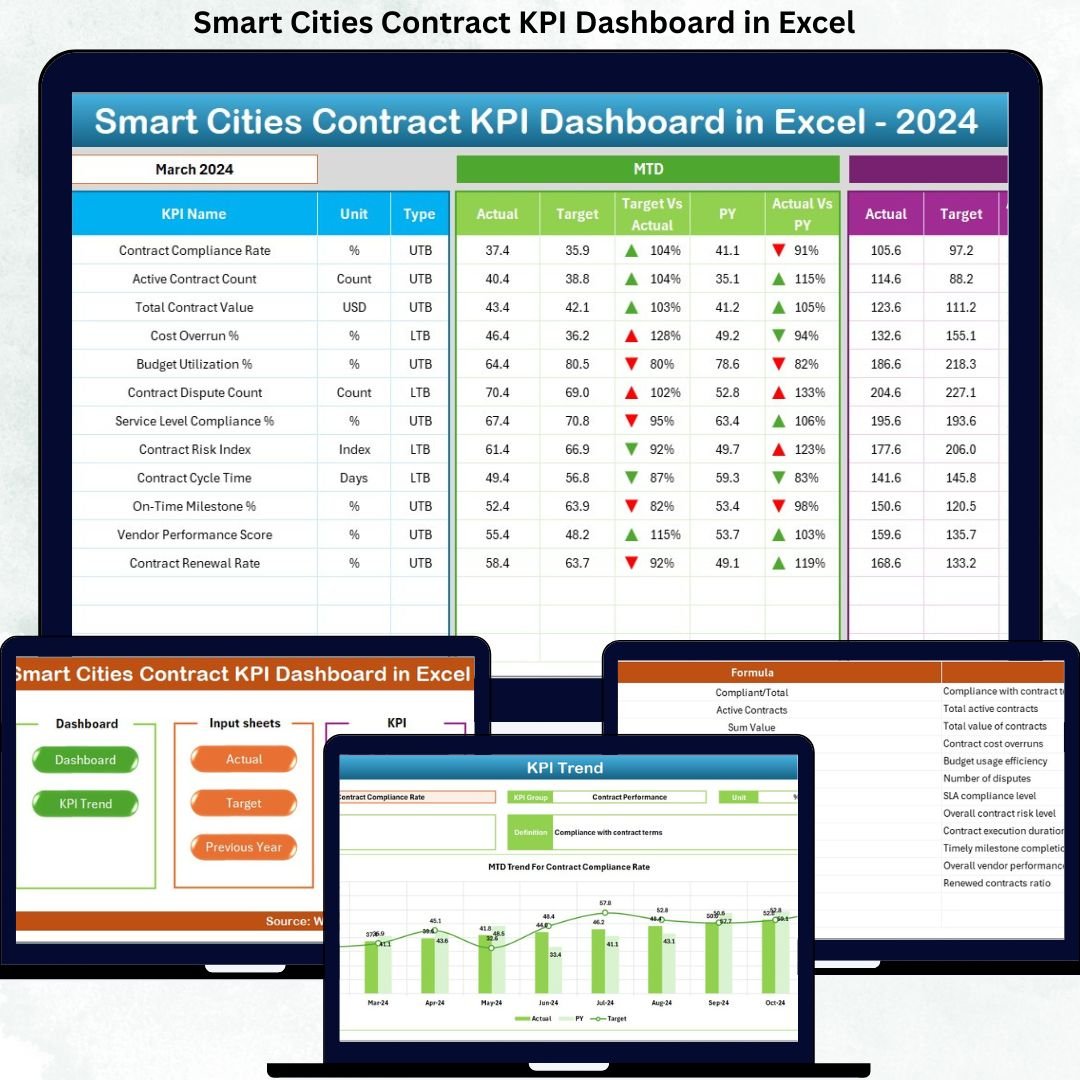
Managing contracts in smart city projects becomes challenging when teams rely on scattered spreadsheets, manual tracking, and delayed reports. That approach often hides risks, creates compliance gaps, and slows decision-making. The Smart Cities Contract KPI Dashboard in Excel solves this problem by converting complex contract data into clear, visual, and actionable insights—inside a single, powerful Excel file.
This ready-to-use dashboard helps you monitor contract performance, compare targets, analyze trends, and maintain transparency across smart city initiatives. Moreover, it eliminates the need for expensive BI tools while delivering enterprise-level reporting clarity. If you want control, visibility, and confidence in smart city contract management, this dashboard delivers exactly that.
🔑 Key Features of Smart Cities Contract KPI Dashboard in Excel
📊 Centralized Contract KPI Monitoring
Track all smart city contract KPIs in one structured Excel dashboard instead of managing multiple files.
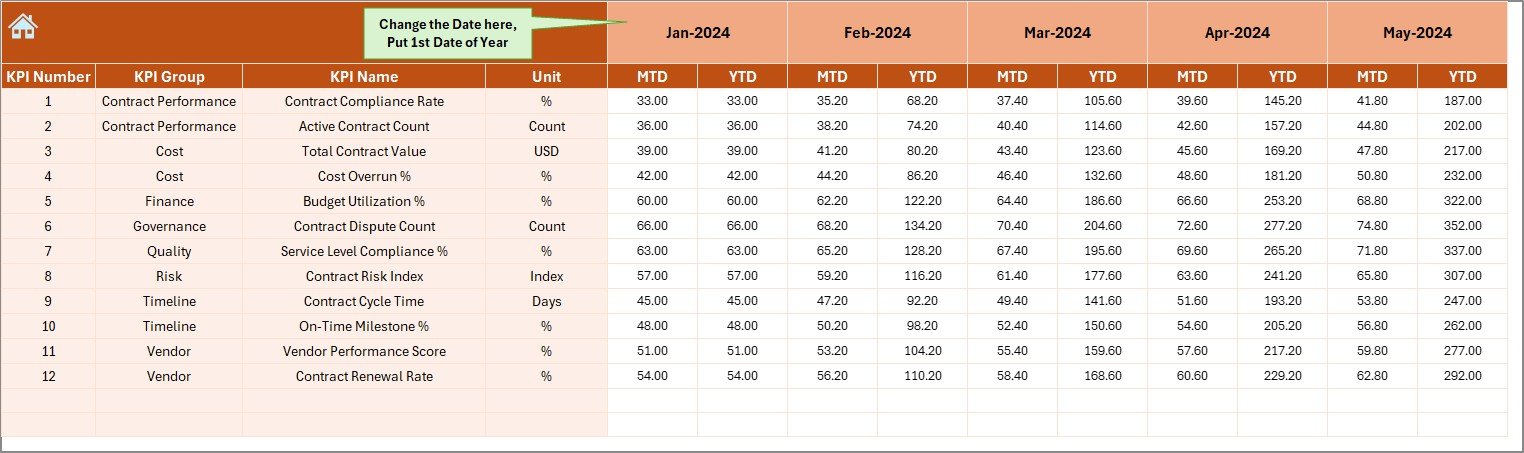
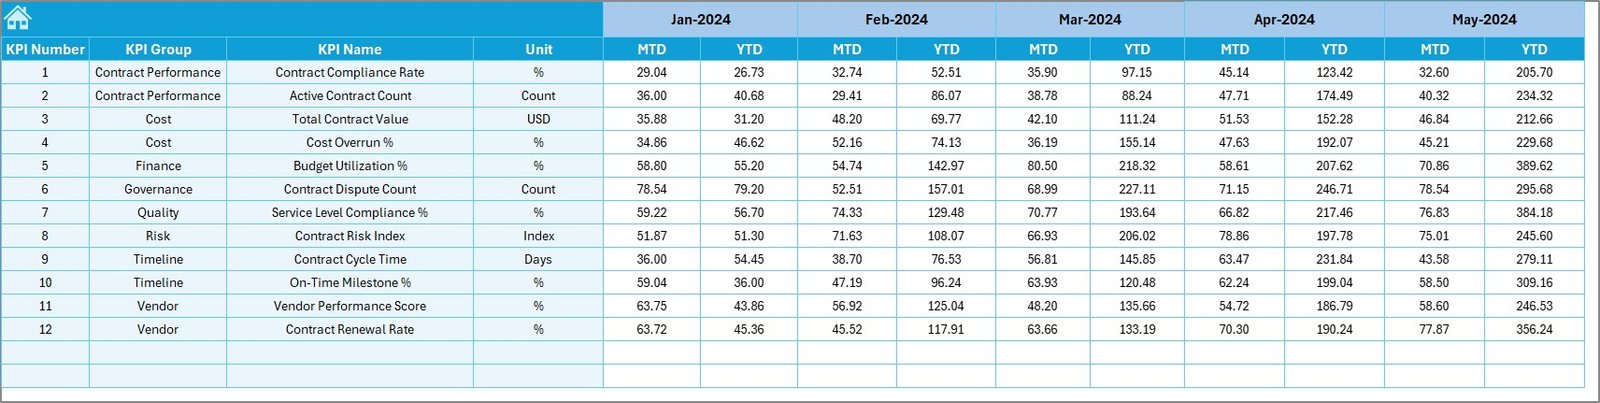
📅 MTD & YTD Performance Tracking
Monitor Month-to-Date and Year-to-Date Actuals, Targets, and Previous Year values for every KPI.
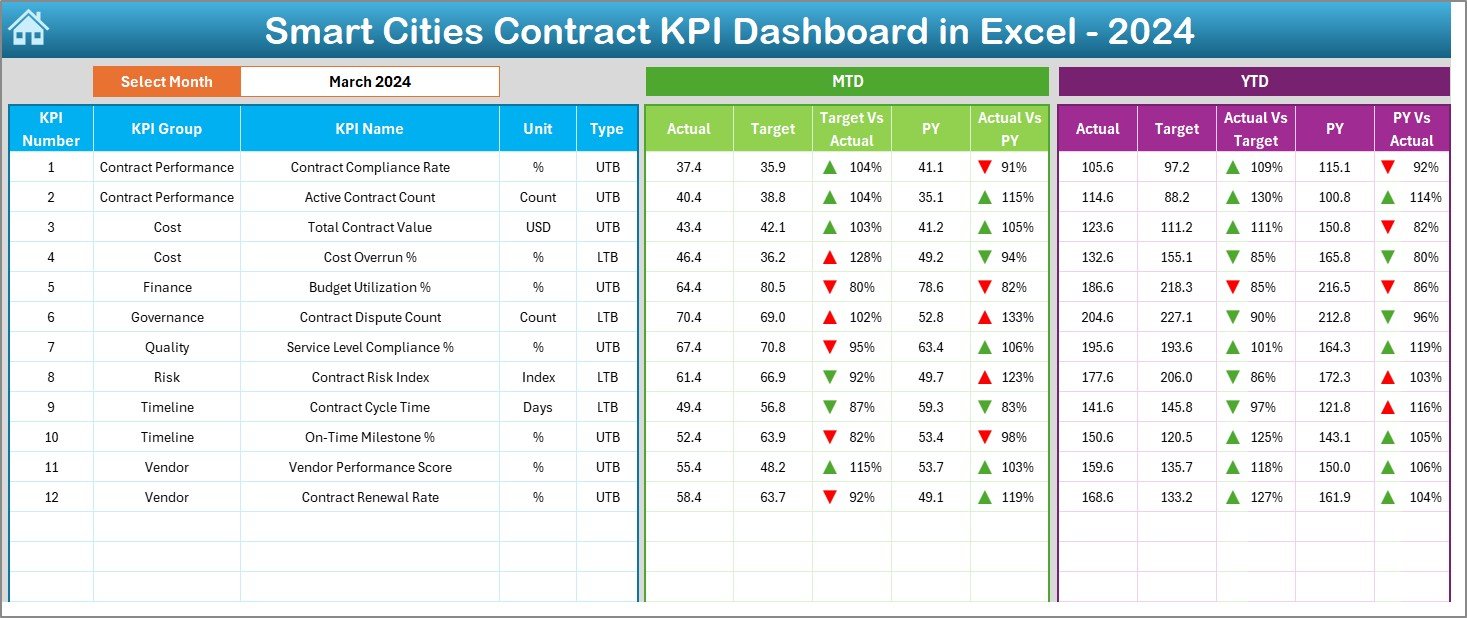
🎯 Target vs Actual Analysis
Instantly identify deviations using automated variance calculations and visual indicators.
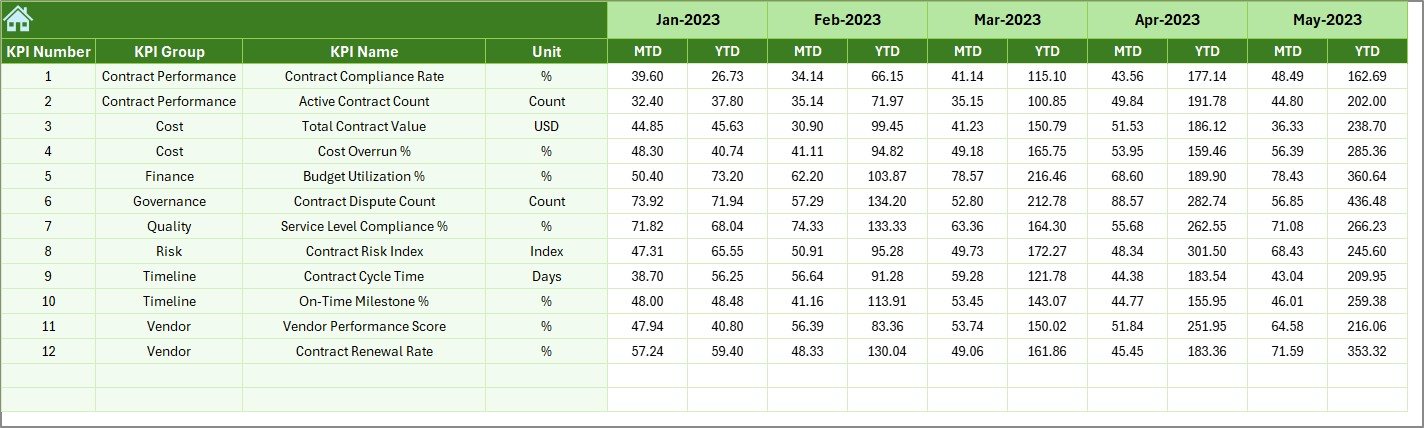
📉 Previous Year Comparison
Compare current performance with last year to measure improvement, decline, and consistency.
🔺 Visual Performance Indicators
Conditional formatting with up and down arrows highlights positive and negative trends at a glance.
🔄 Dynamic Month Selection
Change the reporting month using a simple drop-down, and the entire dashboard updates instantly.
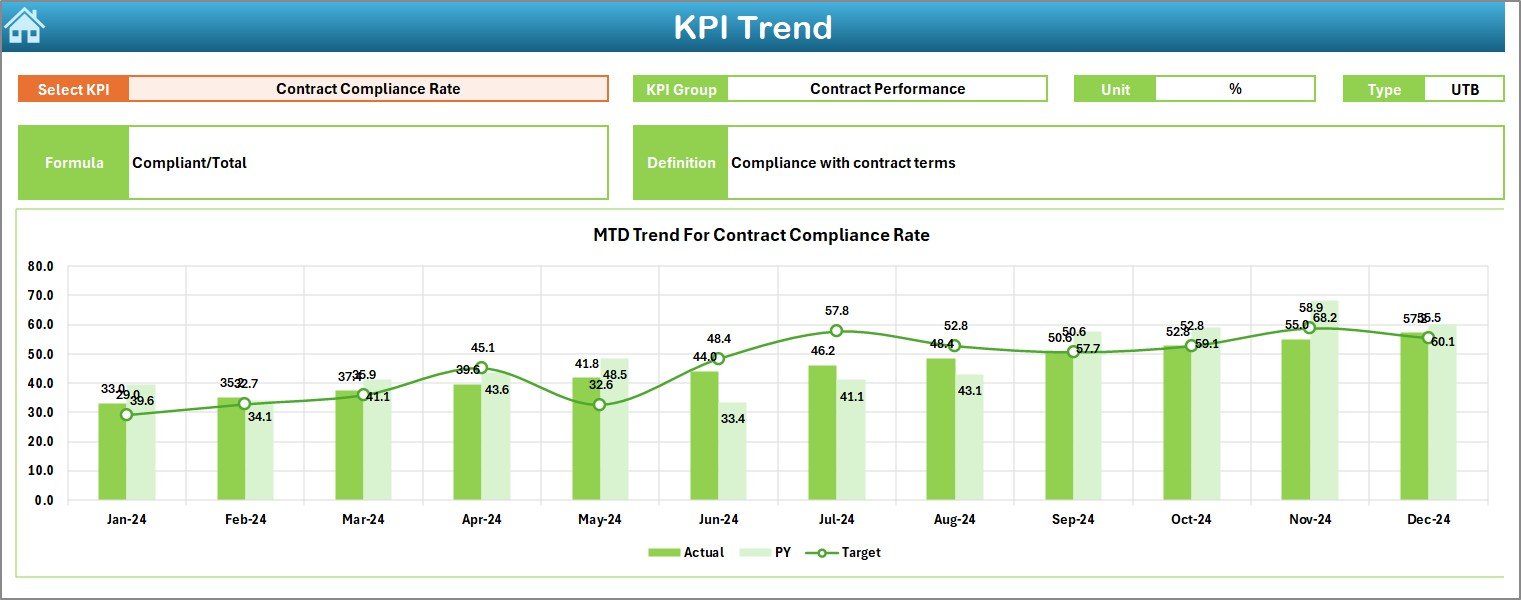
📈 Interactive KPI Trend Analysis
Analyze KPI-wise trends with dynamic charts for deeper performance insights.
📦 What’s Inside the Smart Cities Contract KPI Dashboard in Excel
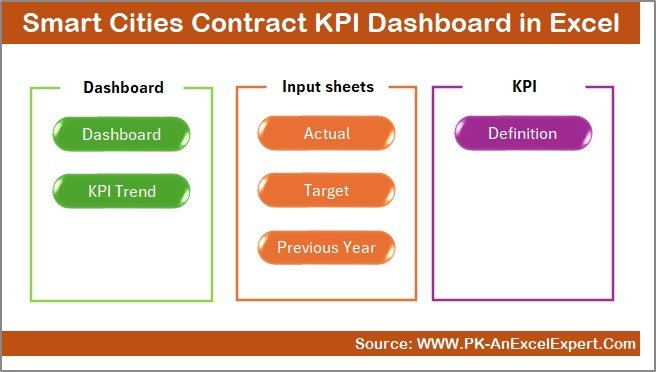
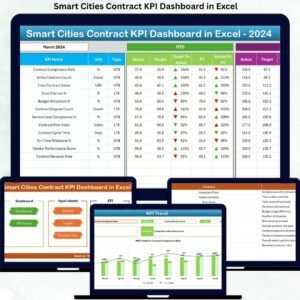
This professionally designed dashboard includes 7 well-structured worksheets, each created for clarity and ease of use:
📌 Summary Page – An index sheet with navigation buttons to move quickly across all dashboard sections.
📌 Dashboard Sheet – The core dashboard showing MTD & YTD Actuals, Targets, Previous Year data, and variance indicators.
📌 Trend Sheet – KPI-level analysis with trend charts, KPI groups, units, definitions, and comparisons.
📌 Actual Numbers Sheet – A clean input sheet to enter monthly MTD and YTD actual contract data.
📌 Target Sheet – A dedicated sheet for defining monthly KPI targets to ensure accurate benchmarking.
📌 Previous Year Numbers Sheet – Stores historical data for year-over-year comparison and trend evaluation.
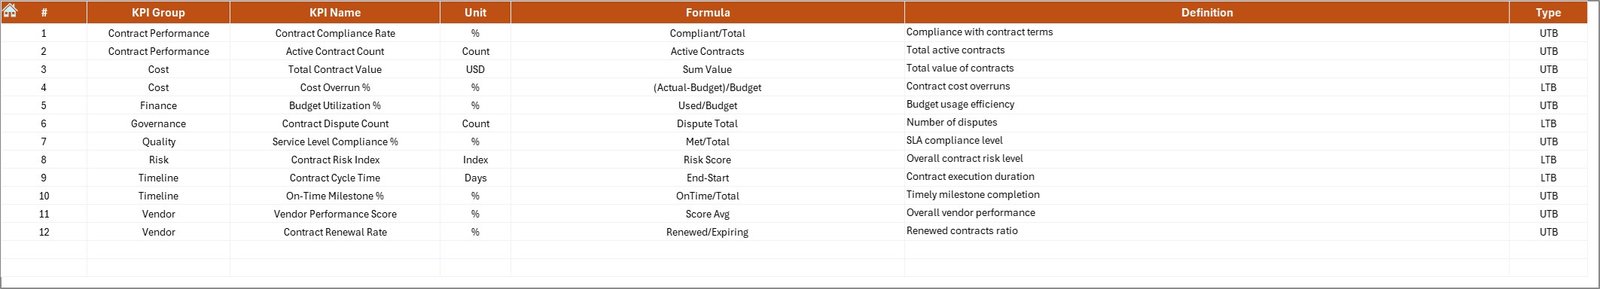
📌 KPI Definition Sheet – A reference sheet containing KPI names, formulas, units, definitions, and KPI types.
Because each worksheet has a clear role, users experience faster reporting and fewer data errors.
🛠️ How to Use the Smart Cities Contract KPI Dashboard in Excel
Using this dashboard is simple and intuitive—even for non-technical users:
1️⃣ Enter actual contract performance data in the Actual Numbers sheet.
2️⃣ Define monthly targets in the Target Sheet.
3️⃣ Add previous-year values in the Previous Year Numbers sheet.
4️⃣ Select the reporting month from the drop-down in cell D3.
5️⃣ Instantly view updated KPIs, variances, and trends on the Dashboard and Trend sheets.
As a result, you spend less time preparing reports and more time making informed decisions.
👥 Who Can Benefit from This Smart Cities Contract KPI Dashboard in Excel
This dashboard is ideal for professionals and organizations involved in smart city initiatives, including:
🏗️ Smart city project managers
📑 Contract management teams
🧾 Procurement and vendor management teams
🏛️ Government and municipal authorities
📊 Finance, audit, and compliance teams
🚦 Infrastructure, utilities, and mobility project teams
If your role involves monitoring contracts, ensuring compliance, or improving transparency, this dashboard fits perfectly.
Click here to read the Detailed Blog Post
Watch the step-by-step video tutorial:


Reviews
There are no reviews yet.