




Managing contracts in port operations is never simple. Ports deal with high-value agreements covering terminal operations, logistics, maintenance, dredging, security, IT services, and infrastructure development. Each contract carries financial risk, compliance obligations, renewal timelines, and performance targets. However, when contract KPIs are scattered across multiple Excel files, emails, and manual reports, visibility drops and control weakens fast.
That is exactly why the Port Contract Management KPI Dashboard in Excel is a powerful, business-ready solution designed for modern port operations.
This professionally structured Excel dashboard converts complex contract data into a centralized, interactive, and decision-ready KPI system. Instead of manually tracking numbers, teams gain instant insights into contract performance, compliance gaps, financial exposure, and operational risks—all from one dynamic dashboard.
Because it is built entirely in Excel, this solution requires no expensive BI tools, no technical setup, and no advanced Excel skills. You can deploy it immediately and start monitoring contract KPIs with confidence.
🔑 Key Features of Port Contract Management KPI Dashboard in Excel
🚀 Centralized KPI Monitoring – Track all critical port contract KPIs from a single dashboard
📅 Dynamic Month Selection – Change the reporting month using a drop-down and see instant updates
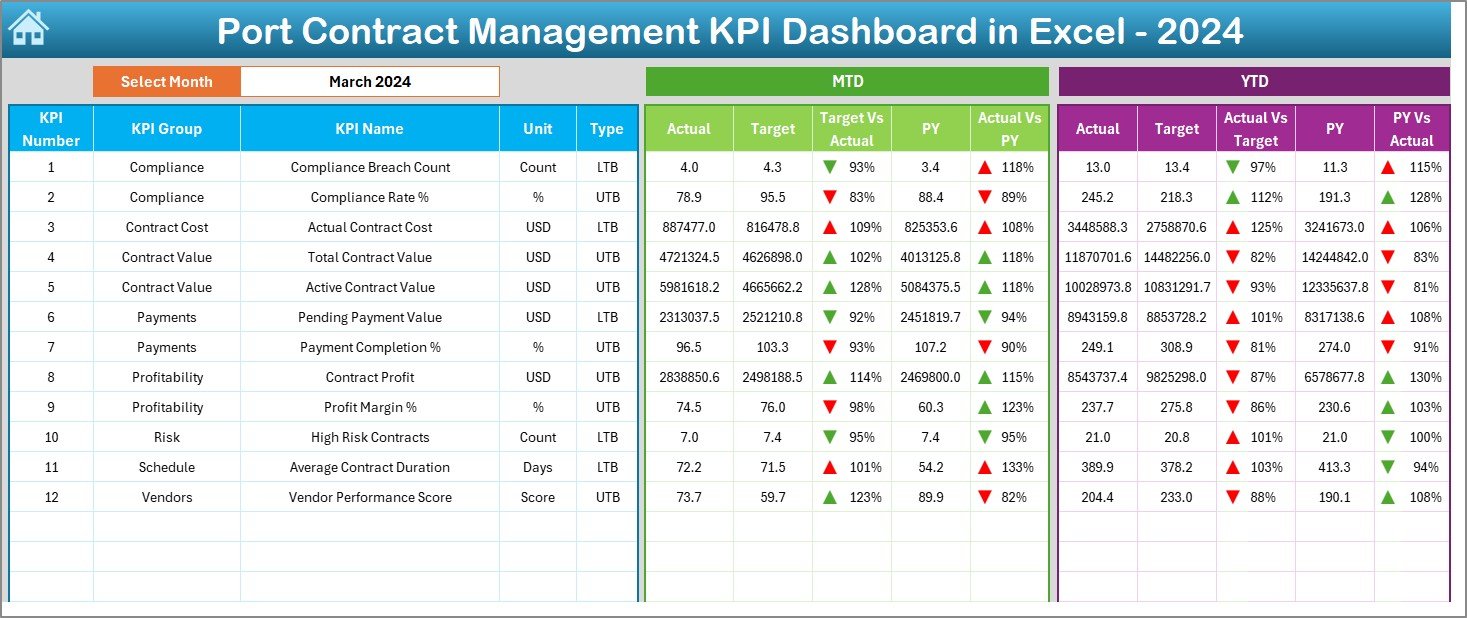
📊 MTD & YTD Performance Tracking – Monitor Month-to-Date and Year-to-Date results effortlessly
📈 Target vs Actual & PY Comparison – Identify performance gaps using automated variance analysis
🔼🔽 Visual Performance Indicators – Conditional formatting arrows instantly highlight risks and improvements
🧭 Easy Navigation – Dedicated Summary Page with navigation buttons for fast access
🧠 Clear KPI Definitions – Built-in KPI definition sheet ensures clarity and consistency
These features help port teams move from reactive reporting to proactive contract management.
📂 What’s Inside the Port Contract Management KPI Dashboard in Excel
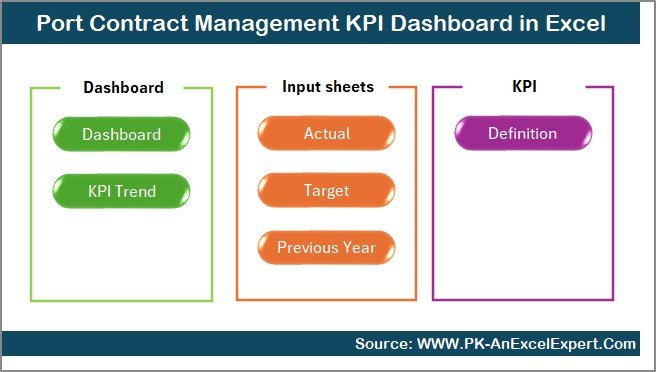
This dashboard includes 7 structured worksheets, each designed for a specific analytical purpose:
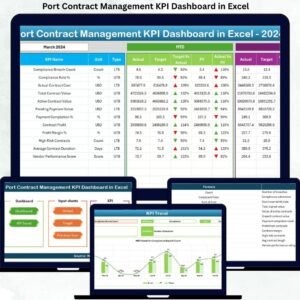
📌 Summary Page – Acts as an index with navigation buttons to jump instantly to any analysis
📌 Dashboard Sheet – Displays all KPIs with MTD, YTD, Target, and Previous Year comparisons
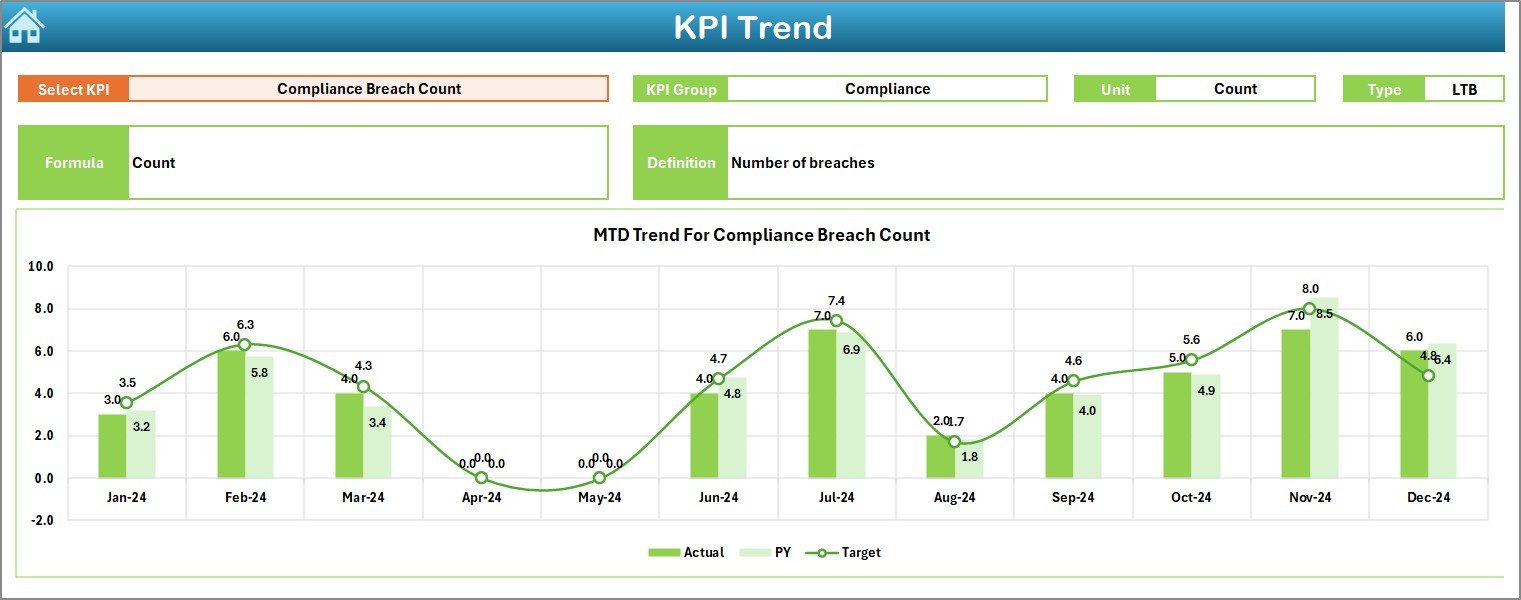
📌 Trend Sheet – Enables KPI-wise trend analysis for both MTD and YTD performance
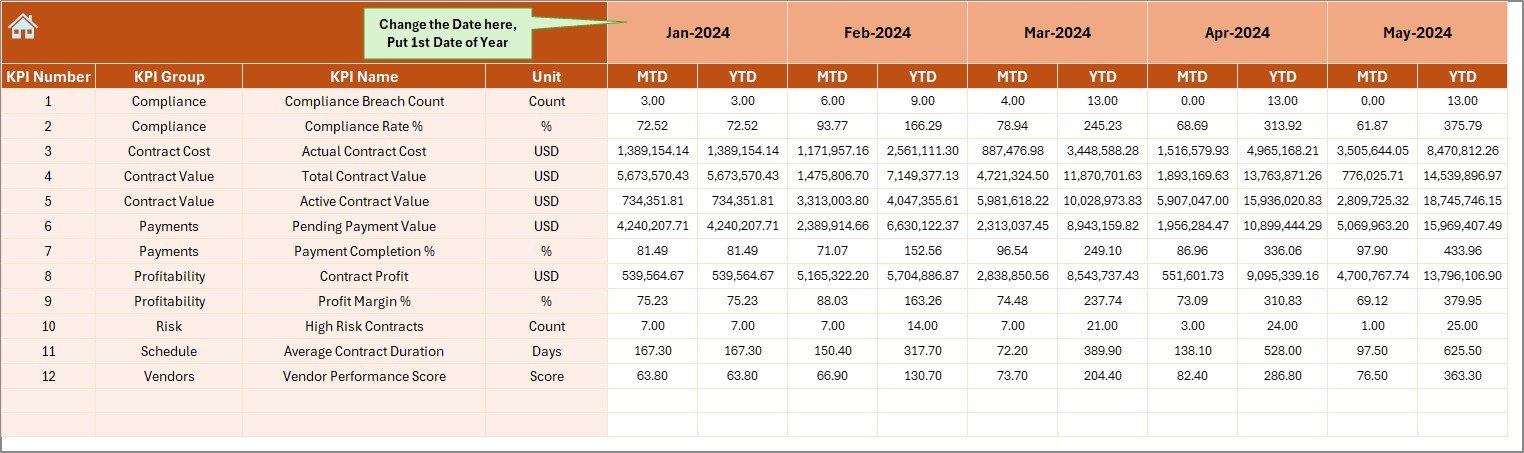
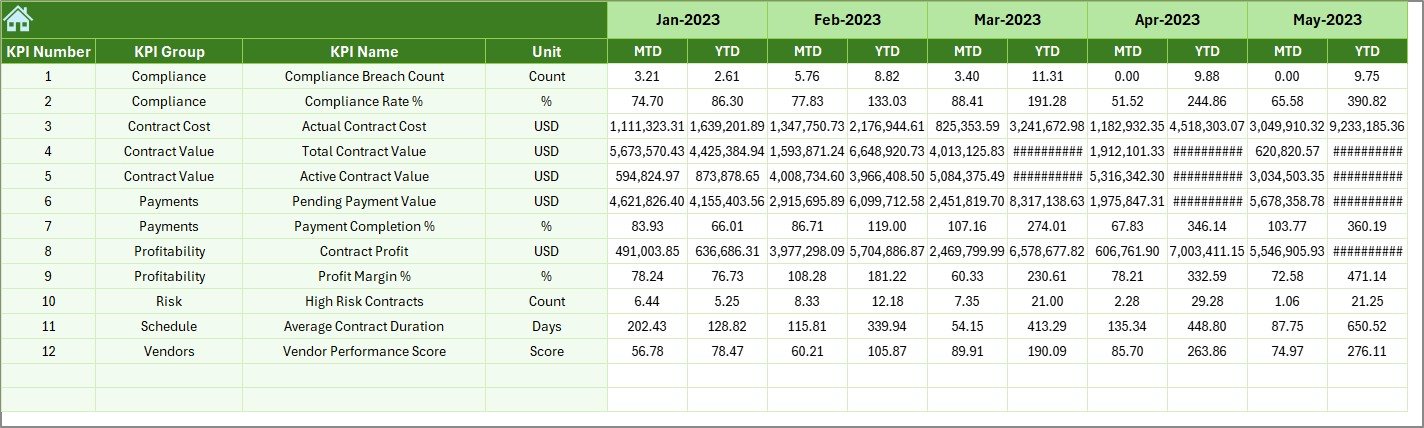
📌 Actual Numbers Input Sheet – Centralized place to enter actual performance values
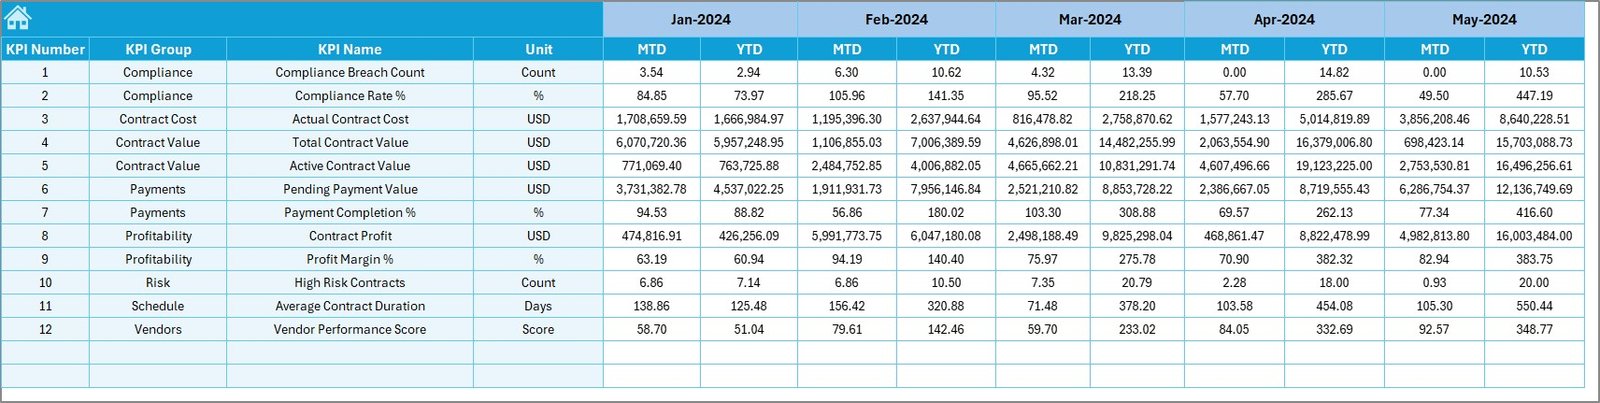
📌 Target Sheet – Define monthly and yearly KPI targets
📌 Previous Year Sheet – Store historical data for year-over-year analysis
📌 KPI Definition Sheet – Maintain KPI names, groups, units, formulas, and definitions
Together, these sheets form a complete contract KPI monitoring ecosystem.
🛠️ How to Use the Port Contract Management KPI Dashboard in Excel
Using the dashboard is simple and structured:
1️⃣ Enter monthly actual KPI values in the Actual Numbers sheet
2️⃣ Define targets in the Target Sheet
3️⃣ Add previous year data once for historical comparison
4️⃣ Select the month using the drop-down (Cell D3)
5️⃣ Instantly review MTD, YTD, Target vs Actual, and PY vs Actual results
All charts, KPIs, and indicators update automatically, eliminating manual calculations and reporting delays.
👥 Who Can Benefit from This Port Contract Management KPI Dashboard in Excel
This dashboard is ideal for:
⚓ Port Authorities & Administrators – Gain full visibility into contract performance
📑 Contract Managers – Monitor compliance, renewals, and penalties proactively
💰 Finance & Accounting Teams – Track cost variance, utilization, and financial exposure
🛒 Procurement Teams – Evaluate vendor performance and SLA adherence
🛡️ Compliance Officers – Identify risks before escalation
📊 Senior Management – Make faster, data-driven decisions with confidence
Because everyone works from the same KPI framework, alignment and accountability improve across departments.
Click here to read the Detailed Blog Post
Watch the step-by-step video tutorial:
Compatibility and Requirements
- Works in Microsoft Excel desktop (Excel 2016 or later, or Microsoft 365).
- The reporting month is picked from a drop-down list in cell D3. Microsoft’s guide to creating a drop-down list explains how it works.
Frequently Asked Questions
How many sheets are in the Port Contract Management KPI Dashboard?
Seven: Summary Page, Dashboard, Trend, Actual Numbers Input, Target, Previous Year and KPI Definition. The Summary Page has buttons that jump to each one.
How do I change the reporting month?
Select the month in the drop-down in cell D3. The MTD, YTD, target vs actual and previous year vs actual results update for that month.
Where do I enter the KPI numbers?
Monthly actuals go in the Actual Numbers sheet, targets in the Target Sheet, and last year’s figures in the Previous Year Sheet. You add the previous year data once.
Can I add my own contract KPIs?
Yes. Add the KPI name, group, unit, formula and definition on the KPI Definition sheet, then enter its actuals and targets.
Related Port and Contract Templates
- Port Contract Management KPI Dashboard in Power BI: the same KPIs in Power BI.
- Port Contract Management Dashboard in Excel: a contract data dashboard for ports.
- Port Contract Management Dashboard in Power BI: the contract dashboard in Power BI.
- Contract Management Dashboard in Excel: contract tracking for any industry.
- KPI Dashboard Library (Excel): 15 Excel KPI dashboards in one pack.
Browse all Excel KPI dashboards or the Excel logistics templates.





Reviews
There are no reviews yet.