Educational nonprofits work toward impact, not profit. However, without structured performance tracking, even the strongest missions struggle to scale. That is exactly why the Educational Nonprofits KPI Dashboard in Excel becomes a powerful decision-making tool for modern nonprofit organizations.
This ready-to-use Excel dashboard transforms scattered program, financial, and outcome data into a clear, visual, and action-oriented performance system. Instead of juggling multiple spreadsheets, nonprofit leaders can instantly track targets, actuals, trends, and year-over-year performance — all from one professional Excel file.
Whether you manage student programs, donor funds, or operational efficiency, this dashboard helps you measure what matters, improve accountability, and maximize educational impact.
🚀 Key Features of Educational Nonprofits KPI Dashboard in Excel
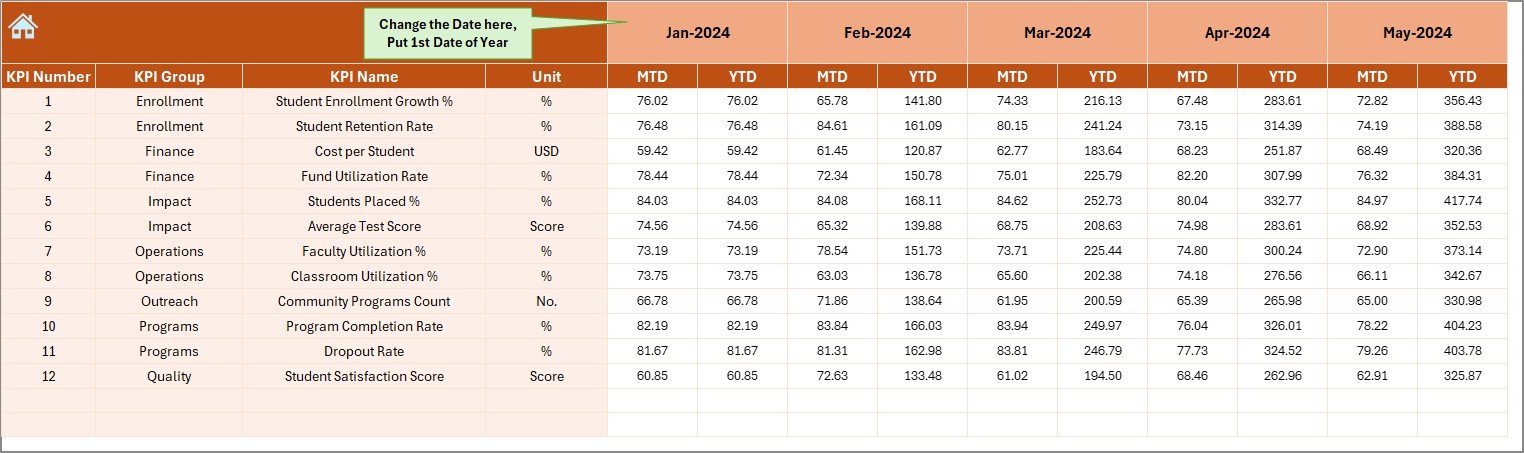
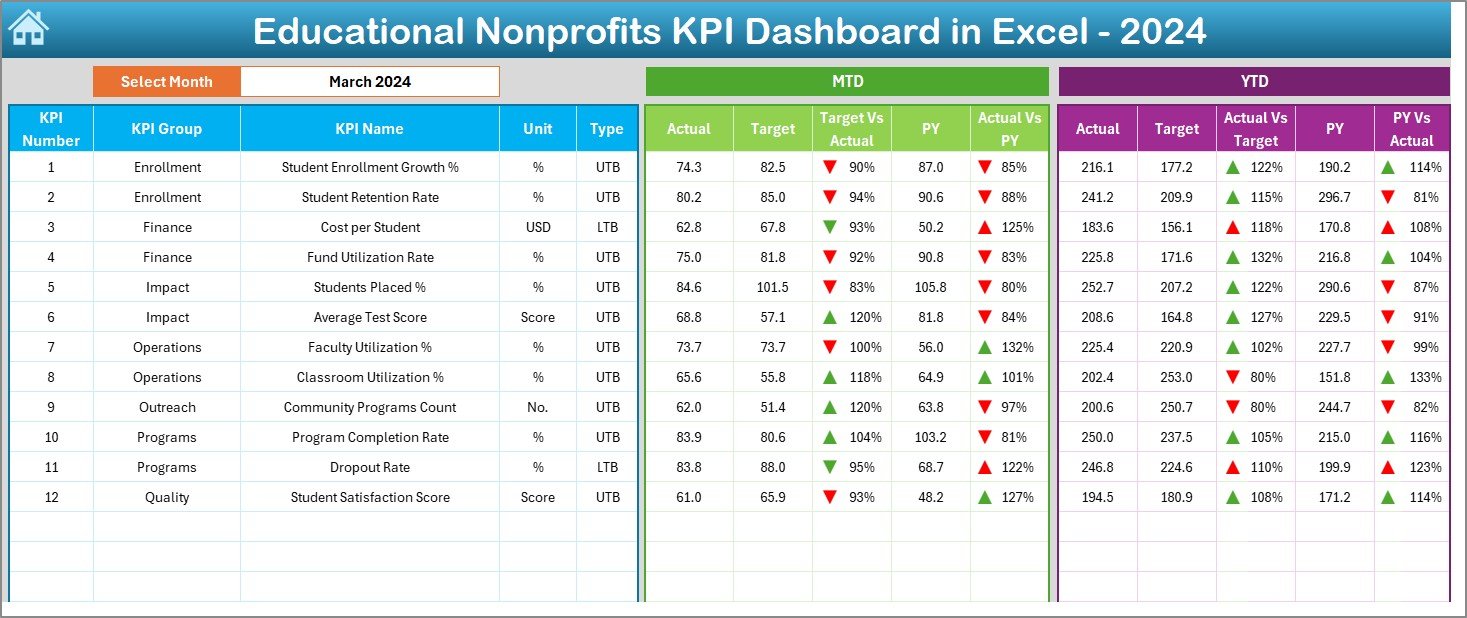
📌 Dynamic Month Selection – Change the month from a simple drop-down and instantly update the entire dashboard
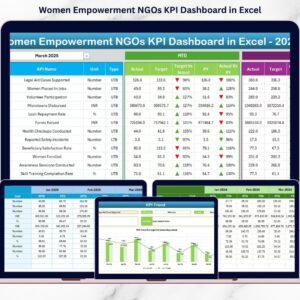
📊 MTD & YTD KPI Tracking – Monitor Month-to-Date and Year-to-Date performance in one view
🎯 Target vs Actual Analysis – Clearly compare actual performance against planned targets
📉 Previous Year Comparison – Measure year-over-year progress and growth
⬆️⬇️ Conditional Formatting Arrows – Instantly identify improvement or decline using visual indicators
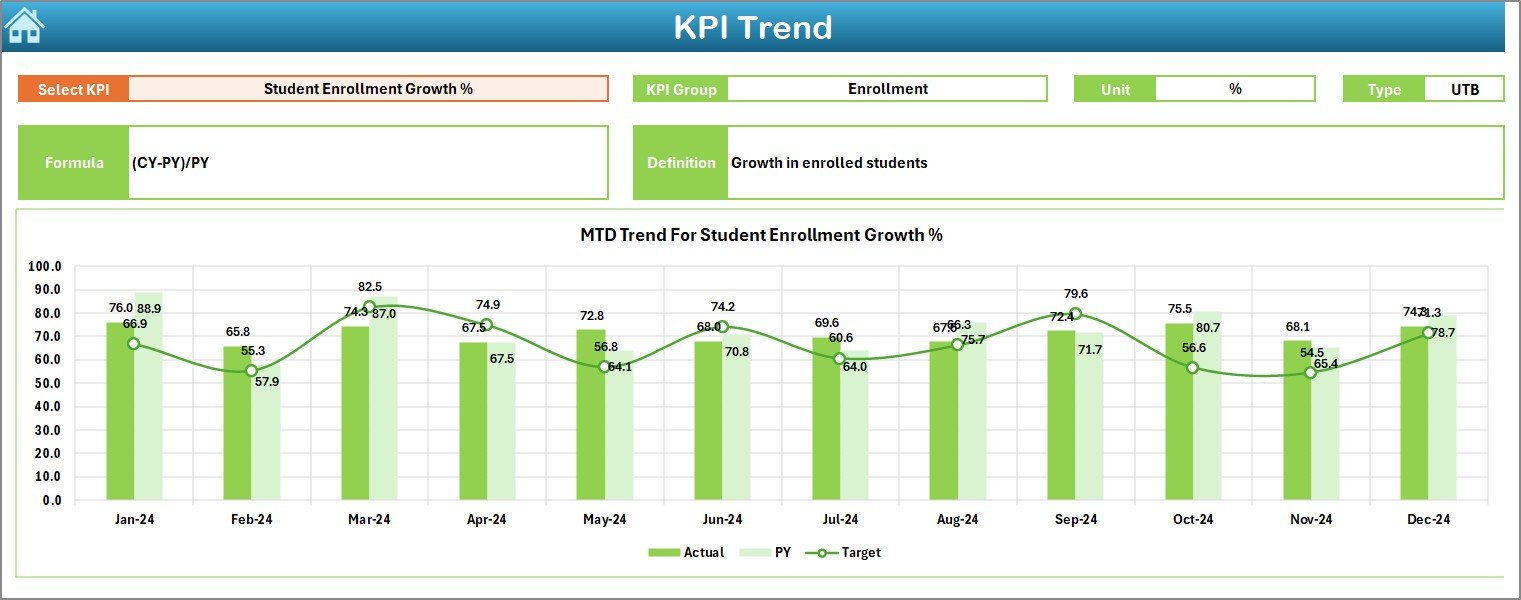
📈 Trend Analysis by KPI – Analyze historical KPI movement using interactive trend charts
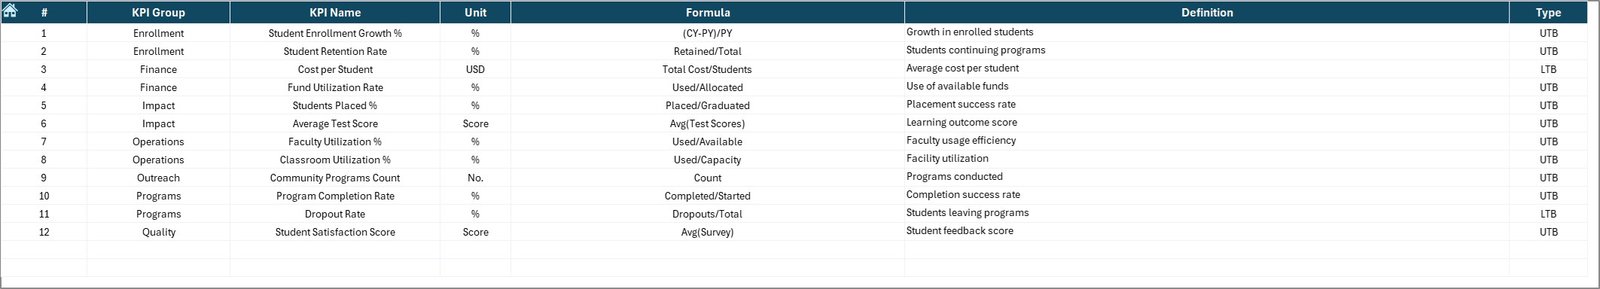
📚 KPI Definition Sheet – Maintain consistency with clear KPI formulas, units, and definitions
🧩 Excel-Based & Flexible – No complex tools or software required
⏱️ Time-Saving Reporting – Eliminate manual reports and repetitive calculations
📂 What’s Inside the Educational Nonprofits KPI Dashboard in Excel
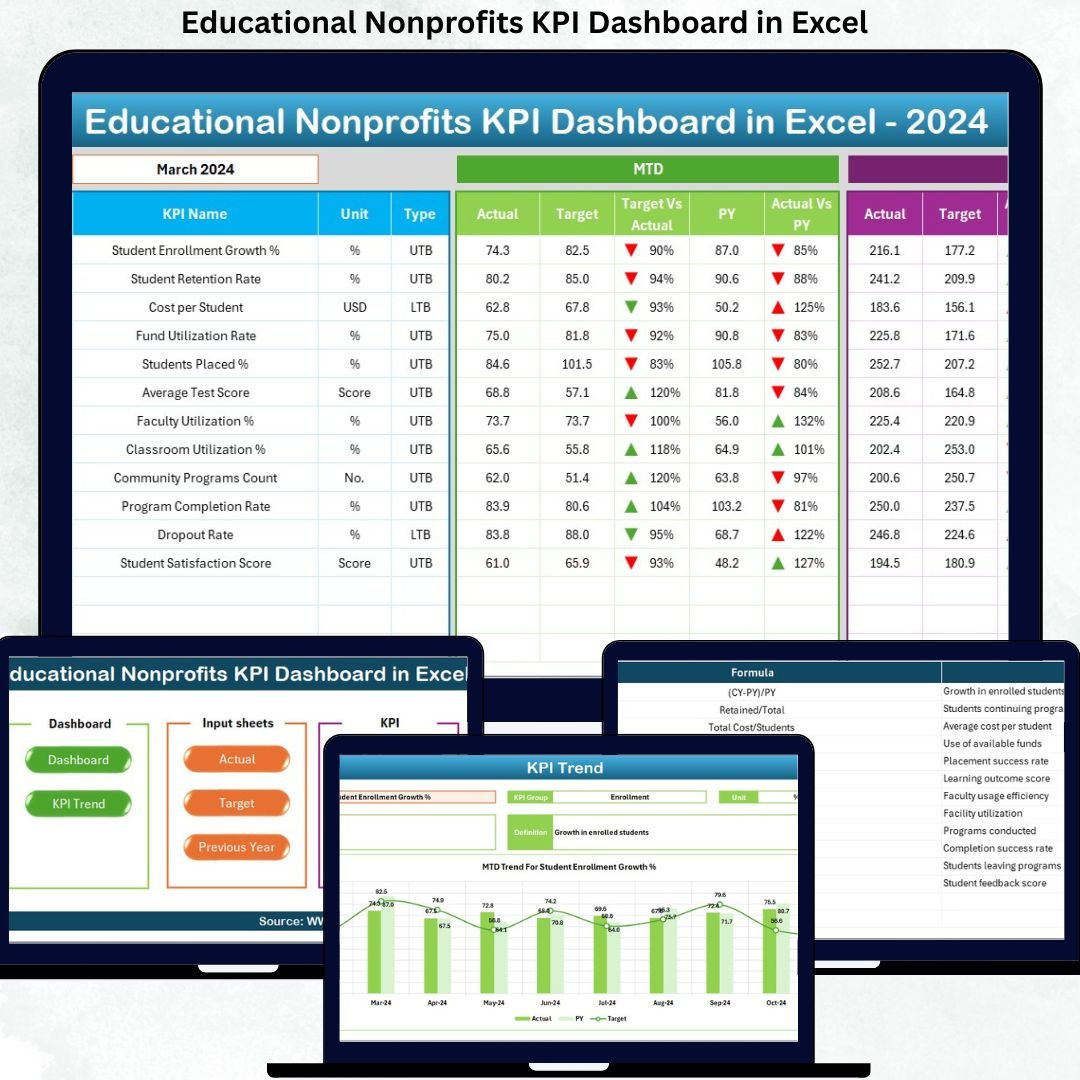
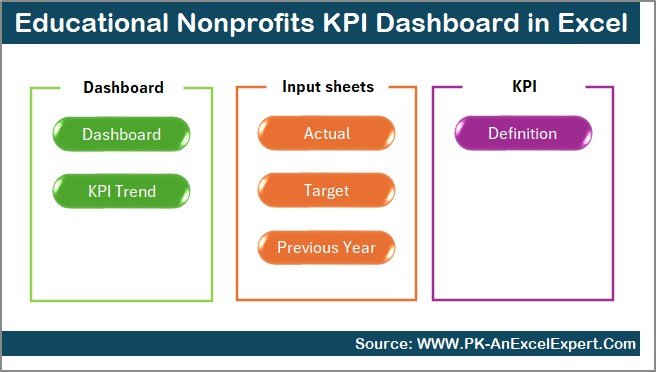
This dashboard includes 7 professionally designed worksheets, each serving a specific purpose:
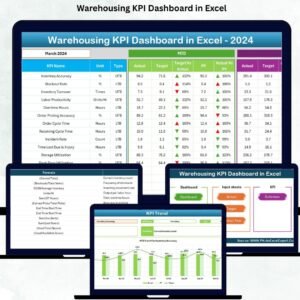
🗂️ Summary Page – Acts as a navigation hub with buttons to jump to key sheets
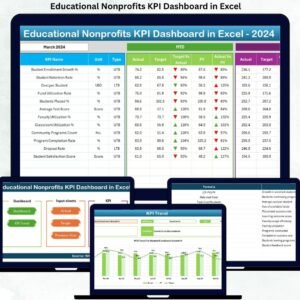
📊 Dashboard Sheet – Displays all KPIs with MTD & YTD Actual, Target, Previous Year, and variance analysis
📈 Trend Sheet – Shows KPI trends over time with KPI group, unit, formula, and definition
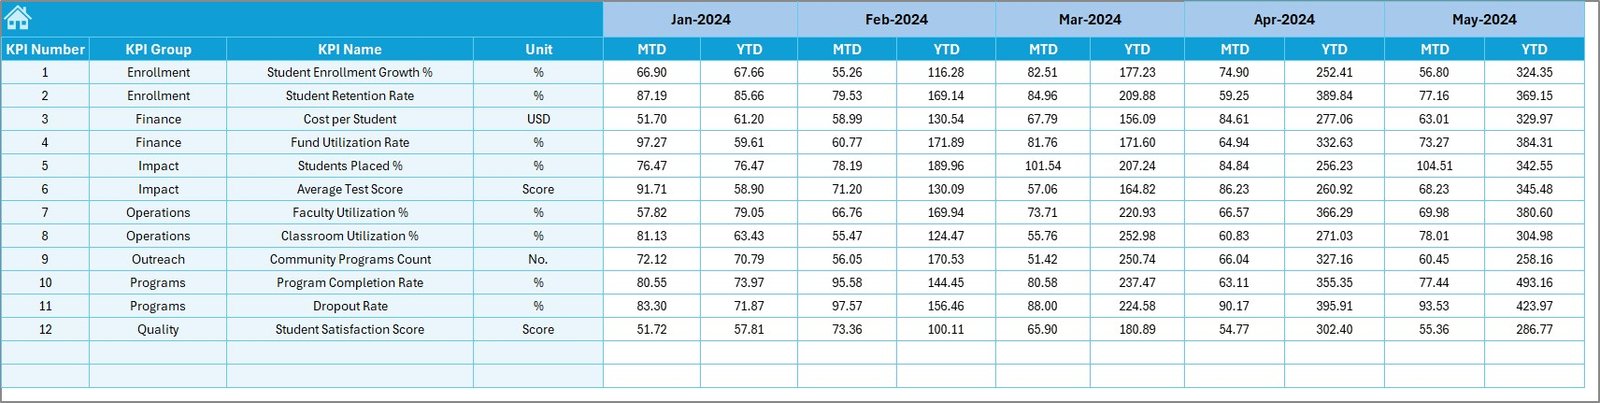
✍️ Actual Numbers Input Sheet – Simple data entry for monthly actual values
🎯 Target Sheet – Define monthly and yearly performance expectations
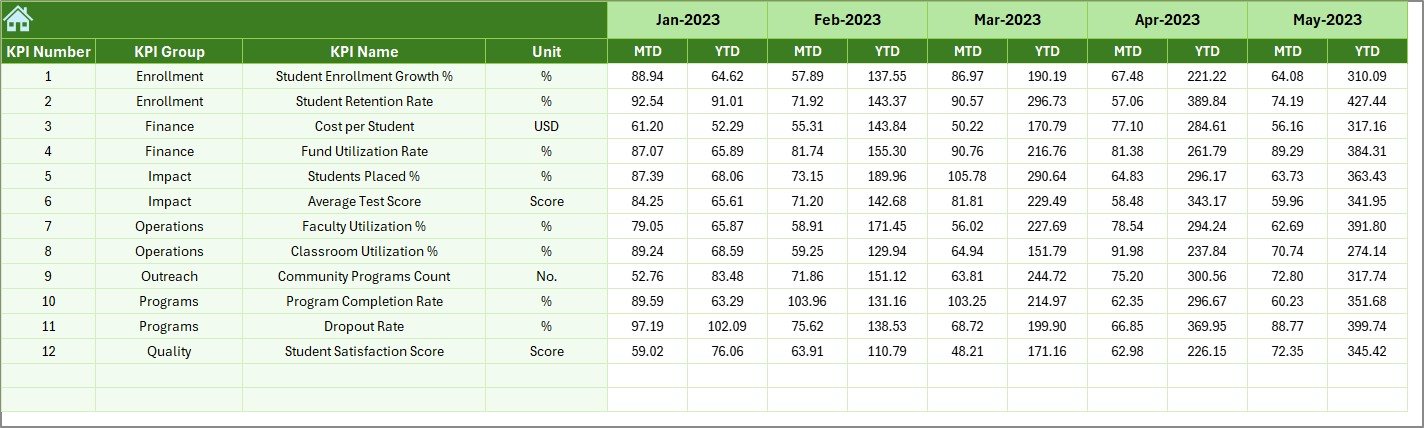
📅 Previous Year Numbers Sheet – Store historical data for year-over-year comparison
📘 KPI Definition Sheet – Standardize KPI understanding across teams
Together, these sheets form a complete performance management system for educational nonprofits.
🧠 How to Use the Educational Nonprofits KPI Dashboard in Excel
Using this dashboard is simple and intuitive:
1️⃣ Enter actual performance values in the Actual Numbers Input Sheet
2️⃣ Define targets in the Target Sheet
3️⃣ Add last year’s data in the Previous Year Numbers Sheet
4️⃣ Select the month from the drop-down on the Dashboard Sheet
5️⃣ Review MTD & YTD performance with visual indicators
6️⃣ Use the Trend Sheet to analyze KPI movement over time
Because everything runs on Excel formulas, insights update automatically — saving time and reducing errors.
🎓 Who Can Benefit from This Educational Nonprofits KPI Dashboard in Excel
🏫 Educational nonprofit organizations
📋 Program managers and coordinators
💰 Finance and grant management teams
📊 Monitoring & evaluation teams
🤝 Donor reporting and compliance teams
👔 Board members and leadership teams
Whether you are a small NGO or a large educational foundation, this dashboard adapts easily to your reporting needs.
Click here to read the Detailed blog post
Watch the step-by-step video tutorial:


Reviews
There are no reviews yet.