
Building a powerful brand is no longer about intuition, creativity, or guesswork alone. Today, winning brands are built on data-driven decisions, measurable perception, and continuous performance tracking. That is exactly where the Brand Management KPI Dashboard in Power BI becomes a game-changer for modern organizations.
This ready-to-use dashboard helps you track, analyze, and visualize brand performance KPIs in one centralized, interactive Power BI solution. Instead of juggling multiple Excel files, static reports, and presentations, this dashboard gives you real-time clarity on brand health, helping leaders act faster and smarter.
Designed with simplicity, flexibility, and business impact in mind, this dashboard connects seamlessly with Excel and converts raw brand data into clear KPIs, trend charts, status icons, and actionable insights—all in just a few clicks.
🔑 Key Features of Brand Management KPI Dashboard in Power BI
📊 Centralized Brand Performance Tracking
Track all brand KPIs in one unified Power BI dashboard without manual consolidation.
📅 MTD & YTD Performance Monitoring
Analyze Month-to-Date and Year-to-Date performance instantly for better control.
🎯 Target vs Actual Comparison
Identify gaps between actual performance and targets using visual indicators.
📈 Current Year vs Previous Year Analysis
Understand brand growth trends with CY vs PY comparisons.
🎛️ Interactive Slicers & Filters
Slice data by Month and KPI Group for focused analysis.
🧭 Visual Status Icons
Quickly spot target met or missed KPIs using color-coded up/down icons.
📂 Excel-Based Data Input
Update Actuals, Targets, and KPI definitions easily using Excel sheets.
🔍 Drill-Through KPI Definitions
Ensure KPI clarity and consistency across teams with detailed definitions.
📦 What’s Inside the Brand Management KPI Dashboard in Power BI
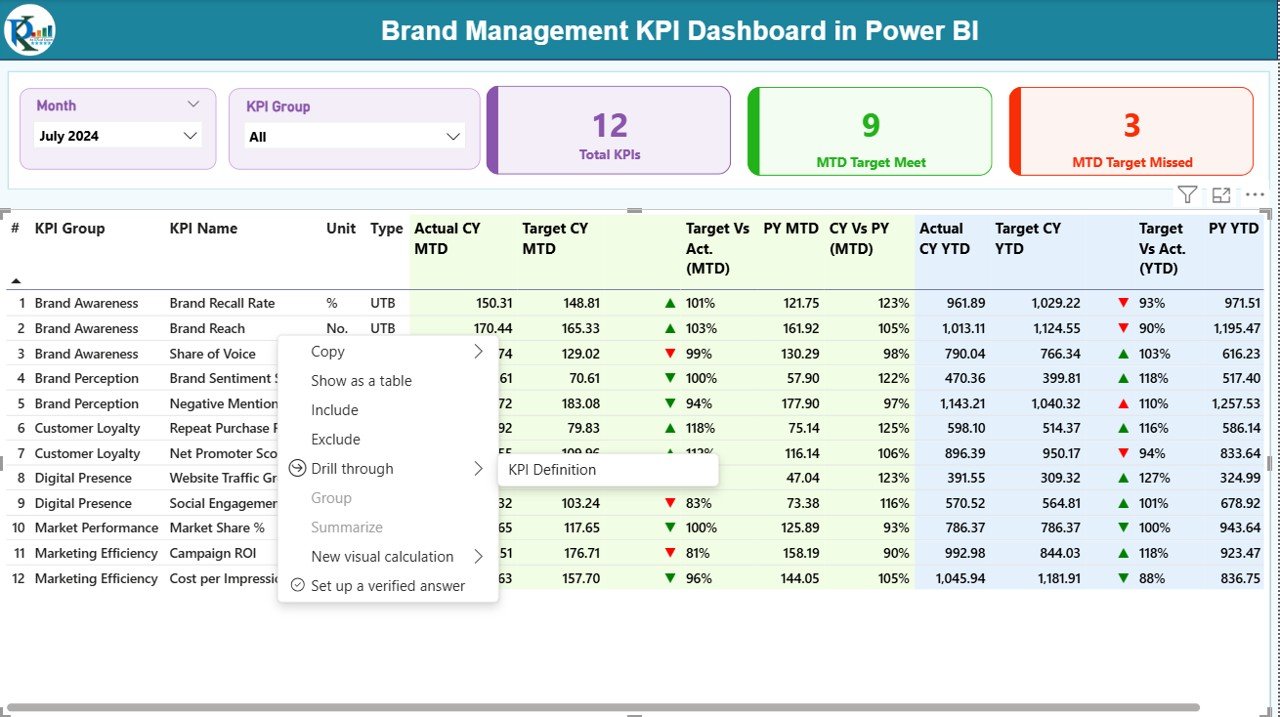
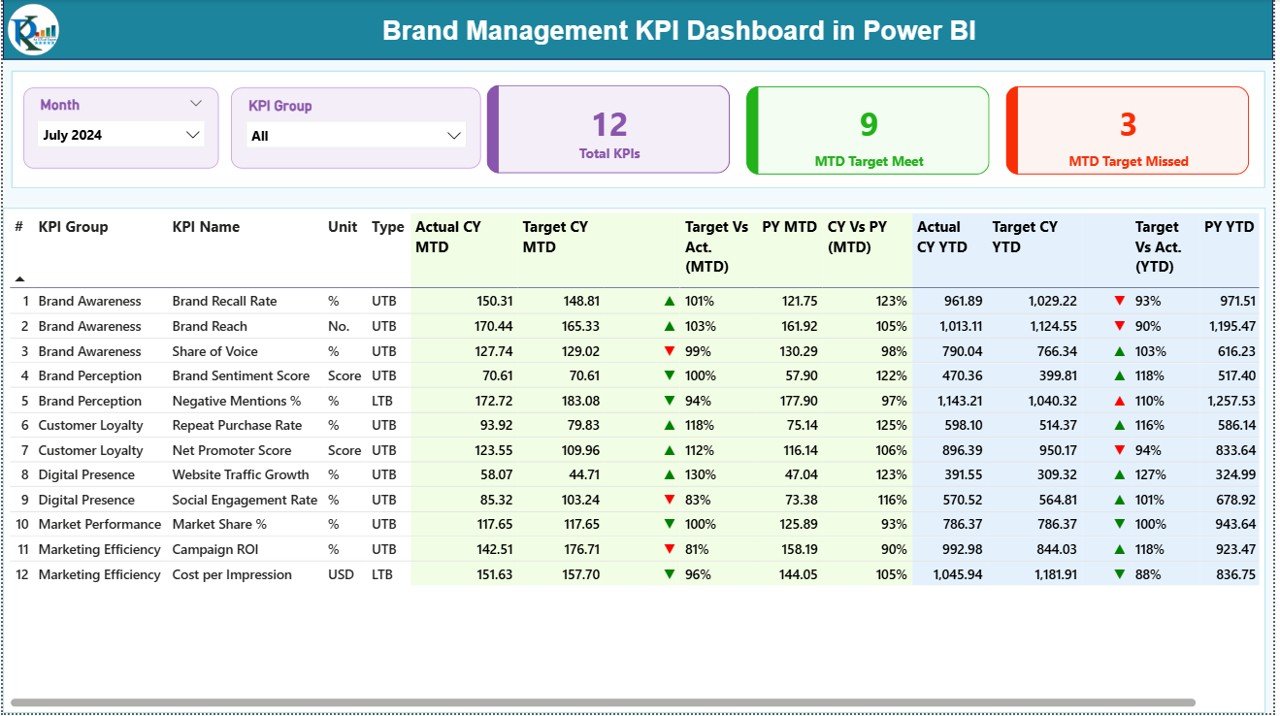
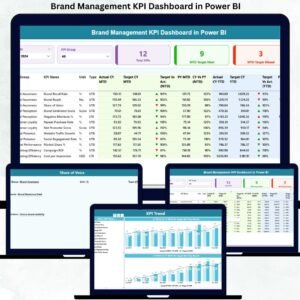
🟢 Summary Page
This is the main dashboard view showing:
-
Month & KPI Group slicers
-
KPI cards for Total KPIs, MTD Target Met, and MTD Target Missed
-
A detailed KPI table with MTD & YTD Actuals, Targets, PY values, variance %, and status icons
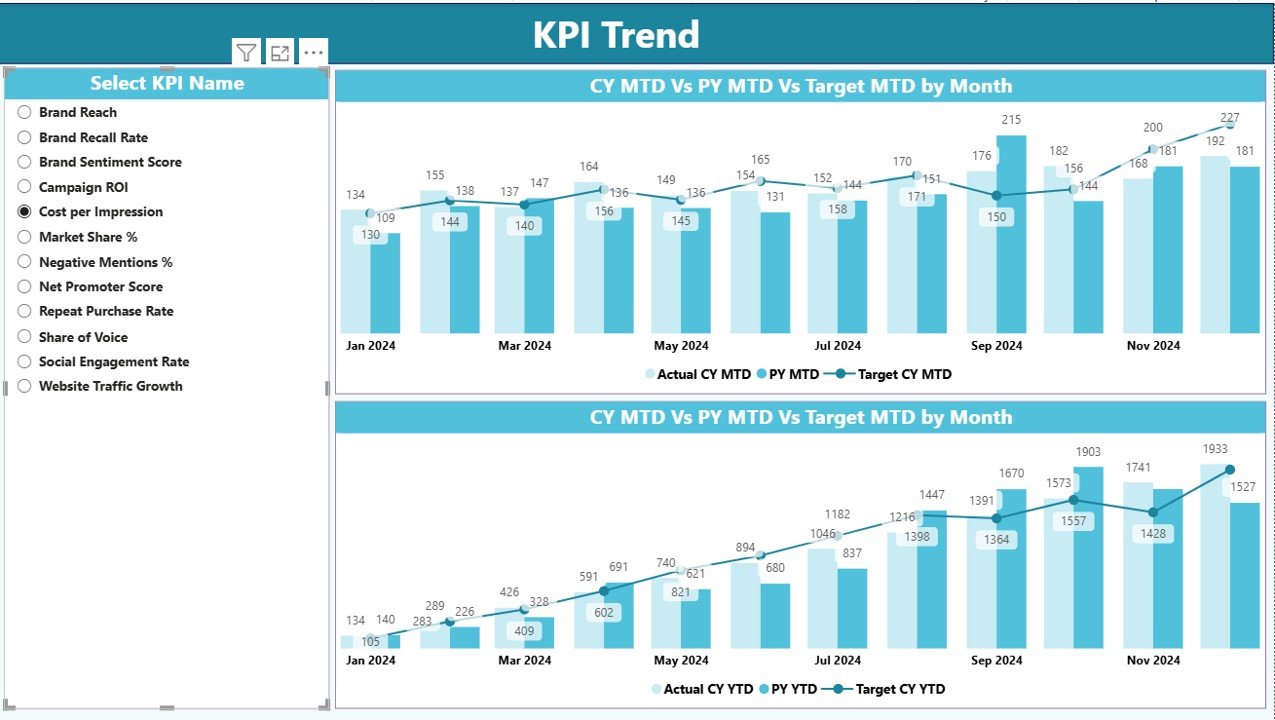
🟡 KPI Trend Page
-
KPI selection slicer
-
Combo charts showing Actual CY, Actual PY, and Target trends
-
Clear visibility into monthly momentum and seasonality
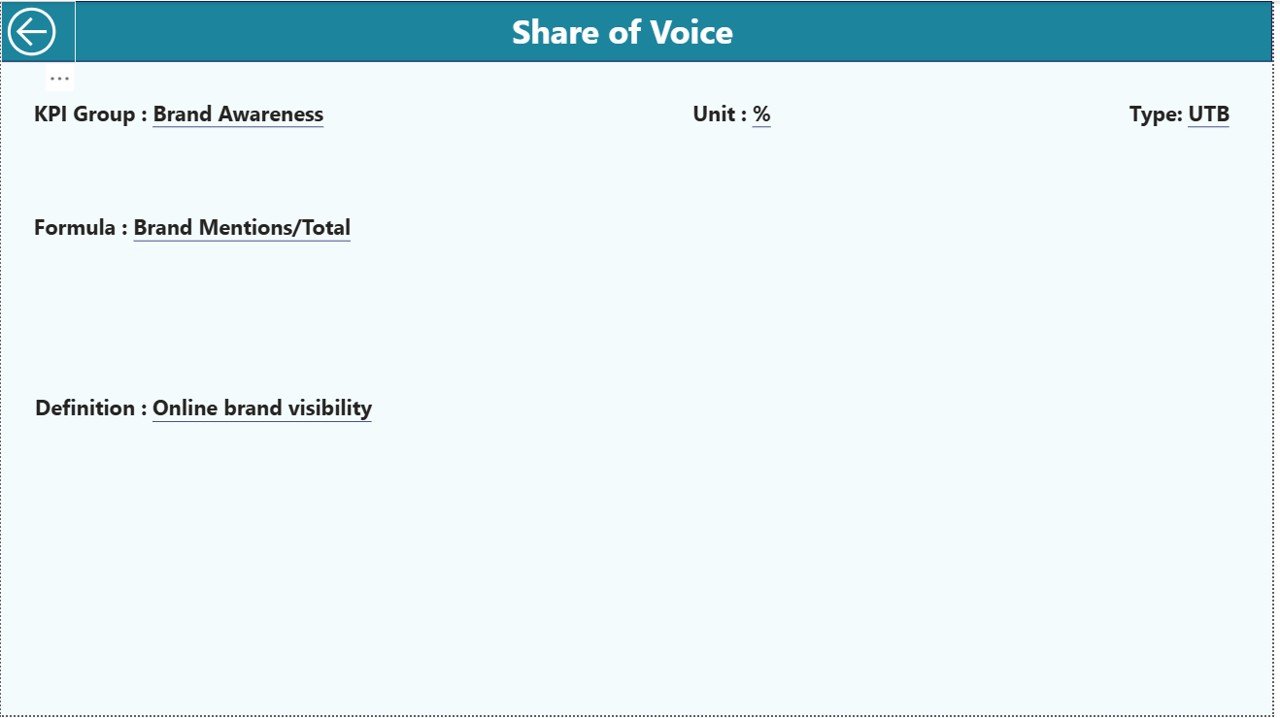
🔵 KPI Definition Page (Drill-Through)
-
KPI Formula
-
KPI Definition
-
Unit and Type (UTB / LTB)
-
Back navigation for smooth user experience
📊 Excel Data Model (Included)
-
Input_Actual Sheet – Actual MTD & YTD values
-
Input_Target Sheet – Target MTD & YTD values
-
KPI Definition Sheet – KPI metadata and governance
🚀 How to Use the Brand Management KPI Dashboard in Power BI
1️⃣ Enter Actual performance data in the Input_Actual Excel sheet
2️⃣ Enter Target values in the Input_Target Excel sheet
3️⃣ Define or update KPIs in the KPI Definition sheet
4️⃣ Open the Power BI file and refresh the dataset
5️⃣ Use slicers, tables, and charts to analyze brand performance
6️⃣ Drill through KPIs to understand definitions and formulas
7️⃣ Take data-backed actions to improve brand strategy
No advanced Power BI skills are required—everything is structured for ease of use.
👥 Who Can Benefit from This Brand Management KPI Dashboard in Power BI
✅ Brand Managers
✅ Marketing Heads & CMOs
✅ Digital Marketing Teams
✅ Strategy & Growth Teams
✅ Business Leaders & Executives
✅ Market Research Analysts
✅ Agencies managing multiple brands
Whether you manage a single brand or a portfolio, this dashboard adapts effortlessly.


Reviews
There are no reviews yet.