
Running a successful subscription box business is not just about creative products and marketing campaigns. Subscription Box Services KPI Dashboard in Power BI Growth truly depends on how well you track subscribers, revenue, churn, targets, and trends—month after month and year after year. However, many subscription businesses still rely on scattered Excel sheets, manual reports, and delayed analysis.
Subscription Box Services KPI Dashboard in Power BI That is exactly why the Subscription Box Services KPI Dashboard in Power BI becomes a game-changing analytics solution for modern subscription brands.
Subscription Box Services KPI Dashboard in Power BI This ready-to-use Power BI dashboard converts raw subscription data into clear KPIs, trend insights, and target comparisons, helping founders and managers make faster, smarter, and data-driven decisions.
🚀 Why This Dashboard Matters
Subscription businesses operate on recurring revenue models, where even small changes in churn, growth rate, or target achievement can significantly impact profitability. Therefore, real-time visibility into KPIs becomes essential.
With this dashboard, you no longer waste time compiling reports. Instead, you gain instant clarity on what is working and what needs attention.
## ✨ Key Features of Subscription Box Services KPI Dashboard in Power BI
📊 Centralized KPI Monitoring – Track all subscription KPIs in one interactive Power BI dashboard
📅 MTD & YTD Performance Tracking – Analyze short-term execution and long-term growth together
🎯 Target vs Actual Comparison – Instantly identify target gaps using visual indicators
📈 Trend Analysis – Compare Current Year vs Previous Year performance
🔍 Interactive Slicers – Filter by Month and KPI Group effortlessly
📌 KPI Drill-Through – View KPI formulas and definitions in a dedicated KPI Definition page
🔄 Excel-Driven Data Input – Simple Excel backend, powerful Power BI visuals
👥 Business-Friendly Design – Easy to use for both technical and non-technical users
## 📂 What’s Inside the Subscription Box Services KPI Dashboard?
You will receive a Power BI Desktop (.pbix) file with 3 professionally designed pages:
📌 1. Summary Page
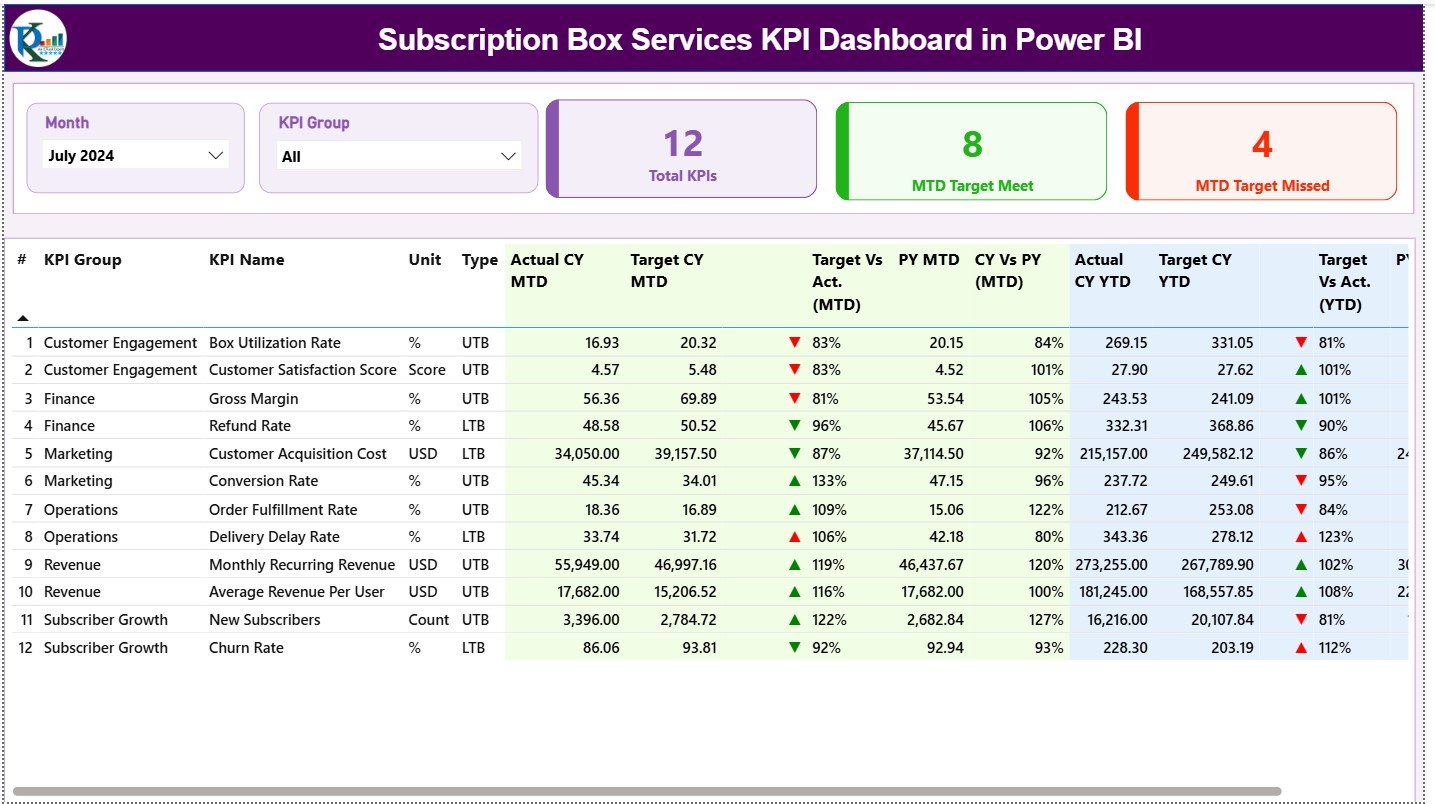
This is the main control panel of the dashboard, featuring:
-
Month & KPI Group slicers
-
KPI cards:
-
Total KPIs Count
-
MTD Target Met Count
-
MTD Target Missed Count
-
-
A detailed KPI table showing:
-
Actual vs Target (MTD & YTD)
-
CY vs PY comparison
-
Visual ▲ / ▼ performance indicators
-
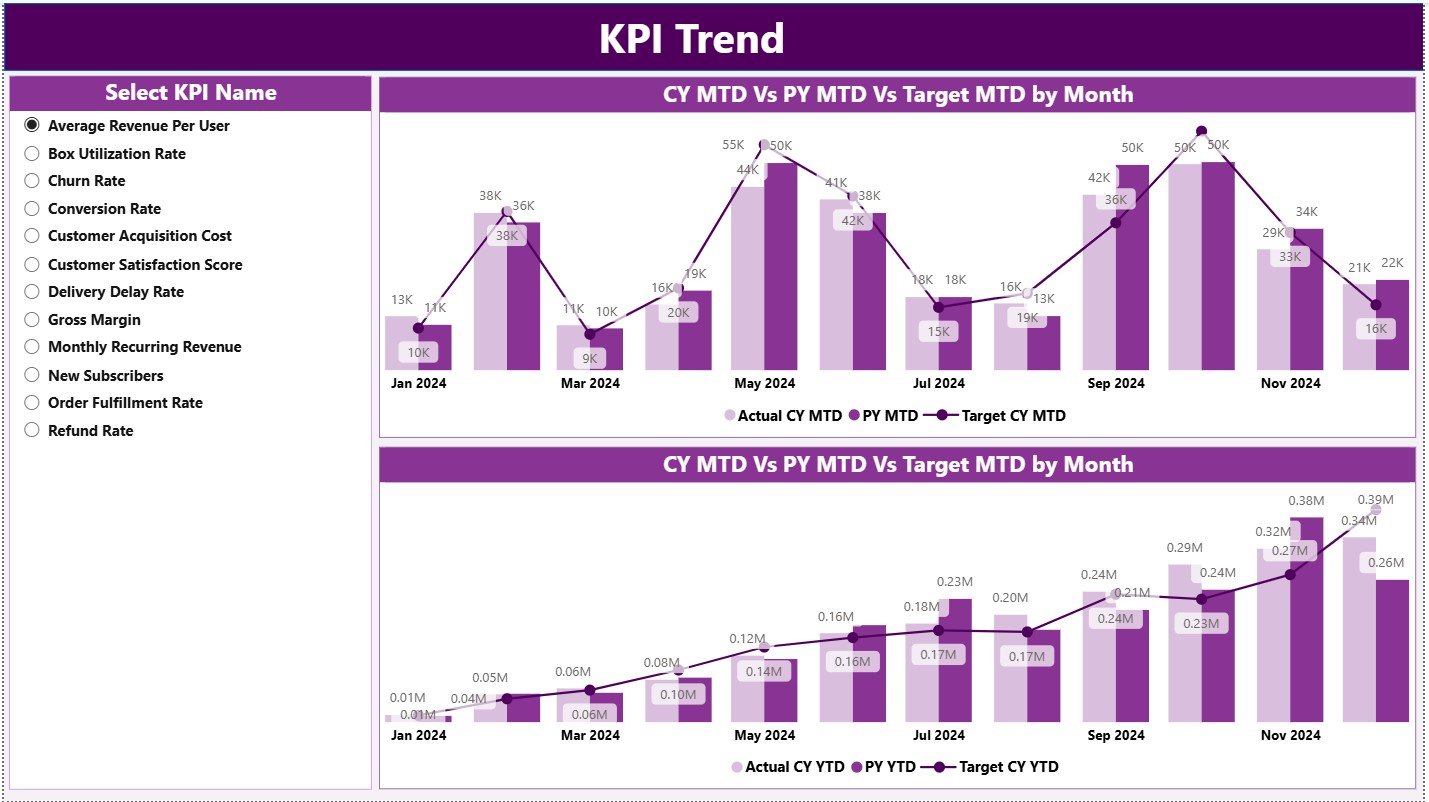
📌 2. KPI Trend Page
This page helps you understand performance movement over time, including:
-
MTD Trend Combo Chart (Actual CY, PY, Target)
-
YTD Trend Combo Chart (Actual CY, PY, Target)
-
KPI Name slicer for focused analysis
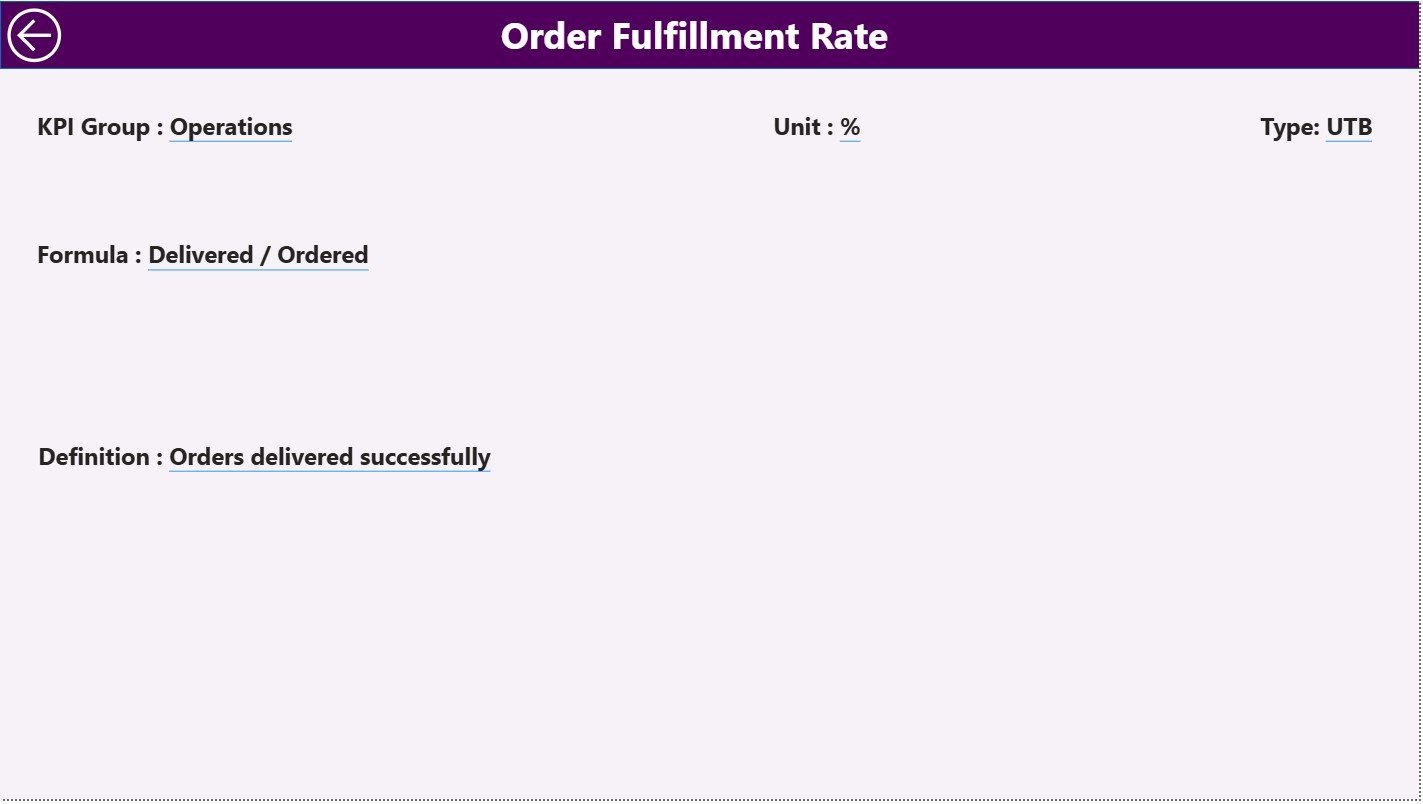
📌 3. KPI Definition Page (Drill-Through)
This hidden page ensures KPI transparency and governance, showing:
-
KPI Formula
-
KPI Definition
-
KPI Type (UTB / LTB)
## 🧭 How to Use the Subscription Box Services KPI Dashboard
Using this dashboard is simple and structured:
1️⃣ Enter Actual KPI values in the Excel Input Actual sheet
2️⃣ Enter Target KPI values in the Excel Input Target sheet
3️⃣ Maintain KPI logic in the KPI Definition sheet
4️⃣ Refresh the Power BI file
5️⃣ Use slicers to analyze MTD, YTD, and trends instantly
No advanced Power BI skills required.
## 👥 Who Can Benefit from This Dashboard?
This dashboard is ideal for:
-
📦 Subscription Box Founders
-
📊 Business & Growth Analysts
-
💰 Finance & Revenue Teams
-
🔄 Retention & Operations Managers
-
🚀 Startups and Scaling Subscription Brands
-
📈 Strategy & Planning Teams
Whether you manage beauty boxes, food subscriptions, lifestyle kits, or digital subscriptions, this dashboard adapts perfectly.


Reviews
There are no reviews yet.