


In today’s hyper-competitive digital landscape, Personalization Strategy KPI Dashboard is no longer a luxury—it is a necessity. Customers expect relevant content, tailored offers, and meaningful experiences across every touchpoint. However, personalization initiatives often fail when organizations cannot measure performance clearly. When KPIs remain scattered across spreadsheets or reports, teams lose visibility, accountability, and direction. That is exactly where the Personalization Strategy KPI Dashboard in Power BI becomes a game-changing solution.
The Personalization Strategy KPI Dashboard in Power BI is a ready-to-use, interactive analytics dashboard designed to track, monitor, and optimize personalization performance from a single centralized platform. Instead of guessing whether personalization campaigns are working, this dashboard converts raw KPI data into clear visuals, performance indicators, and actionable insights.
Built using Power BI for visualization and Excel as the data source, this dashboard offers the perfect balance of power and simplicity. Business users can update KPI data easily in Excel, while Power BI automatically refreshes dashboards with dynamic charts, tables, and indicators. As a result, both technical and non-technical users can confidently analyze personalization outcomes without complexity.
This dashboard helps organizations understand which personalization KPIs are meeting targets, which are lagging, and how performance compares month-to-month and year-to-year. Therefore, personalization strategies become measurable, scalable, and continuously improvable.
⭐ Key Features of Personalization Strategy KPI Dashboard in Power BI
📊 Centralized KPI Monitoring – Track all personalization KPIs in one dashboard
📅 MTD & YTD Performance Tracking – Monitor short-term and long-term results
🎯 Target vs Actual Comparison – Instantly identify gaps
🔁 Previous Year Comparison – Measure growth and decline
🚦 Visual Status Indicators – Green ▲ and Red ▼ performance icons
📈 Interactive Trend Analysis – KPI-wise MTD & YTD trends
📁 Excel-Based Data Input – Easy updates without technical skills
🧩 Scalable KPI Framework – Add new KPIs anytime
📦 What’s Inside the Personalization Strategy KPI Dashboard
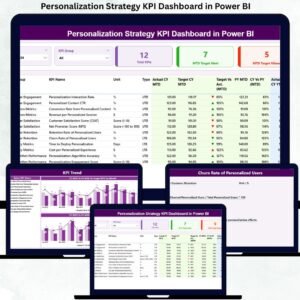
📌 Summary Page

The Summary Page acts as the command center of the dashboard.
It includes:
-
Month slicer and KPI Group slicer
-
KPI cards, showing:
-
Total KPIs Count
-
MTD Target Meet Count
-
MTD Target Missed Count
-
-
Detailed KPI table, covering:
-
KPI Number, Group, Name, Unit, Type (LTB / UTB)
-
Actual vs Target (MTD & YTD)
-
Previous Year comparisons
-
Visual arrows for quick performance checks
-
This page allows decision-makers to assess overall personalization health instantly.
📈 KPI Trend Page
The KPI Trend Page focuses on performance over time.
It includes:
-
Two combo charts:
-
MTD Trend (Actual CY, Actual PY, Target)
-
YTD Trend (Actual CY, Actual PY, Target)
-
-
KPI Name slicer to analyze individual KPIs
This page helps teams:
-
Detect early performance drops
-
Understand seasonality
-
Track improvement patterns
📘 KPI Definition Page
This page acts as a drill-through reference guide.
It explains:
-
KPI Formula
-
KPI Definition
-
Unit of Measurement
-
KPI Type (LTB / UTB)
Because this page clarifies KPI logic, it ensures alignment, transparency, and consistent interpretation across teams.
🛠️ How to Use the Personalization Strategy KPI Dashboard
1️⃣ Enter Actual KPI data in Input_Actual Excel sheet
2️⃣ Enter Target values in Input_Target Excel sheet
3️⃣ Maintain KPI definitions in KPI Definition sheet
4️⃣ Refresh Power BI dataset
5️⃣ Use slicers to analyze insights
6️⃣ Take data-driven personalization actions
👥 Who Can Benefit from This Dashboard
-
Marketing Teams
-
Digital Experience Teams
-
CRM & Customer Analytics Teams
-
Product Managers
-
Growth & Performance Teams
-
Senior Leadership
Any organization running personalized campaigns, recommendations, or experiences will benefit from this dashboard.
### 📘 Click here to read the Detailed blog post
📺 Visit our YouTube channel to learn step-by-step video tutorials
👉 https://youtube.com/@PKAnExcelExpert


Reviews
There are no reviews yet.