


Claim settlement efficiency is one of the most critical performance indicators for insurance companies, TPAs, and claims processing teams. Customers expect fast, transparent, and accurate claim resolutions. However, when claim data is scattered across emails, multiple spreadsheets, and manual reports, delays increase, costs rise, and customer satisfaction declines.
The Claim Settlement KPI Dashboard in Google Sheets solves these challenges by providing a centralized, automated, and data-driven system to track claim performance across the entire settlement lifecycle. This ready-to-use dashboard helps organizations monitor claim turnaround time, settlement accuracy, backlog levels, SLA compliance, and year-over-year performance — all from a single Google Sheets file.
✨ Key Features of the Claim Settlement KPI Dashboard
📊 Centralized Claim Performance Monitoring
Track all critical claim settlement KPIs in one dashboard, eliminating dependency on manual reports and disconnected data sources.
📅 MTD & YTD Performance Tracking
Monitor Month-to-Date and Year-to-Date claim performance to evaluate short-term efficiency and long-term improvement.
🎯 Target vs Actual & YOY Comparison
Compare actual claim performance against defined targets and previous-year values to identify gaps early.
📈 KPI Trend Analysis
Understand month-wise claim behavior and identify delays, backlog buildup, or process improvements using trend analysis.
🔄 Automated Calculations & Visual Indicators
Conditional formatting arrows instantly highlight favorable and unfavorable movements, saving analysis time.
🤝 Real-Time Collaboration
Multiple team members can update and review the dashboard simultaneously using Google Sheets.
📦 What’s Inside the Claim Settlement KPI Dashboard
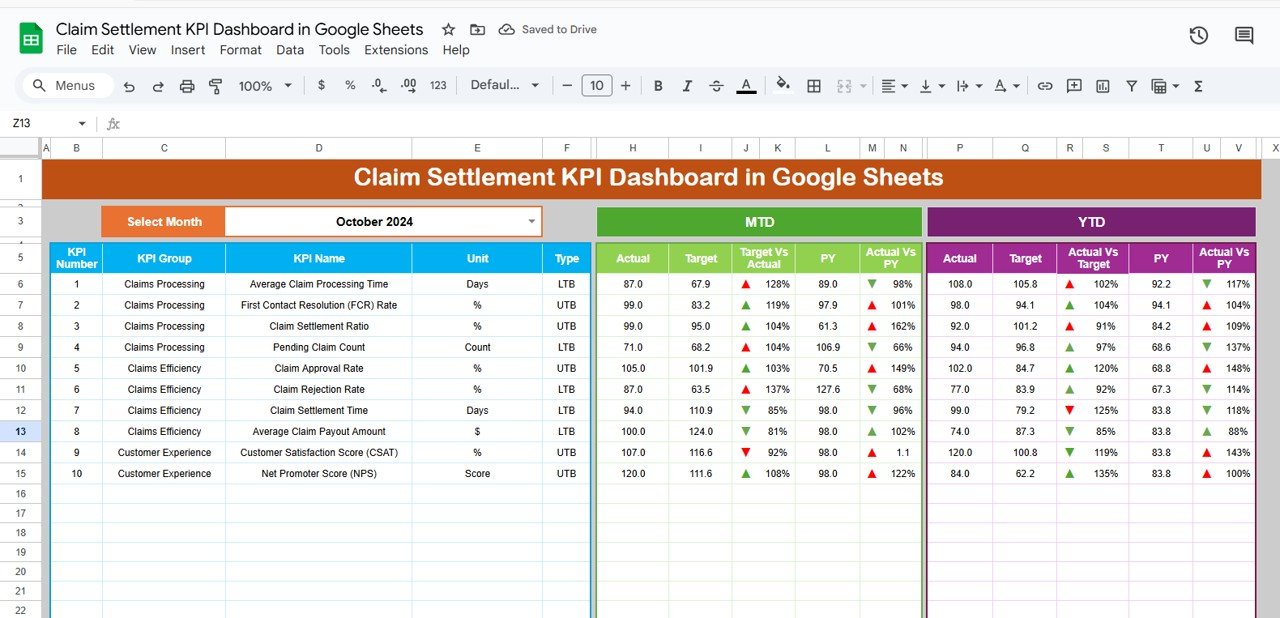
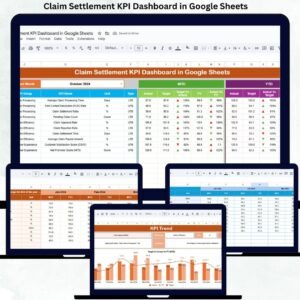
🖥 Dashboard Sheet Tab – Executive Overview
This is the main control panel of the dashboard. Users select the reporting month from a dropdown in cell D3, and the entire dashboard updates automatically.
Metrics Displayed:
MTD (Month-to-Date)
-
Actual
-
Target
-
Previous Year
-
Target vs Actual
-
Previous Year vs Actual
YTD (Year-to-Date)
-
Actual
-
Target
-
Previous Year
-
Target vs Actual
-
Previous Year vs Actual
Visual Indicators
-
🟢 Green Arrow → Positive performance
-
🔴 Red Arrow → Negative performance
This sheet allows leadership to understand claim settlement efficiency within seconds.
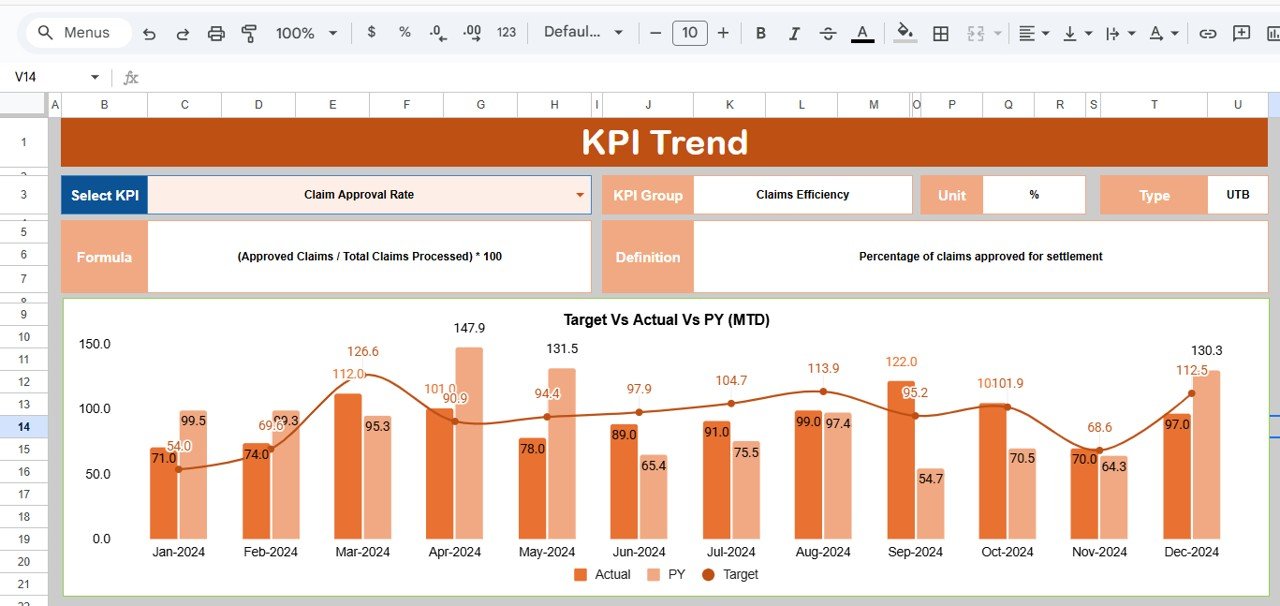
📈 KPI Trend Sheet – Detailed KPI Analysis
Users select a KPI from the dropdown in cell C3 to view:
-
KPI Group
-
Unit of Measurement
-
KPI Type (Lower the Better / Upper the Better)
-
KPI Formula
-
KPI Definition
Monthly trend visuals help teams identify whether claim processing speed, accuracy, or backlog is improving or deteriorating.
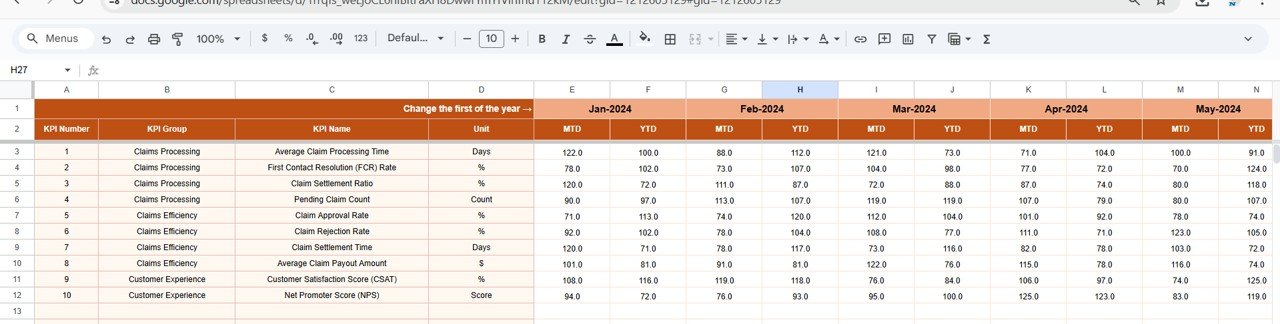
📋 Actual Number Sheet – Core Data Entry
This sheet stores:
-
MTD Actual values
-
YTD Actual values
Users define the first month of the year in cell E1, and the structure adjusts automatically. All dashboard KPIs pull data from this sheet.
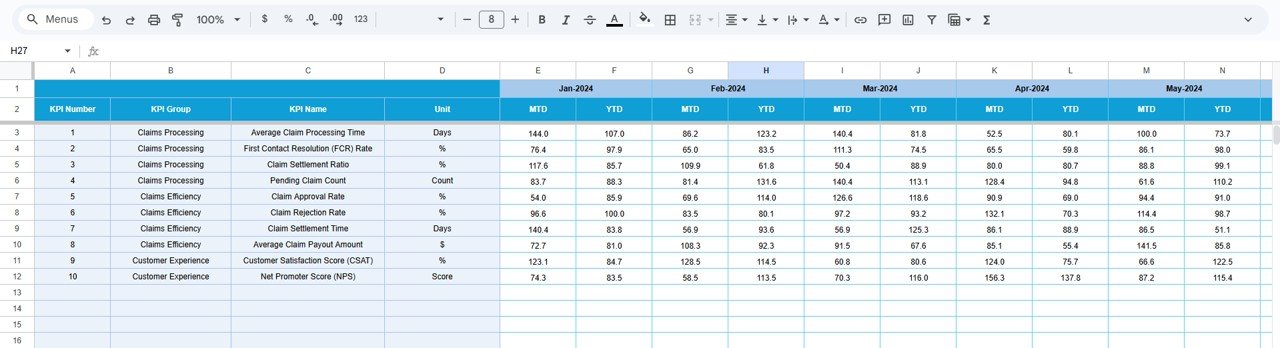
🎯 Target Sheet – Performance Benchmarks
Enter monthly and annual targets for each KPI. Targets help claims teams:
-
Improve SLA compliance
-
Reduce settlement delays
-
Control claim processing costs
📆 Previous Year Number Sheet – Historical Comparison
Stores last year’s KPI values to enable:
-
Year-over-year comparison
-
Long-term performance evaluation
-
Process improvement analysis
📘 KPI Definition Sheet – Standardization & Clarity
This reference sheet contains:
-
KPI Name
-
KPI Group
-
Unit
-
Formula
-
Definition
-
KPI Type (LTB / UTB)
It ensures consistent understanding across claims, operations, and leadership teams.
🛠 How to Use the Dashboard
1️⃣ Enter actual claim KPI values regularly
2️⃣ Define targets for settlement efficiency
3️⃣ Select the reporting month
4️⃣ Review MTD, YTD, and YOY performance
5️⃣ Use KPI trends for continuous improvement
🎯 Who Can Benefit from This Dashboard
-
🏥 Insurance Companies
-
🧾 Third-Party Administrators (TPAs)
-
📊 Claims & Operations Teams
-
⚖️ Risk & Compliance Teams
-
🧩 Claims Managers & Leadership
Click here to Read detailed blog post
Watch the step-by-step video tutorial:


Reviews
There are no reviews yet.