Corporate learning has become a strategic pillar for modern organizations. Today, companies invest heavily in corporate universities to build leadership pipelines, close skill gaps, and align employee development with business goals. However, when training data is spread across emails, LMS exports, and multiple Excel files, leaders struggle to understand real learning impact.
That is exactly where the Corporate Universities Dashboard in Excel becomes a powerful game-changer.
This ready-to-use Excel dashboard converts raw corporate learning data into clear, structured, and actionable insights. Instead of spending hours preparing manual training reports, HR and L&D teams can instantly track program costs, assessment scores, completion rates, enrollments, and participant satisfaction from a single interactive dashboard.
Because it is built entirely in Microsoft Excel, this dashboard is easy to use, cost-effective, and highly customizable—without any BI tools or coding knowledge.
🚀 Key Features of the Corporate Universities Dashboard in Excel
This dashboard is designed specifically for corporate learning and development teams.
🎯 Centralized Learning Analytics
Track all corporate university programs in one structured dashboard.
💰 Training Cost Visibility
Analyze program costs across corporate universities, departments, and regions.
📊 Assessment & Completion Tracking
Monitor average assessment scores and completion percentages easily.
🧑🏫 Trainer Effectiveness Analysis
Compare assessment scores by trainer type.
🧠 Delivery Mode Insights
Understand enrollment trends across classroom, virtual, and hybrid programs.
🎛 Interactive Slicers & Navigation
Filter insights instantly by department, program type, region, or month.
📦 What’s Inside the Corporate Universities Dashboard
The dashboard includes five professionally structured analytical pages, each focused on a critical learning dimension.
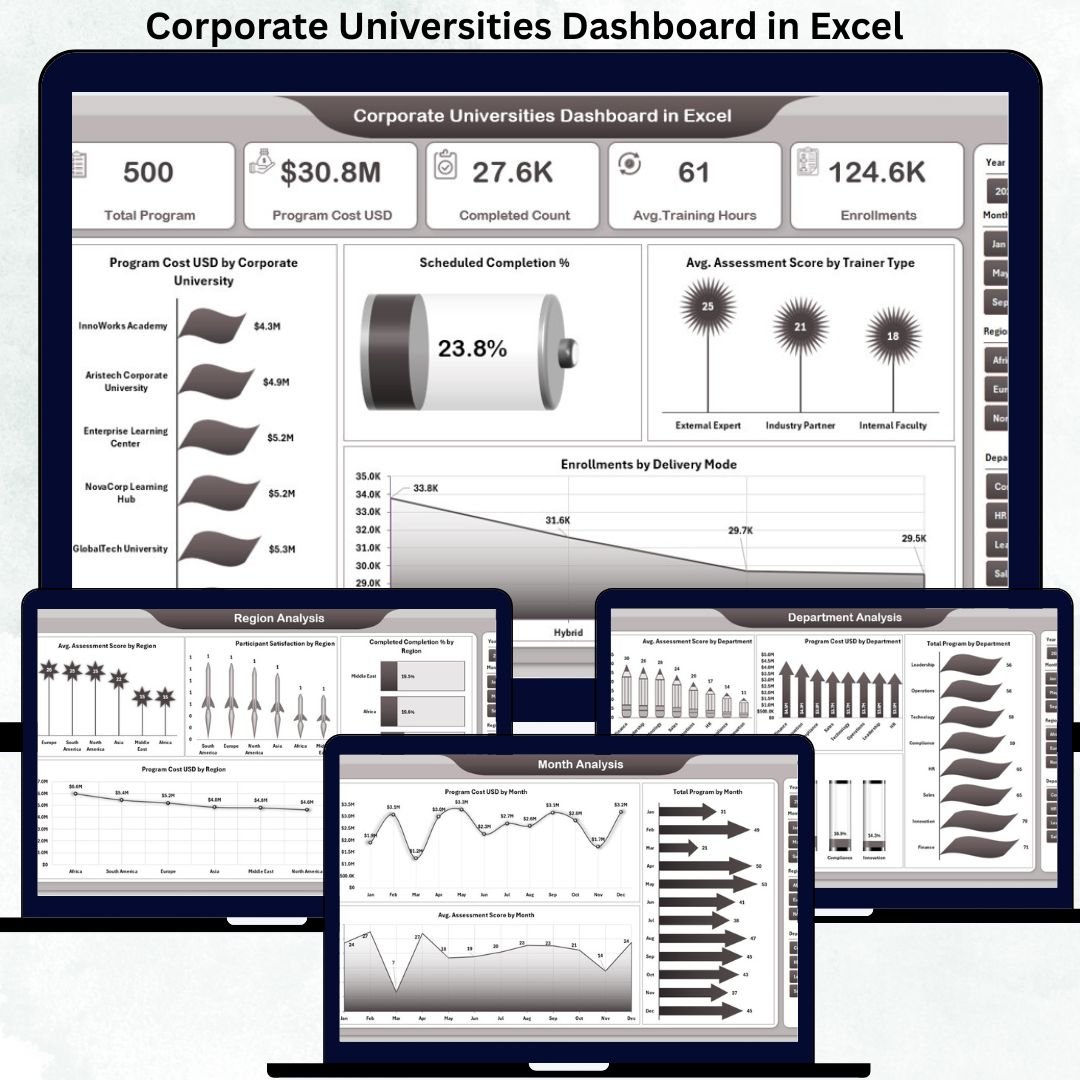
📊 Overview Page – Corporate Learning at a Glance
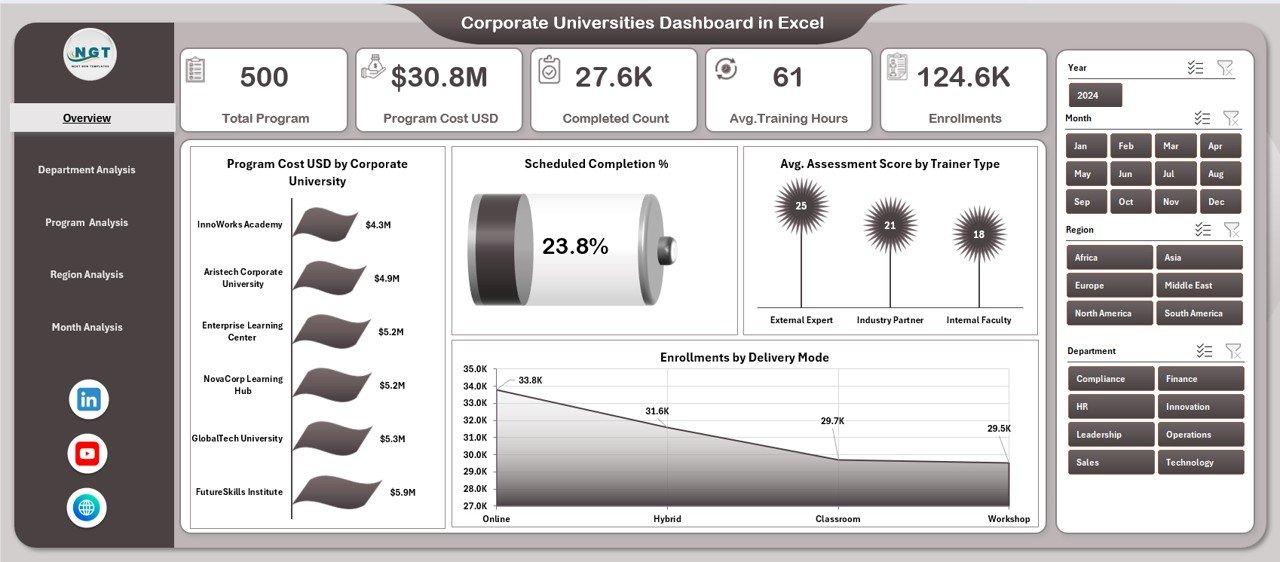
This is the main command center of the dashboard.
KPI Cards
Quickly review high-level corporate learning performance indicators.
Key Charts
-
Program Cost USD by Corporate University
-
Scheduled Completion %
-
Average Assessment Score by Trainer Type
-
Enrollments by Delivery Mode
This page gives leadership instant visibility into training investment, learning quality, and participation trends.
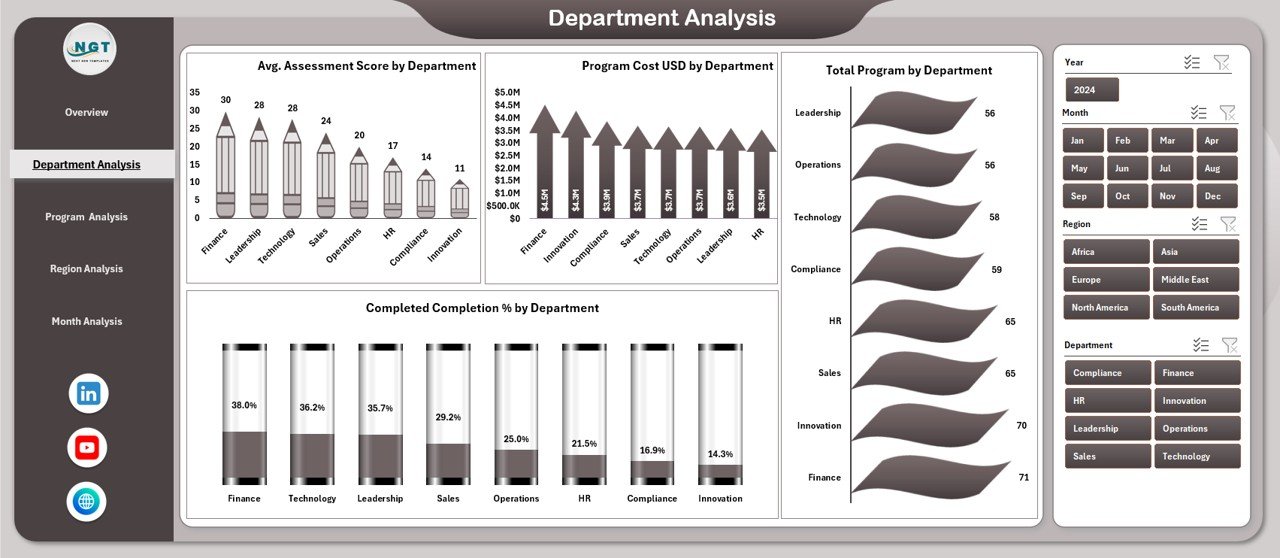
🏢 Department Analysis – Department-Wise Learning Performance
This page highlights how different departments perform in learning initiatives.
Charts Included
-
Average Assessment Score by Department
-
Program Cost USD by Department
-
Total Programs by Department
-
Completed Completion % by Department
It helps HR teams identify departments that need learning intervention or optimization.
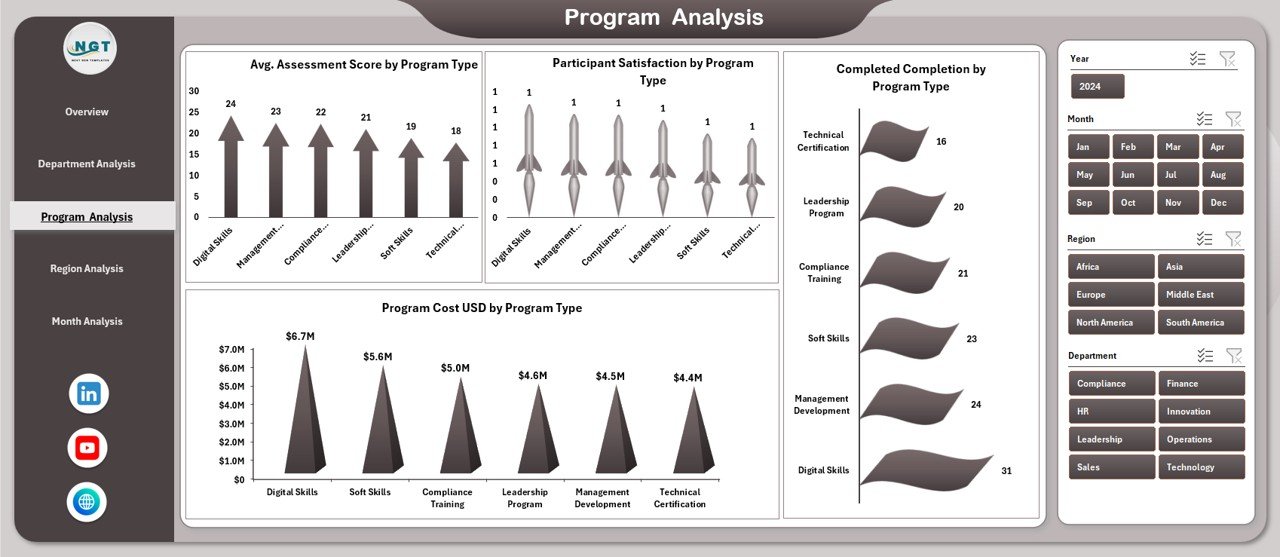
📘 Program Analysis – Which Program Types Deliver Results?
The Program Analysis Page evaluates learning effectiveness by program category.
Charts Included
-
Average Assessment Score by Program Type
-
Program Cost USD by Program Type
-
Participant Satisfaction by Program Type
-
Completed Completion by Program Type
This analysis supports smarter program portfolio decisions and ROI improvement.
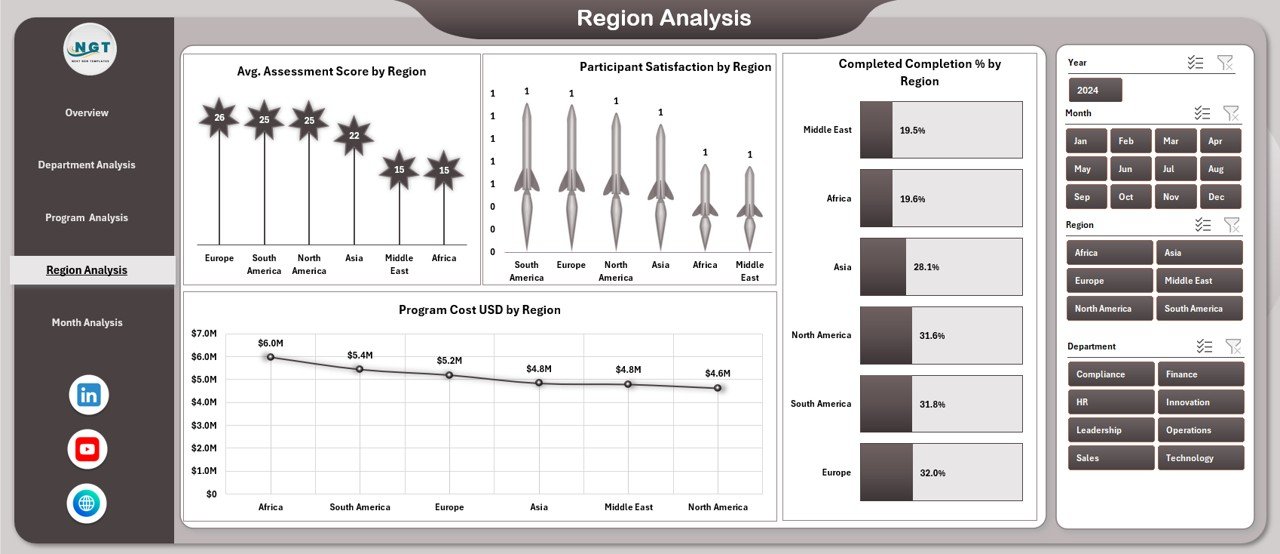
🌍 Region Analysis – Regional Learning Insights
The Region Analysis Page compares learning performance across geographies.
Charts Included
-
Average Assessment Score by Region
-
Program Cost USD by Region
-
Participant Satisfaction by Region
-
Completed Completion by Region
It helps global organizations align regional training strategies with enterprise goals.
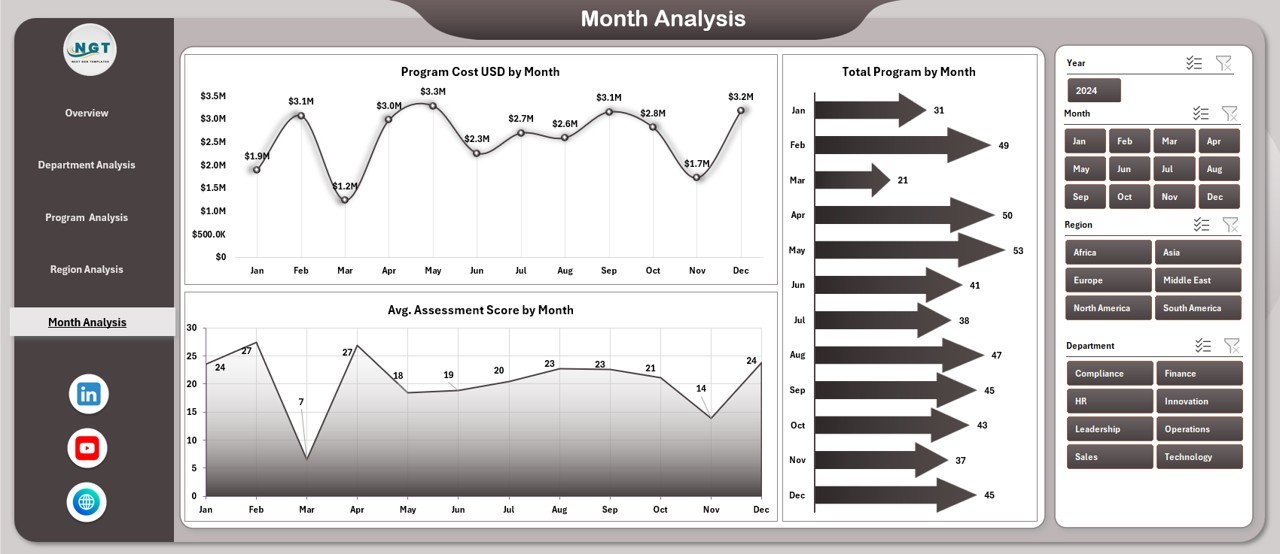
📆 Month Analysis – Learning Trends Over Time
The Month Analysis Page focuses on time-based insights.
Charts Included
-
Average Assessment Score by Month
-
Total Programs by Month
-
Program Cost USD by Month
This page supports forecasting, budget planning, and seasonal training analysis.
⚙️ How to Use the Corporate Universities Dashboard
1️⃣ Enter training data into the structured Data Sheet
2️⃣ Refresh pivot tables (if required)
3️⃣ Use slicers to filter by department, region, program type, or month
4️⃣ Review KPIs and charts instantly
5️⃣ Identify learning gaps, cost drivers, and high-impact programs
6️⃣ Make faster, data-driven L&D decisions
No macros. No complex setup. Just Excel.
👥 Who Can Benefit from This Dashboard?
This dashboard is ideal for:
-
🎓 Corporate University Administrators
-
👥 HR & L&D Managers
-
🧑💼 Department Heads
-
📊 HR Analytics Teams
-
🏢 Training Coordinators
-
📈 Senior Leadership
Anyone responsible for corporate learning strategy will benefit immediately.
### Click here to read the Detailed blog post
Visit our YouTube channel to learn step-by-step video tutorials
👉 Youtube.com/@PKAnExcelExpert


Reviews
There are no reviews yet.