


Banking operations run on speed, accuracy, compliance, and customer trust. Every day, banks process thousands of transactions, service requests, reconciliations, audits, and regulatory checks. When operational performance is not tracked properly, small inefficiencies quickly turn into delays, errors, compliance risks, and dissatisfied customers. The Banking Operations KPI Dashboard in Google Sheets is designed to solve this challenge by giving banks a centralized, structured, and real-time view of operational performance.
This ready-to-use dashboard converts raw operational data into clear KPIs, performance trends, and meaningful comparisons. Instead of relying on manual reports or disconnected spreadsheets, banking teams can monitor efficiency, quality, and compliance from one interactive dashboard. Because it is built entirely in Google Sheets, it is easy to use, cloud-based, collaborative, and cost-effective—without the need for complex BI tools.

✨ Key Features of the Banking Operations KPI Dashboard in Google Sheets
📊 Automated MTD & YTD Performance Tracking
Track Month-to-Date and Year-to-Date performance for all banking operation KPIs. A single month selection refreshes the entire dashboard instantly.
🎯 Target vs Actual Comparison
Clearly compare operational performance against defined targets to identify gaps and improvement areas.
📈 Previous Year Performance Analysis
Analyze current performance against last year’s results to measure progress and operational maturity.
📉 KPI Trend Analysis
Review month-wise trends for individual KPIs to detect bottlenecks, seasonality, and risk patterns.
🌐 Cloud-Based & Team-Friendly
Built in Google Sheets, the dashboard supports real-time collaboration, easy sharing, and secure access control.
📦 What’s Inside the Banking Operations KPI Dashboard
🖥️ Dashboard Sheet Tab (Main Dashboard)
This is the executive summary view of all KPIs. Select the reporting month from cell D3, and the dashboard updates automatically.
MTD Metrics Displayed
-
Actual
-
Target
-
Previous Year
-
Target vs Actual
-
Previous Year vs Actual
YTD Metrics Displayed
-
Actual
-
Target
-
Previous Year
-
Target vs Actual
-
Previous Year vs Actual
Visual indicators make insights instant:
-
🟢 Green arrow → Improvement
-
🔴 Red arrow → Decline
This page is perfect for leadership reviews, branch meetings, and monthly performance discussions.
📈 KPI Trend Sheet Tab
This sheet allows deep analysis of any KPI.
Select a KPI from the dropdown in cell C3, and the dashboard displays:
-
KPI Group
-
Unit of Measurement
-
KPI Type (Lower the Better / Upper the Better)
-
KPI Formula
-
KPI Definition
Trend visuals help teams understand performance behavior over time and support process optimization.
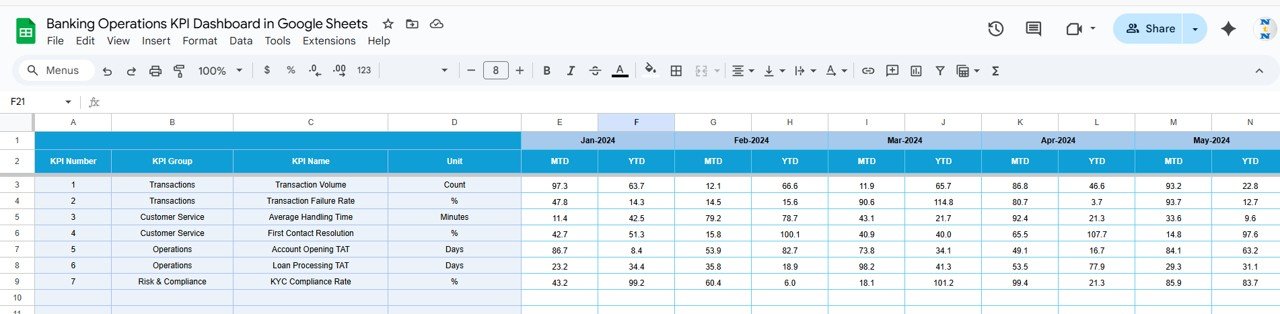
📋 Actual Number Sheet Tab
This sheet captures operational actuals.
-
Enter MTD and YTD actual values
-
Select the first month of the year in cell E1
-
The structure automatically aligns monthly data
This sheet acts as the main data input layer.
🎯 Target Sheet Tab
Define operational goals and benchmarks.
-
Monthly (MTD) targets
-
Cumulative (YTD) targets
Targets help enforce accountability and service standards across banking operations.
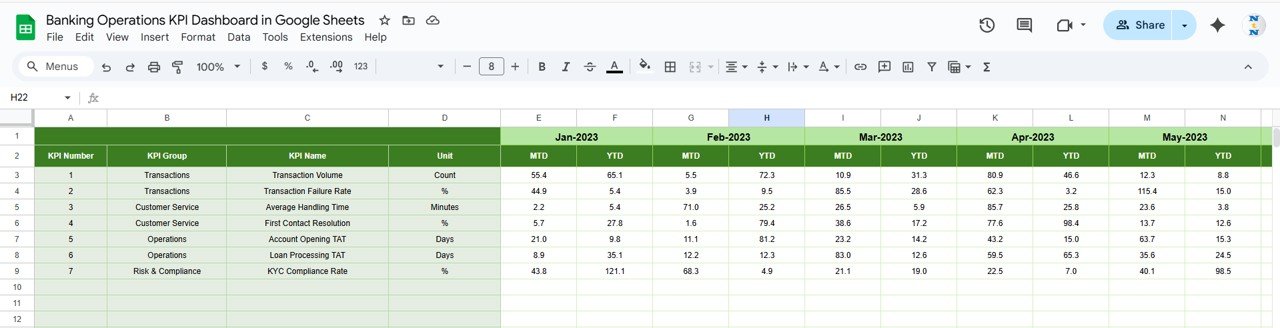
📆 Previous Year Number Sheet Tab
Stores historical data to support:
-
Year-over-year comparison
-
Long-term trend analysis
-
Process maturity evaluation
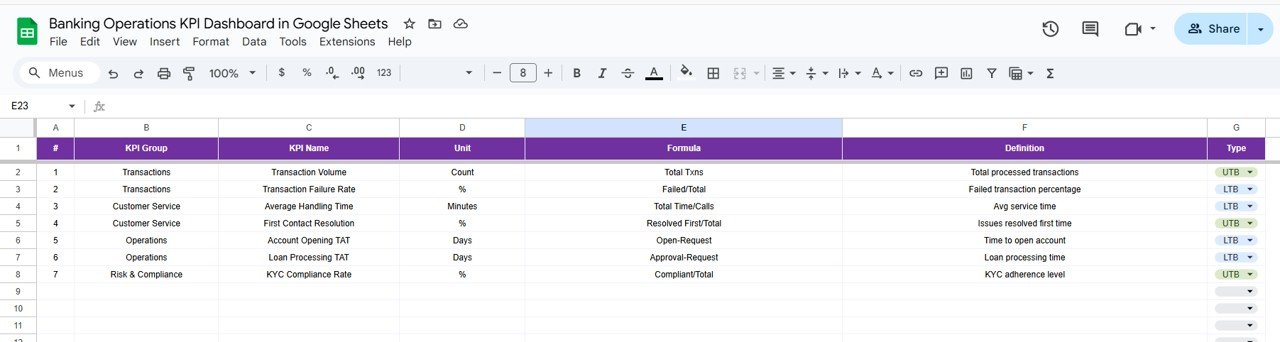
📘 KPI Definition Sheet Tab
The reference backbone of the dashboard, containing:
-
KPI Name
-
KPI Group
-
Unit
-
Formula
-
Definition
-
KPI Type (LTB / UTB)
This ensures clarity, consistency, and shared understanding across teams.
🛠️ How to Use the Banking Operations KPI Dashboard
1️⃣ Update Actuals Regularly
Enter operational data weekly or monthly for accurate insights.
2️⃣ Set Clear Targets
Align targets with service-level agreements and compliance goals.
3️⃣ Select the Month to Refresh KPIs
One dropdown updates the entire dashboard instantly.
4️⃣ Review Trends Monthly
Use trend analysis to improve efficiency and reduce risk.
5️⃣ Compare Against Previous Year
Measure improvement and identify long-term performance gaps.
🎯 Who Can Benefit from This Dashboard
🏦 Banking Operations Teams
Monitor efficiency, processing time, and service quality.
📊 Branch Managers & Regional Heads
Track performance consistency across teams and locations.
⚖️ Compliance & Risk Teams
Monitor operational risk and control indicators.
👔 Senior Leadership
Gain quick visibility into operational health.
🚀 Growing Financial Institutions
Scale operations with structured performance monitoring.
### Click here to read the Detailed blog post
Watch the step-by-step video tutorial:


Reviews
There are no reviews yet.